Vol. 49, n. 1 : pp. 63-71, January 2006
ISSN 1516-8913 Printed in Brazil BRAZILIAN ARCHIVES OF
BIOLOGY AND TECHNOLOGY
A N I N T E R N A T I O N A L J O U R N A L
Fumonisins in Corn: Correlation with
Fusarium
sp. Count,
Damaged Kernels, Protein and Lipid Content
Elisabete Yurie Sataque Ono1*, Luciana Biazon1, Marcelo da Silva1, Édio Vizoni2,
Yoshitsugu Sugiura3, Yoshio Ueno4 and Elisa Yoko Hirooka5
1Departamento de Bioquímica e Biotecnologia; 2Departamento de Matemática Aplicada; 5 Departamento de
Tecnologia de Alimentos e Medicamentos; Universidade Estadual de Londrina; C. P. 6001; [email protected]; 86051-980; Londrina - PR - Brasil. 3Kobe Institute of Health; Department of Food Chemistry; 4-6 Minatojima - Nakamachi; Chuo-ku; Kobe; 650-0046; Japan. 4Yashio Institute of Environmental Sciences; Usui Bldg. 2F; 8-10 Nishi-Gokencho; Shinjukuku, Tokyo; 162-0812; Japan
ABSTRACT
Natural fungal and fumonisin contamination were evaluated in 109 freshly harvested corn samples from Paraná State and correlated to damaged kernels (%). In addition, healthy and damaged kernels of 24 corn samples were selected in order to compare the mycoflora profile and fumonisin levels. The correlation among protein/lipid content and fumonisin levels was also analyzed in the 15 most frequently cultivated corn hybrids. Total fungal colony count in 109 freshly harvested corn samples ranged from 1.9x10⁴ to 3.5x10⁶ CFU/g, Fusarium sp. count from 1.0x10³ to 2.2x10⁶ CFU/g, and fumonisin levels from 0.13 to 20.38 µg/g. Total fungal colony/Fusarium sp. count and fumonisin levels showed positive correlation (p < 0.05). In addition, there was a positive correlation between damaged kernels (%) and total fungal colony/Fusarium sp. count (p < 0.05). Fumonisin levels in healthy kernels ranged from 0.57 to 20.38 µg/g, while in the damaged kernels it ranged from 68.96 to 336.38 µg/g. No significant correlation among the fumonisin levels and the protein or lipid content was observed. The results showed the importance of constant monitoring of toxigenic fungi and fumonisin contamination in corn and corn-based foods in order to assure the quality and safety of products and to minimize the potential hazards to human and animal health.
Key words: Mycoflora, toxigenic fungi, mycotoxins, fumonisins, corn quality
*
INTRODUCTION
Corn (Zea mays L.) is an important cereal crop in Brazil, with an annual production of 42.8 million (metric) tons ranking the country as the third largest corn producer in the world. Southern Brazil produces 45% of Brazilian corn, and Paraná State accounts for 25% of the national production (CONAB, 2003). Corn quality depends on the hybrid and it is affected by cultural and climatic
conditions, harvesting, drying, storage, handling, and transportation methods (Watson, 1987). Accuracy in sampling and grading is necessary due to the price differential between designated grades and price discounts by grade factors (Bauwin and Ryan, 1974).
Damaged kernels are of great concern due to the loss of corn quality and the potential occurrence of mycotoxins. As the amount of damaged kernels increases, the discounts are greater and sometimes all the lot could be refused (Martins, 1995). The Food and Agricultural Organization (FAO) estimated contamination with mycotoxins in 25% of the world’s crop, and the main fungi involved belonged to the Aspergillus, Penicillium and
Fusarium genera (Pitt et al., 2000). Mycotoxins
can cause a variety of toxic symptoms in humans and animals, ranging from gastroenteritis to cancer. Besides direct concerns over human health, mycotoxins have major economic impact on livestock productivity (Coulomb Jr., 1993).
In freshly harvested corn, fumonisins produced by
Fusarium verticillioides (= F. moniliforme) remain
the main problem because currently there are no proven practical methods for significantly reducing fumonisin levels in corn (Munkvold and Desjardins, 1997). Twenty-eight different fumonisins have been identified so far (Rheeder et al., 2002), however only FB1, FB2, and FB3 are detected as natural contaminants at significant levels in corn and corn based products (Murphy et al., 1993). FB1 causes equine leukoencephalomalacia in horses (Kellerman et al., 1990) and pulmonary edema in pigs (Harrison et al., 1990). Furthermore, epidemiological studies suggested probable involvement in esophageal (Thiel et al., 1992) and liver cancer in humans (Ueno, 2000). King and Scott (1981) reported genotypic differences in corn to kernel infection
by F. verticillioides which were under genetic
control. Genetic resistance to kernel infection offers the most potential for control of the mould infection and/or mycotoxin production (Headrick and Pataky, 1991).
In this study, natural fungal and fumonisin contamination were evaluated in 109 freshly harvested corn samples from Paraná State and correlated to damaged kernels (%). In addition, the correlations among protein/lipid content and fumonisin levels were analyzed.
MATERIAL AND METHODS
Sampling
A total of 109 freshly harvested corn (Zea mays L.) samples were collected directly from the trucks at the delivery post of cooperatives in Paraná State, during the April/1995 crop. Random sampling was performed in the Central-Southern (13 samples), Central-Western (59 samples) and Northern (37 samples) regions of the State. Corn kernels were taken randomly from 9 to 12 truck body sites and pooled (3.6-5.0 kg), following the sampling protocol established by the Brazilian guidelines (Brasil, 1976). The samples were immediately sent to the laboratory and maintained at 4oC for maximum 7 days for microbiological analysis. For fumonisin determination, 1kg of the corn sample was dried at 70oC with circulating air in order to reach 11% moisture content.
In addition, healthy and damaged kernels from 24 corn samples from the Northern region of Paraná State were selected in order to compare the mycoflora profile and fumonisin levels, taking into account that the highest fumonisin contamination in the Northern corn samples was observed in previous study (Hirooka et al., 1996).
Moisture content
The moisture content (%) of the corn samples was determined immediately after sampling using a Geole 400 moisture meter (Gehaka Co., São Paulo).
Damaged kernels (%)
Damaged kernels (%) were determined during corn classification at the delivery post of cooperatives in Paraná State.
Mycoflora analysis
Fumonisin analysis
Fumonisins B1 and B2 were analyzed according to Shephard et al. (1990)) with some modification ) (Ueno et al., 1993). The corn kernels (200 g) were ground to 50 mesh in a laboratory mill, and 10 g powder was mixed with 30 mL methanol:water (3:1, v/v). After standing for 10 min at room temperature, the suspension was shaken at 150 rpm for 30 min and centrifuged at 4500 x g for 10 min. The crude extract (1.0 mL) was applied to preconditioned Sep Pak accell plus QMA cartridge (Waters Co., Ltd.). After washing the cartridge with methanol-water (3:1, 6 mL) followed by methanol (3 mL), fumonisins were eluted with 10 mL methanol containing 0.5% acetic acid. The eluate was evaporated to dryness under a stream of nitrogen at 45oC, the residue was dissolved in methanol-water (3:1, 800 µL) and a 200 µl aliquot dried under nitrogen. After derivatization with 200
µL O-phthaldialdehyde reagent (40 mg OPA, 1 mL methanol, 5 mL 0.1M sodium borate and 50
µL 2- mercaptoethanol), HPLC injections were made within 1 min. Fumonisins were analyzed by a reversed-phase isocratic HPLC system (Shimadzu LC-10 AD pump and RF 535 fluorescence detector), using a Shim-pack CLC-ODS (M) column (4.6 x 250 mm, Shimadzu). Excitation and emission wavelengths were 335 nm and 450 nm, respectively. The eluent was CH3OH:0.1 M NaH2PO4 (80:20, v/v) adjusted to pH 3.3 with ortho-phosphoric acid. The flow rate
was 1 mL/min. The detection limits for FB1 and FB2 were 50 ng/g and 80 ng/g, respectively.
Nitrogen and lipid determination
Nitrogen and lipid content were analyzed in the 15 corn hybrids most frequently cultivated in Paraná State (n= 68 samples). Nitrogen content was determined by the Kjeldahl method (A.O.A.C., 1984, method 7015), using 6.25 as the factor to obtain the total protein content. Lipid content was determined by the Soxhlet method (I.A.L., 1985, method 4.10).
Statistical analysis
The Pearson correlation for variables (total fungal colony count, Fusarium sp. count, fumonisin levels, and damaged kernels) were analyzed by the t- test. Then the samples were subdivided into three groups based on their total fungal colony count. Total fungal colony count, Fusarium sp. count, fumonisin levels, damaged kernels and moisture content were statistically evaluated using ANOVA followed by Tukey’s multiple comparison test (p<0.05). Statistical analysis was performed by the ‘Statistica’ software version 5.0. The protein/lipid content and fumonisin levels were analyzed by the Pearson correlation test. The data were statistically evaluated using ANOVA, followed by Tukey’s multiple comparison test (p<0.05).
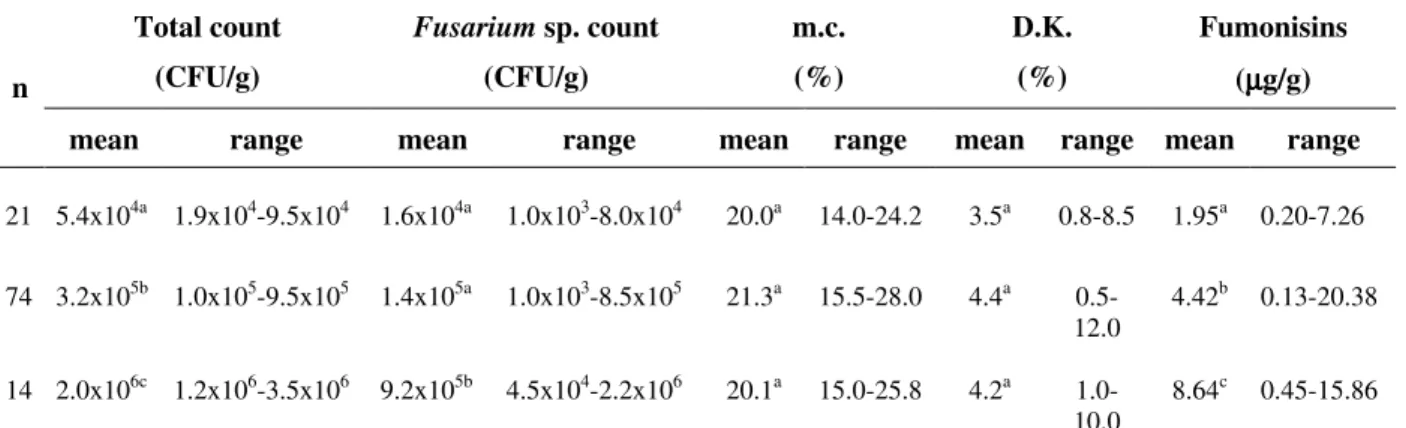
Table 1 - Profile of total fungal colony count, Fusarium sp. count, moisture content, damaged kernels and fumonisin levels in 109 corn samples from Paraná State.
Total count Fusarium sp. count m.c. D.K. Fumonisins
(CFU/g) (CFU/g) (%) (%) (µµµµg/g)
n
mean range mean range mean range mean range mean range
21 5.4x10⁴a 1.9x10⁴-9.5x10⁴ 1.6x10⁴a 1.0x10³-8.0x10⁴ 20.0a 14.0-24.2 3.5a 0.8-8.5 1.95a 0.20-7.26
74 3.2x10⁵b 1.0x10⁵-9.5x10⁵ 1.4x10⁵a 1.0x10³-8.5x10⁵ 21.3a 15.5-28.0 4.4a 0.5-12.0
4.42b 0.13-20.38
14 2.0x10⁶c 1.2x10⁶-3.5x10⁶ 9.2x10⁵b 4.5x10⁴-2.2x10⁶ 20.1a 15.0-25.8 4.2a 1.0-10.0
8.64c 0.45-15.86
RESULTS AND DISCUSSION
Total fungal colony count in 109 freshly harvested corn samples ranged from 1.9x10⁴ to 3.5x10⁶ CFU/g, Fusarium sp. count from 1.0x10³ to 2.2x10⁶ CFU/g, fumonisin levels from 0.13 to 20.38 µg/g and mean moisture content from 20.0 to 21.3% (Table 1).
The highest fungal contamination (106 CFU/g) occurred in corn samples harvested in the Northern region (27.0%) followed by the Central-Western (6.8%), but in the Central-Southern samples it was lower. In samples from the Northern region, total fungal colony count ranged from 1.9x10⁴ to 3.5x10⁶ CFU/g, with Fusarium sp. count ranging from 1.0x10³ to 2.2x10⁶ CFU/g. In samples from the Central-Western region, total fungal colony count ranged from 3.6 x10⁴ to 2.1 x10⁶ CFU/g, whereas in the Central-Southern region from 3.6 x10⁴ to 3.6 x10⁵ CFU/g (data not shown). A high level of fumonisin contamination was detected in the corn samples from the Northern (range 0.57 to 20.38 µg/g) and the Central-Western (range 0.32 to 15.86 µg/g) regions, when compared to the Central-Southern 0.13 to 3.66 µg/g (data not shown). These fumonisin levels were lower than those reported in freshly harvested and stored corn samples from Ribeirão Preto, São Paulo State (Orsi et al., 2000), but higher than those reported
by Figueira et al. (2003) for 37 corn samples from the Northern region of Paraná State (range 0.05 to 2.67 µg/g). Figueira et al. (2003) detected lower fumonisin levels in corn samples probably due to the immediate drying after harvesting. Such a procedure probably prevented fungal growth during the interval between harvesting and drying, where the critical fumonisin production occurs, i.e. delay in drying process can quickly increase fumonisin concentration by a 10-fold factor. The mean Fusarium sp. count was higher in samples with higher amount of damaged kernels (Table 1), although no significant differences were found among the means of damaged kernels (%) analyzed by ANOVA.
The amount of damaged kernels (range from 0.5% to 12%) was lower than that reported by Pascale et al. (1997) who detected <1% up to 60% of damaged kernels in corn ears inoculated under field conditions with F. verticillioides.
The mean fumonisin level increased gradually from 1.95 µg/g (5.4x10⁴ CFU/g) to 4.42 µg/g (3.2x10⁵ CFU/g) and 8.64 µg/g (2.0x10⁶ CFU/g) as the total fungal colony count increased (Table 1). Fumonisin levels and total fungal colony (ρ=0.327)/Fusarium sp. count (ρ=0.252) showed
positive correlation (p < 0.05) (Table 2).
Table 2 - Correlation matrices between fumonisins, total fungal count, Fusarium sp. and damaged kernels
Variables Fumonisins* (µµµµg/g) Total count (CFU/g) Fusarium sp. (CFU/g)
Damaged kernels (%)
Fumonisins ρ=1.000 ρ =0.327 ** ρ =0.252** ρ =0.098
(µg/g) p= --- p=0.001** p=0.011** p=0.328
Total count ρ=0.327 ** ρ=1.000 ρ=0.502** ρ=0.203**
(CFU/g) p=0.001** p= --- p=0.000** p=0.041**
Fusarium sp. ρ=0.252** ρ=0.502** ρ=1.000 ρ=0.305**
(CFU/g) p=0.011** p=0.000** p= --- p=0.002**
Damaged ρ=0.098 ρ=0.203** ρ=0.305** ρ=1.000
kernels (%) p=0.328 p=0.041** p=0.002** p= ---
*Fumonisins: FB1 + FB2 , **Marked correlations are significant at p < 0.05, ρ= correlation, p= probability
Table 3 compares the mycoflora profile and fumonisin levels in healthy and damaged kernels
from 24 corn samples belonging to the same lot from the Northern region of Paraná State.
Table 3 - Total fungal colony count, Penicillium sp., Fusarium sp., Aspergillus sp. count and fumonisin levels in healthy and damaged kernels of 24 corn samples from the Northern region of Paraná State belonging to the same lot.
Healthy kernels Damaged kernels
Total PEN FUS FBs* Total PEN FUS ASP FBs*
Sample
(CFU/g) (µµµµg/g) (CFU/g) (µµµµg/g)
01 4.1x10⁵ 3.9x10⁵ 2.0x10⁴ 1.43 1.9x10⁶ 5.0x10⁵ 1.4x10⁶ - 171.38 02 2.8x10⁵ 1.2x10⁵ 1.6x10⁵ 3.98 2.0x10⁶ 7.0x10⁵ 1.2x10⁶ - 160.12 03 2.1x10⁵ 1.9x10⁵ 1.0x10³ 6.39 8.0x10⁶ 2.5x10⁶ 5.5x10⁶ 1.0x10⁵ 119.32 04 4.7x10⁵ 4.6x10⁵ 1.0x10⁴ 10.4 7.5x10⁶ 1.0x10⁶ 5.5x10⁶ - 336.38 05 2.9x10⁵ 1.0x10⁴ 2.8x10⁵ 20.38 1.0x10⁷ 1.5x10⁶ 7.0x10⁶ - 288.16 06 2.3x10⁵ 1.5x10⁵ 3.0x10⁴ 14.59 6.5x10⁶ 1.5x10⁶ 5.0x10⁶ 1.0x10⁴ 194.81 07 2.5x10⁵ 2.0x10⁵ 1.0x10⁴ 5.98 1.8x10⁶ 3.0x10⁵ 1.5x10⁶ - 68.97 08 1.6x10⁵ 1.5x10⁵ 3.0x10³ 7.03 2.0x10⁶ 7.5x10⁵ 1.1x10⁶ - 103.51 09 1.0x10⁵ 1.0x10⁴ 9.0x10⁴ 3.47 1.5x10⁶ 2.0x10⁵ 1.3x10⁶ - 98.08 10 2.6x10⁴ 1.7x10⁴ 8.5x10³ 2.35 1.9x10⁷ 1.0x10⁵ 1.8x10⁷ - 297.14 11 2.3x10⁵ 1.3x10⁵ 1.5x10⁴ 0.57 3.4x10⁶ 7.5x10⁵ 2.6x10⁶ - 99.37 12 3.1x10⁵ 2.9x10⁵ 1.0x10⁴ 4.42 3.5x10⁶ 7.0x10⁵ 2.7x10⁶ 4.0x10³ 70.68 13 3.2x10⁵ 2.9x10⁵ 3.0x10⁴ 8.55 5.1x10⁶ 3.0x10⁵ 4.7x10⁶ 1.0x10⁵ 244.76 14 4.6x10⁴ 7.0x10³ 3.6x10⁴ 1.69 2.6x10⁷ - 2.6x10⁷ - 281.26 15 5.7x10⁴ 5.3x10⁴ 3.5x10³ 4.94 3.2x10⁶ 5.0x10⁵ 2.6x10⁶ 1.0x10⁵ 270.68 16 2.5x10⁵ 1.7x10⁵ 6.5x10⁴ 11.78 4.9x10⁶ 6.5x10⁵ 4.1x10⁶ - 232.65 17 3.6x10⁴ 1.4x10⁴ 1.4x10⁴ 6.03 4.4x10⁶ 1.0x10⁵ 4.3x10⁶ - 235.18 18 4.4x10⁵ 3.7x10⁵ 1.5x10⁴ 3.98 1.7x10⁶ 6.0x10⁵ 1.0x10⁶ - 120.20 19 3.3x10⁴ 2.6x10⁴ 1.0x10³ 7.26 4.1x10⁶ 4.0x10⁵ 3.7x10⁶ 1.0x10³ 208.74 20 1.6x10⁴ 1.0x10⁴ 3.0x10³ 2.16 1.7x10⁷ 2.0x10⁶ 1.5x10⁷ - 107.45 21 3.0x10⁴ 1.0x10⁴ 8.5x10³ 3.79 1.9x10⁶ 1.5x10⁵ 1.6x10⁶ - 100.38 22 1.5x10⁵ 2.0x10⁴ 1.3x10⁵ 8.47 5.5x10⁷ - 5.5x10⁷ - 269.57 23 2.3x10⁴ 1.9x10⁴ 4.0x10³ 1.63 9.5x10⁶ 1.0x10⁶ 7.0x10⁶ - 113.31 24 2.8x10⁴ 3.5x10³ 2.4x10⁴ 10.58 2.3x10⁷ 1.0x10⁵ 2.3x10⁷ - 252.82 PEN = Penicillium sp. FUS = Fusarium sp. ASP = Aspergillus sp. *FBs: FB1+ FB2
The fungal genera isolated from healthy kernels were Fusarium sp. (100%), Penicillium sp. (100%), Cladosporium sp. (4.2%), and yeasts (62.5%) (Fig. 1).
Total fungal colony count ranged from 1.6x10⁴ to 4.7x10⁵ CFU/g, Penicillium sp. from 3.5x10³ to 4.6x10⁵ CFU/g and Fusarium sp. from 1.0x10³ to 2.8x10⁵ CFU/g (Table 3). The same fungal genera isolated from healthy kernels were also detected in damaged kernels but in different percentage and counting: Fusarium sp. (100%), Penicillium sp. (91.6%), Aspergillus sp. (25%), Cladosporium sp. (12.5%), and yeasts (29.2%) (Fig. 1). Total fungal
colony count ranged from 1.5x10⁶ to 5.5x10⁷ CFU/g, Penicillium sp. from 1.0x10⁵ to 2.5x10⁶ CFU/g and Fusarium sp. from 1.0x10⁶ to 5.5x10⁷ CFU/g. Aspergillus sp. count ranged from 1.0x10³ to 1.0x10⁵ CFU/g (Table 3).
0 20 40 60 80 100
R
e
la
ti
v
e
f
re
q
u
e
n
c
y
(
%
)
Fusarium Penicillium Aspergillus Cladosporium yeasts
Healthy kernels Damaged kernels
Figure 1 - Relative frequency of fungi isolation from healthy and damaged kernels of 24 corn samples from the Northern region of Paraná State belonging to the same lot.
Fumonisin levels in healthy kernels ranged from 0.57 to 20.38 µg/g (mean of 6.33 ± 4.69 µg/g), while in the damaged kernels they ranged from 68.97 to 336.38 µg/g (mean of 185.2 ± 83.19 µg/g) (Table 3). Thus, in the damaged kernels fumonisin levels were 11.5 to 166-fold higher than those found in the healthy kernels, indicating that damaged kernels accounted for almost the totality of fumonisin contamination. Only four out of 24 samples (16.7%) containing damaged kernels showed fumonisin levels below 100 µg/g (Table 3), which was 20-fold higher than the maximum levels recommended for equines (5 µg/g), 10-fold for swine (10 µg/g), 2-fold for cattle and poultry (50 µg/g) according to “Mycotoxin Committee of the American Association of Veterinary Laboratory Diagnosticians” (Munkvold and Desjardins, 1997). Moreover, fumonisin levels detected in healthy grains (0.57 to 20.38 µg/g) were higher than those reported by Pascale et al. (1997) who evaluated the accumulation of FB1 and FB2 in 14 corn hybrids inoculated with F.
verticillioides. Fumonisins were detected in all 14
healthy looking kernels of inoculated ears. Fumonisin levels in Fusarium damaged kernels ranged from 5.1 µg/g to 196 µg/g FB1 and from 1.4 µg/g to 62.0 µg/g FB2. This fraction of kernels was visibly moldy and covered by mycelium (Pascale et al., 1997). The damaged kernels analyzed in our study showed dark points of several sizes, but they were not visibly moldy. Binkerd et al. (1993) analyzed 291 corn samples of the 1991 Indiana crop (USA) with different infection degrees for F. verticillioides. There was low correlation between the severity of infection and the fumonisin levels, suggesting that visual evaluation of samples could not be used to determine the risk of fumonisin contamination. However, Schaafsma et al. (1993) proposed the severity of ear rot to be a useful indicator of ear contamination by mycotoxins.
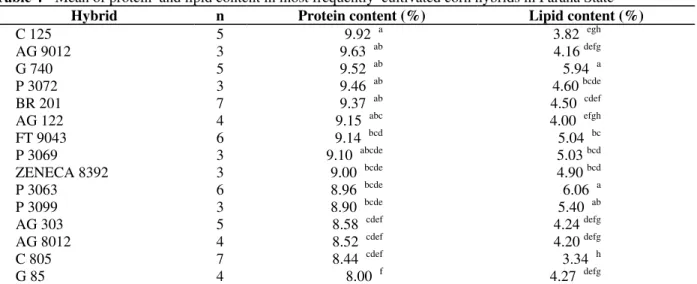
Table 4 - Mean of protein and lipid content in most frequently cultivated corn hybrids in Paraná State
Hybrid n Protein content (%) Lipid content (%)
C 125 5 9.92 a 3.82 egh
AG 9012 3 9.63 ab 4.16 defg
G 740 5 9.52 ab 5.94 a
P 3072 3 9.46 ab 4.60 bcde
BR 201 7 9.37 ab 4.50 cdef
AG 122 4 9.15 abc 4.00 efgh
FT 9043 6 9.14 bcd 5.04 bc
P 3069 3 9.10 abcde 5.03 bcd
ZENECA 8392 3 9.00 bcde 4.90 bcd
P 3063 6 8.96 bcde 6.06 a
P 3099 3 8.90 bcde 5.40 ab
AG 303 5 8.58 cdef 4.24 defg
AG 8012 4 8.52 cdef 4.20 defg
C 805 7 8.44 cdef 3.34 h
G 85 4 8.00 f 4.27 defg
*Means followed by the same letter indicate no significant difference by Tukey’s test (p < 0.05)
The lipid content showed a wide range from 3.34% (hybrid C805) to 6.06% (hybrid P3063). There was no significant correlation among the fumonisin levels and the protein or lipid content (p < 0.05). These results were in accordance with Shelby et al. (1994) who analyzed fumonisin contamination in 15 commercial corn hybrids planted at 17 locations in the USA. The mean fumonisin of all hybrids at the different locations ranged from 0.5 to 48.5 µg/g. Kernel characteristics such as protein, oil, starch, and total fiber of the hybrids were not correlated with fumonisin production. The differences in fumonisin levels among commercial hybrids suggested that hybrids could be selected for areas where fumonisin contamination was a problem (Shelby et al.,1994).
The maintenance of fumonisins at undetectable levels from post-harvest to the drying interval is a challenge (Marín et al., 1999). Therefore, efforts to reduce the harvest/drying interval, as well as the constant monitoring of toxigenic fungi and fumonisin contamination in corn and corn-based foods are essential in order to assure the quality and safety of products and to minimize the potential hazards to human and animal health.
ACKNOWLEDGEMENTS
The authors thank CNPq (the Brazilian Government Organization for grant aid and fellowship to Brazilian researchers), the Araucária
Foundation, FINEP and Paraná Fund (SETI) for financial support.
RESUMO
derivados a fim de garantir a qualidade e segurança dos produtos e minimizar o risco potencial à saúde humana e animal.
REFERENCES
Association of Official Analytical Chemist. (1984),
Official Methods of Analysis. Virginia. pp. 1141. Bauwin, G. R. and Ryan, H. L. (1974), Sampling,
inspection, and grading of grain. In: Christensen, C. M. Storage of cereal grains and their products. St. Paul, Minnesota: American Association of Cereal Chemists. pp. 115-157.
Binkerd, K. A.; Scott, D. H.; Everson, R. J.; Sullivan, J. M. and Robinson, F. R. (1993), Fumonisin contamination of the 1991 Indiana corn crop and its effects in horses. Journal of Veterinary Diagnostic Investigation, 5, 653-655.
Brasil (1976), Portaria n. 845, 8 de Novembro de 1976,
Diário Oficial da República Federativa do Brasil. Brasília, 30 de Novembro de 1976.
Companhia Nacional do Abastecimento (2003),
Previsão e Acompanhamento da Safra 2002/03. Disponível em: http://www.conab.gov.br. Acesso em: 20 jun. 2003.
Coulomb Jr., R. A. (1993), Biological action of mycotoxins. Journal of Dairy Science, 76, 880-891. Figueira, E. L. Z.; Blanco-Labra, A.; Gerage, A. C.;
Ono, E. Y. S.; Mendiola-Olaya, E.; Ueno, Y. and Hirooka, E. Y. (2003), New amylase inhibitor present in corn seeds active in vitro against amylase from
Fusarium verticillioides. Plant Disease, 87, 233-240. Harrison, L. R.; Colvin, B. M.; Green, J. T.; Newman,
L. E. and Cole, J. R. (1990), Pulmonary edema and hydrothorax in swine produced by fumonisin B1, a
toxic metabolite of Fusarium moniliforme, Journal of Veterinary Diagnostic Investigation, 2, 217-221. Headrick, J. M. and Pataky, J. K. (1991), Maternal
influence on the resistance of sweet corn lines to kernel infection by Fusarium moniliforme.
Phytopathology, 81, 268-274.
Hirooka, E. Y.; Yamaguchi, M. M.; Aoyama, S.; Sugiura, Y. and Ueno, Y. (1996), The natural occurrence of fumonisins in Brazilian corn kernels.
Food Additives and Contaminants, 13, 173-183. Instituto Adolfo Lutz. (1985), Normas Analíticas do
Instituto Adolfo Lutz. 3. ed. São Paulo: IAL. 371 pp. (Métodos químicos e físicos para análise de alimentos; 1).
Kellerman, T. S.; Marasas, W. F. O.; Thiel, P. G.; Gelderblom, W. C. A.; Cawood, M. and Coetzer, J. A. W. (1990), Leukoencephalomalacia in two horses induced by oral dosing of fumonisin B,
King, S. B. and Scott, G. E. (1981), Genotypic differences in maize to kernel infection by Fusarium moniliforme. Phytopathology, 71, 1245-1247.
Marín, S.; Magan, N.; Belli, N.; Ramos, A. J.; Canela, R. and Sanchis, V. (1999), Two dimensional profiles of fumonisin B1 production by Fusarium moniliforme
and Fusarium proliferatum in relation to environmental factors and potential for modelling toxin formation in maize grain. International Journal of Food Microbiology, 51, 159-167.
Martins, J. F. (1995), Grãos ardidos e micotoxinas no milho. A granja, 563, 38-43.
Menegazzo, R.; Giacomini, V.; Trichez, M. A. and Lazzari, F. A. (2001), Amostragem e monitoramento de micotoxinas em matérias-primas para rações. In: Simpósio em armazenagem qualitativa de grãos do Mercosul, 2., Londrina. Anais… Londrina, PR: SAG-Mercosul. pp. 161-171.
Munkvold, G. P. and Desjardins, A. E. (1997), Fumonisins in maize: can we reduce their occurrence? Plant Disease, 81, 556-565.
Murphy, P. A.; Rice, L. G. and Ross, P. F. (1993), Fumonisin B1, B2, and B3 content of Iowa,
Wisconsin, and Illinois corn and corn screenings.
Journal of Agricultural and Food Chemistry, 41, 263-266.
Nelson, P. E.; Tousson, T. A. and Marasas, W. F. O. (1983), Fusarium species: an illustrated manual for identification. Pennsylvania: Pennsylvania State University Press. pp. 193.
Orsi, R. B.; Corrêa, B.; Pozzi, C. R.; Schammass, E. A.; Nogueira, J. R.; Dias, S. M. C. and Malozzi, M. A. B. (2000), Mycoflora and occurrence of fumonisins in freshly harvested and stored hybrid maize. Journal of Stored Products Research, 36, 75-87.
Pascale, M.; Visconti, A.; Pronczuk, M; Wisniewska, H. and Chelkowski, J. (1997), Accumulation of fumonisins in maize hybrids inoculated under field conditions with Fusarium moniliforme Sheldon.
Journal of the Science of Food and Agriculture,
74, 1-6.
Pitt, J. I.; Basílico, J. C.; Abarca, M. L. and López, C. (2000), Mycotoxins and toxigenic fungi. Medical Mycology, 38, 41-46.
Rheeder J. P.; Marasas, W. F. O. and Vismer, H. F. (2002), Production of fumonisin analogs by Fusarium
species, Applied and Environmental Microbiology,
68, 2101-2105.
Samson, R. A.; Hoeskstra, E. S.; Frisvad, J. C. and Filtenborg, O. (1995), Introduction to food-borne fungi. 4.ed. Centraalbureau voor Schimmelcultures, The Netherlands.
Shelby, R. A.; White, D. G. and Bauske, E. M. (1994), Differential fumonisin production in maize hybrids.
Plant Disease, 78, 582-584.
Shephard, G. S.; Sydenham, E. W.; Thiel, P. G. and Gelderblom, W. C. A. (1990), Quantitative determination of fumonisins B1 and B2 by
high-performance liquid chromatography with fluorescence detection. Journal of Liquid Chromatography,13, 2077-2087.
Singh, K.; Frisvad, J. C.; Thrane, U. and Mathur, S. B. (1991), An illustrated manual on identification of some seed-borne Aspergilli, Fusaria, Penicillia and their mycotoxins, Danish Government, Hellerup, Denmark
Thiel, P. G.; Marasas, W. F. O.; Sydenham, E. W.; Shephard, G. S. and Gelderblom, W. C. A. (1992), The implications of naturally occurring levels of fumonisins in corn for human and animal health.
Mycopathologia, 117, 3-9.
Ueno, Y. (2000), Risk of multi-exposure to natural toxins. Mycotoxins, 50, 13-22.
Ueno, Y.; Aoyama, S.; Sugiura, Y.; Wang, D. S.; Lee, U. S.; Hirooka, E.Y.; Hara, S.; Karki, T.; Chen G. and Yu, S. Z. (1993), A limited survey of fumonisins in corn and corn-based products in Asian countries.
Mycotoxin Research, 9, 27-34.
Watson, S. A. (1987), Measurement and maintenance of quality. In: Watson, S. A. and Ramstad, P. E.
Corn: Chemistry and Technology. Minnesota: American Association of Cereal Chemists. pp.125-183.