Lower limb ice application alters ground reaction
force during gait initiation
Thiago B. Muniz1, Renato Moraes2,4, Rinaldo R. J. Guirro3,4
ABSTRACT | Background: Cryotherapy is a widely used technique in physical therapy clinics and sports. However, the effects of cryotherapy on dynamic neuromuscular control are incompletely explained. Objectives: To evaluate the effects of cryotherapy applied to the calf, ankle and sole of the foot in healthy young adults on ground reaction forces during gait initiation. Method: This study evaluated the gait initiation forces, maximum propulsion, braking forces and impulses of 21 women volunteers through a force platform, which provided maximum and minimum ground reaction force values. To assess the effects of cooling, the task - gait initiation - was performed before ice application, immediately after and 30 minutes after removal of the ice pack. Ice was randomly applied on separate days to the calf, ankle and sole of the foot of the participants. Results: It was demonstrated that ice application for 30 minutes to the sole of the foot
and calf resulted in signiicant changes in the vertical force variables, which returned to their pre-application values
30 minutes after the removal of the ice pack. Ice application to the ankle only reduced propulsion impulse. Conclusions: These results suggest that although caution is necessary when performing activities that require good gait control, the application of ice to the ankle, sole of the foot or calf in 30-minute intervals may be safe even preceding such activities.
Keywords: physical therapy; gait; neuromuscular control; force platform; cryotherapy. Clinical Trials Identiier: NCT02089022
HOW TO CITE THIS ARTICLE
Muniz TB, Moraes R, Guirro RRJ. Lower limb ice application alters ground reaction force during gait initiation. Braz J Phys Ther. 2015 Mar-Apr; 19(2):114-121. http://dx.doi.org/10.1590/bjpt-rbf.2014.0080
1Centro de Reabilitação, Hospital das Clínicas, Faculdade de Medicina de Ribeirão Preto (FMRP), Universidade de São Paulo (USP), Ribeirão Preto,
SP, Brazil
2Escola de Educação Física e Esporte de Ribeirão Preto, USP, Ribeirão Preto, SP, Brazil
3Departamento de Biomecânica, Medicina e Reabilitação do Aparelho Locomotor, FMRP, USP, Ribeirão Preto, SP, Brazil 4Programa de Pós-graduação em Reabilitação e Desempenho Funcional, FMRP, USP, Ribeirão Preto, SP, Brazil
Received: May. 20, 2014 Revised: Sept. 03, 2014 Accepted: Oct. 27, 2014
Introduction
Although cryotherapy is widely used in clinical practice, its associated physiological responses have not been fully explained1. In addition to reducing
pain, cryotherapy has been reported to promote other changes2, such as reduced nerve conduction velocity3,4,
inhibition of nociceptors and muscle spasm reduction5.
Uchio et al.6 noted a concern with resuming exercise
after cryotherapy. For example, Ribeiro et al.7 noted
that the application of ice for 30 minutes to the knee joint reduced joint position sense. Hopper et al.8 also
observed a reduction in ankle joint position sense after 15 minutes of ice application to this joint.
The maintenance of balance involves several integrated body systems, including the musculoskeletal and proprioceptive systems as well as other sensory systems (e.g., vision and vestibular) and central integration processes9. Previous studies on joint
position sense have indicated that proprioception, which includes information from muscle, skin and joint
receptors10, is particularly affected by cryotherapy8.
Thus, cryotherapy may compromise the sensorimotor system by changing the response of these receptors11.
Because the sensorimotor system is essential for joint stability and protection, any intervention that impairs its proper functioning may predispose an individual to injury.
Therefore, the present study evaluated the ground reaction force (GRF) during a dynamic task, gait initiation, following ice application to different structures – sole of the foot, ankle and triceps surae (commonly known as the calf muscles). These three regions were chosen for their predominance of skin, joint and muscle receptors, respectively, which might
differentially inluence gait initiation following
cryotherapy. In addition, it is known that the ankle and calf are commonly injured during sports practice12,13 and
of the gait cycle14. Therefore, an assessment of the
effects of ice on these three regions is of considerable clinical relevance.
Method
Sample
In total, 21 young adult female university students
were randomly recruited from the Faculdade de
Medicina de Ribeirão Preto, Universidade de São Paulo (FMRP-USP), Ribeirão Preto, state of São Paulo - SP, Brazil. Women were recruited because the lack of gender differences in the effects of ice application15 has been established in the literature and
due to ease of recruiting. To be included in the study, the volunteer participants were required to be healthy and sedentary, have no history of lower limb sensory nerve damage, musculoskeletal injury, trauma or skin lesions, and not be in the week preceding a menstrual period or to be menstruating due to the sensory changes associated with this period16. This project was approved
by the Research Ethics Committee of the FMRP-USP (protocol no. 635/2009), and all participants signed an informed consent form.
Instruments
An OR 6-7-1000 force plate (AMTI, Watertown, MA, USA) with a sampling frequency of 100 Hz was used to record the forces applied to the ground. An ST-600 infrared digital thermometer with laser sight (Incoterm®, Porto Alegre, State of Rio Grande do Sul - RS, Brazil) with a temperature reading range from –60 to 500 °C, precision of ± 2% and resolution of 0.1 °C was used to measure the skin temperature of the evaluated regions. To standardize the pressure exerted during ice application, a sphygmomanometer was used (BD®, Juiz de Fora, State of Minas Gerais - MG, Brazil) with the cuff positioned between the ice pack and strap at a constant pressure of 30 mmHg17.
An EGE-300M ice machine (Everest®, Rio de Janeiro, State of Rio de Janeiro - RJ, Brazil) with a production capacity of 300 kg of ice per day and 100 kg storage capacity at a temperature of 0.5°C was utilized to produce and store the ice.
Procedures
Following a standard physical examination, the order of ice application sites for the volunteers was randomly drawn by lot. Each subject underwent ice application to the three regions on three different days with a minimum interval of 48 hours between
applications, and each ice application session lasted 30 minutes18.
Each day, ice was applied to the non-dominant limb, to one of the three target areas (i.e., sole, ankle or calf), at pre-scheduled morning appointments, and data was collected in a climate-controlled room (23 °C±2 °C). The data were collected before ice application (Pre), immediately after the ice was removed (T0) and 30 minutes after the ice was removed (T30).
The ice was applied using a plastic bag containing 1.5 kg of crushed ice in direct contact with the skin of the subject. To apply the ice, the subjects were seated15 with their knees and hips positioned at
90°. Before each assessment (Pre, T0 or T30), skin temperature was recorded using the infrared digital thermometer with laser sight, which was positioned perpendicular to the segment, 15 cm away from the skin. Multiple measurements were taken from different segment positions to improve estimates of the actual temperature. The following locations were measured: three plantar points (i.e. center of the forefoot, midfoot and hindfoot); four ankle points (i.e. center of each malleoli and anterior and posterior middle points of the segment between them); and three calf points (i.e. center of the proximal, middle and distal third). The mean temperatures of the different points measured for each segment were used.
The task evaluated in this study was gait initiation. For this purpose, the volunteers remained in the initial position (i.e. an upright, quiet position with feet parallel and spaced shoulder width apart) and were instructed
to perform the irst step with the non-dominant limb
on the force plate. Dominance was assessed through the task of kicking a ball. The data collected for this part of the study refers to the initial step performed unilaterally with the non-dominant limb. To perform
the step, the force plate was ixed between two wooden
platforms of the same height and width at the same level. The volunteers were instructed to perform the step and walk as naturally as possible; therefore, the speed was not standardized. After the tests, subjects remained seated with the heel resting on a wooden surface to prevent heat exchange.
Data analysis
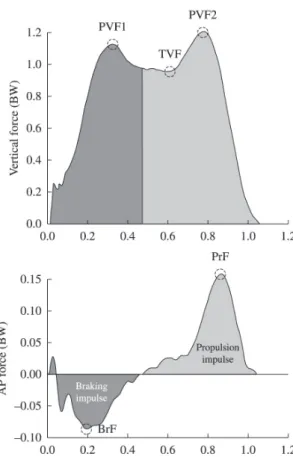
the ground (PVF1), peak value before lifting the foot from the ground (PVF2) and valley value between peaks 1 and 2 (TVF). In the anteroposterior direction (AP), the maximum braking force (BrF) and maximum propulsive force (PrF) were calculated. In addition to these variables, the braking and propulsive impulses in the vertical and AP directions were calculated19. The
force curve in the AP direction was used to identify the transition between braking and propulsion as the instant the curve crossed the zero axis (Figure 1). The braking impulse was calculated as the area under the force-time curve from foot contact with the platform
(Fv≥5 N) until the moment that the curve crossed the
zero axis, and the propulsive impulse was calculated from that moment until the foot was lifted from the
force plate (Fv≤5 N).
Based on the GRF, the durations of the following gait phases were also calculated: stance phase (SD), braking phase (BD) and propulsion phase (PD). The SD was calculated as the interval between contact and removal of the foot from the force plate. The BD was calculated as the interval between contact of the foot with the force plate and the instant that the Fap crossed the zero axis. The PD was measured as the interval between the instant that the Fap crossed the zero axis and removal of the foot from the ground.
Statistical analysis
After tabulating the results, a Shapiro-Wilk normality test was applied to all variables. For variables with normal distributions, an ANOVA test for repeated measures and Tukey’s test were applied. For data that were not normally distributed, a Kruskal-Wallis test and Dunn’s test were utilized. The data were processed using SPSS 20.0 software (IBM, Armonk,
New York, USA) and signiicance was set at a level
of 5% (p<0.05).
Power was calculated by considering the vertical force with ice applied to the calf, and 95% power for T0 and 77% for T30 were obtained.
Results
Characteristics of the sample
The participants had the following characteristics: age of 21.7±1.9 years, body mass of 57.9±7.1 kg, height of 1.65±0.07 m and body mass index (BMI) of 21.4±2.1 kg/m2.
Temperature
A signiicant reduction in skin temperature was
observed immediately following ice pack removal (T0) to the three target areas (Table 1). Temperatures remained below their pre-application values after 30 minutes, although they had increased since T0.
Figure 1. Force-time curves for the vertical (top) and anterior-posterior (AP, bottom) directions. Dark shaded areas correspond
to the braking impulse; light shaded areas illustrate the propulsive
impulse. PVF1: irst peak of the force in the vertical direction;
PVF2: second peak of the force in the vertical direction; TVF: valley of the force in the vertical direction; BrF: braking force in
the AP direction; PrF: propulsion force in the AP direction; BW:
body weight.
Table 1. Mean values and standard deviations (±) of skin temperature for ice application sites (foot sole, ankle and calf) before (Pre), immediately after (T0) and 30 minutes after application (T30). n=21.
Site of ice application
Measurement Time
Pre T0 T30
Foot Sole (°C) 27.57±1.5 7.84±1.74* 21.94±1.84*#
Ankle (°C) 29.36±1.05 10.69±2.45* 21.53±1.29*#
Calf (°C) 29.34±2.14 9.03±3.2* 25.11±1.44*#
Duration of the gait phases
Ice application did not affect the durations of the gait phases (Table 2). Overall, the duration of the stance phase was approximately one second, and participants spent more time braking than accelerating their bodies.
Maximum and minimum GRF values
The application of ice to the sole and calf increased PVF1 immediately following application (Table 3). The same trend was observed for TVF. In addition, the values of these two variables were similar for Pre
and T30 but decreased signiicantly between T0 and
Table 2. Mean values and standard deviations (±) of support (SD), braking (BD) and propulsion (PD) durations (in seconds [s]) for the ice application sites (sole, ankle and calf) before application of ice (Pre), immediately after application of ice (T0) and 30 minutes after removal of ice (T30). n=21.
Site of ice application Measurement Period
Pre T0 T30
SD – Foot Sole (s) 1.018±0.109 1.035±0.109 1.041±0.108
SD – Ankle (s) 1.028±0.086 1.033±0.083 1.029±0.094
SD – Calf (s) 1.190±0.109 1.041±0.093 1.214±0.108
BD – Foot Sole (s) 0.560±0.131 0.587±0.083 0.593±0.094
BD – Ankle (s) 0.572±0.086 0.578±0.093 0.575±0.073
BD – Calf (s) 0.589±0.085 0.581±0.083 0.574±0.106
PD – Foot Sole (s) 0.459±0.111 0.448±0.080 0.448±0.086
PD – Ankle (s) 0.457±0.088 0.447±0.099 0.455±0.086
PD – Calf (s) 0.435±0.070 0.460±0.088 0.472±0.099
Table 3. Mean values and standard deviations (±) of the vertical and anterior-posterior (AP) components of Ground Reaction Force for the ice application sites before application of ice (Pre), immediately after application of ice (T0), and 30 minutes after removal of ice (T30).
Measurement Period
Pre T0 T30
Vertical Component of GRF
PVF1 – Foot Sole (BW) 1.020±0.042 1.035±0.049* 1.022±0.039
PVF1 – Ankle (BW) 1.024±0.047 1.027±0.042 1.024±0.046
PVF1 – Calf (BW) 1.020±0.045 1.030±0.045* 1.017±0.039#
TVF – Foot Sole (BW) 0.890±0.024 0.907±0.031* 0.890±0.026#
TVF – Ankle (BW) 0.892±0.027 0.900±0.030 0.887±0.026#
TVF – Calf (BW) 0.888±0.025 0.901±0.024* 0.886±0.024#
PVF2 – Foot Sole (BW) 1.050±0.037 1.034±0.054 1.036±0.037
PVF2 – Ankle (BW) 1.050±0.037 1.045±0.034 1.035±0.035*#
PVF2 – Calf (BW) 1.046±0.035 1.042±0.044 1.026±0.040*#
Anteroposterior Component of GRF
BrF – Foot Sole (BW) –0.083±0.027 –0.083±0.023 –0.088±0.025*
BrF – Ankle (BW) –0.084±0.018 –0.091±0.030 –0.091±0.022*
BrF – Calf (BW) –0.085±0.021 –0.084±0.021 –0.089±0.024
PrF – Foot Sole (BW) 0.117±0.027 0.110±0.026 0.107±0.024
PrF – Ankle (BW) 0.114±0.030 0.114±0.026 0.104±0.027*#
PrF – Calf (BW) 0.117±0.025 0.111±0.026 0.108±0.025*
T30 for TVF for all sites and for PVF1 in the calf. For PVF2, there was a decrease in the values of these variables from Pre and T0 to T30 when the ice was applied to the ankle and calf. In the AP direction, BrF increased at T30 when compared to Pre with the application of ice to the ankle and sole of the foot. Conversely, PrF decreased at T30 compared to Pre with the application of ice to the ankle and calf. In addition, PrF decreased at T30 compared to T0 when ice was applied to the ankle.
Impulses
The application of ice to the ankle reduced the propulsive impulse in the AP direction at T30 compared to Pre and T0 (Figure 2).
Discussion
Although skin temperature poorly predicts intramuscular temperature20, this parameter was chosen
as a noninvasive method that is strongly correlated with
nerve conduction velocity21, an extremely important
variable for sensorimotor control. Thus, the results indicate that even 30 minutes after ice was removed, skin temperatures had not returned to baseline values. These data are consistent with previous research, which indicate that the skin temperatures of the target regions remained below pre-application values even after 60 minutes22,23.
An important result of this study was the observed increase in PVF1 immediately following ice application (T0) to the sole of the foot and calf. This result suggests increased overload on the musculoskeletal system immediately after foot contact with the ground. This overload can be partly explained by the fact that decreased temperatures affect neuromuscular system functioning, and both afferent and efferent nerve impulses might have slowed after cooling24.
Similarly, cooling the sole of the foot with ice has been previously described as responsible for increased weight transfer rates following foot contact with the ground at the end of the gait cycle25. Sensorimotor
Figure 2. Means and standard deviations for braking (left side) and propulsive (right side) impulses in both anterior-posterior (AP, top)
and vertical (bottom) directions for all ice application sites at three measurement times (Pre – prior to application of ice, T0 – immediately
alterations caused by the application of ice might result from increased depolarization thresholds of plantar receptors15 as well as decreased iring rates of these
receptors26. These changes tend to reduce afferent
impulses to the central nervous system resulting in reduced limb control during the gait stance phase. Additionally, the decrease in calf temperature decreases the efferent impulses of this muscle and increases muscle rigidity27. According to Mustalampi et al.28, the
application of ice to the quadriceps muscle temporarily increased rigidity and tension of the muscle as well as reducing its elasticity. Therefore, we suggest that the same pattern occurs in calf muscles, which generated lower impact absorption values when the hindfoot made contact with the force plate. Thus, both the reduction of afferent impulses to plantar and calf mechanoreceptors and increased rigidity of calf muscles might explain increased PVF1.
However, 30 minutes after the ice was removed from the sole of the foot and calf, PVF1 values returned to baseline levels despite that temperatures remained below pre-application levels. This result can be explained by the fact that decreased afferent impulses following cooling are quickly compensated by the central nervous system28. According to Billot et al.29,
the central nervous system redistributes balance maintenance tasks to other sensory structures, which
compensates for the deicit in afferent impulses from
plantar mechanoreceptors.
The results indicate a reduction of the PVF2 peak after 30 minutes of ice application to the ankle and calf. This result suggests that even with reduced skin temperatures, the adaptations in the central nervous system allowed learning of the gait initiation task. The same pattern was not observed when ice was applied to the sole of the foot, which suggests the inability of the central nervous system to learn the required task due to the sensory losses caused by decreased afferent impulses from the plantar mechanoreceptors.
No changes in the variables studied were observed at time T0 following ice application to the ankle suggests that sensory information from this joint was not affected by reduced skin temperature. Although Hopper et al.8 observed a reduction in joint proprioception
after reducing ankle temperatures, their results did
not produce signiicant clinical values. The authors
observed an angular change of only 0.5° immediately after ice removal. In addition, other studies have not observed changes in ankle joint proprioception after ice application30,31.
The reduction of ankle temperature might not change the GRF at T0 due to compensation from afferent impulses from mechanoreceptors of other regions. This hypothesis has been supported by observations that reduction of shoulder temperature does not change joint position sense32. These authors
argue that sensory information from other peripheral
areas might compensate for the afferent impulse deicit
caused by applying ice to the joint. In addition, the
application of ice might have been insuficient to
reduce the temperature of deep joint mechanoreceptors and induce changes in GRF33.
At time T30, however, the application of ice to different body regions affected propulsion and braking values in the AP direction (BrF and PrF) and propulsive impulses. However, we can attribute these changes to learning because they were only observed during the last repetition (T30) when the temperature, although inferior to pre-application levels, does not
seem to directly inluence the functioning of the
sensorimotor system.
Regarding the limitations of this study, the fact that direct measurements of the proprioceptive system were not performed, the absence of measurement of other variables and the assessment of other tasks do not allow conclusive statements about the effects of ice application on the proprioceptive system. However, the changes observed in this study and in the extant literature allow us to state that in the situations
previously described, ice application was suficient
to cause sensorimotor changes during the gait stance phase. Although the task chosen – gait initiation – might limit the application of these results to other activities that require greater neuromuscular control (e.g. jumps, spins, acceleration and deceleration), in rehabilitation, one of the most important tasks is the reestablishment of natural gait. Thus, clarifying whether ice application, which is commonly used in clinical practice for ankle and calf injuries, can change gait is of considerable importance in rehabilitation settings.
Conclusion
30-minute interval after ice has been removed can be safe, even when preceding such activities.
Acknowledgements
The authors would like to thank the Rehabilitation Center of the Clinics Hospital of FMRP/USP for providing physical space; the Conselho Nacional de Pesquisa e Desenvolvimento (CNPq), Brazil (processes
475520/2008-4 and 479616/2012-4) and the Fundação de Amparo à Pesquisa do Estado de São Paulo (FAPESP), Brazil (process 2010/09341-7) for inancial support.
References
1. Bleakley CM, O’Connor S, Tully MA, Rocke LG, Macauley DC, McDonough SM. The PRICE study (Protection Rest Ice Compression Elevation): design of a randomised controlled trial comparing standard versus cryokinetic ice applications in the management of acute ankle sprain [ISRCTN13903946]. BMC Musculoskelet Disord. 2007;8:125. PMid:18093299.
2. Bleakley CM, Costello JT, Glasgow PD. Should athletes return to sport after applying ice? A systematic review of the effect of local cooling on functional performance. Sports Med. 2012;42(1):69-87. PMid:22121908.
3. Algafly AA, George KP. The effect of cryotherapy on nerve conduction velocity, pain threshold and pain tolerance. Br J Sports Med. 2007;41(6):365-369. PMid:17224445. 4. Herrera E, Sandoval MC, Camargo DM, Salvini TF. Effect of
walking and resting after three cryotherapy modalities on the recovery of sensory and motor nerve conduction velocity in healthy subjects. Rev Bras Fisioter. 2011;15(3):233-40. http://dx.doi.org/10.1590/S1413-35552011000300010. PMid:21829988.
5. Saeki Y. Effect of local application of cold or heat for relief of pricking pain. Nurs Health Sci. 2002;4(3):97-105. PMid:12153407.
6. Uchio Y, Ochi M, Fujihara A, Adachi N, Iwasa J, Sakai Y. Cryotherapy influences joint laxity and position sense of the healthy knee joint. Arch Phys Med Rehabil. 2003;84(1):131-5. PMid:12589634.
7. Ribeiro F, Moreira S, Neto J, Oliveira J. Is the deleterious effect of cryotherapy on proprioception mitigated by exercise? Int J Sports Med. 2013;34(5):444-8. PMid:23041968. 8. Hopper D, Whittington D, Davies J. Does ice immersion
influence ankle joint position sense? Physiother Res Int. 1997;2(4):223-36. PMid:9408933.
9. Sturnieks DL, St George R, Lord SR. Balance disorders in the elderly. Neurophysiol Clin. 2008;38(6):467-78. PMid:19026966.
10. Hogervorst T, Brand RA. Mechanoreceptors in joint function. J Bone Joint Surg Am. 1998;80(9):1365-78. PMid:9759824. 11. Muise SB, Lam CK, Bent LR. Reduced input from foot sole
skin through cooling differentially modulates the short latency and medium latency vestibular reflex responses to galvanic
vestibular stimulation. Exp Brain Res. 2012;218(1):63-71. PMid:22278107.
12. Bryan Dixon J. Gastrocnemius vs. soleus strain: how to differentiate and deal with calf muscle injuries. Curr Rev Musculoskelet Med. 2009;2(2):74-7. PMid:19468870. 13. Lin CWC, Hiller CE, de Bie RA. Evidence-based treatment
for ankle injuries: a clinical perspective. J Man Manip Ther. 2010;18(1):22-8. PMid:21655420.
14. Van Deursen RWM, Cavanagh PR, van Ingen Schenau GJ, Becker MB, Ulbrecht JS. The role of cutaneous information in a contact control task of the legs in humans. Hum Mov Sci. 1998;17:95-120.
15. Schlee G, Sterzing T, Milani TL. Foot sole skin temperature affects plantar foot sensitivity. Clin Neurophysiol. 2009;120(8):1548-51. PMid:19616994.
16. Barbosa MB, Montebelo MIL, Guirro EC. Determination of sensory perception and motor response thresholds in different phases of the menstrual cycle. Rev Bras Fisioter. 2007;11(6):443-9. http://dx.doi.org/10.1590/ S1413-35552007000600005.
17. Janwantanakul P. Cold pack/skin interface temperature during ice treatment with various levels of compression. Physiotherapy. 2006;92(4):254-9.
18. Oliveira NML, Rainero EP, Salvini TF. Three intermittent sessions of cryotherapy reduce the secondary muscle injury in skeletal muscle of rat. J Sports Sci Med. 2006;5(2):228-34. PMid:24259995.
19. Moraes R, Allard F, Patla AE. Validating determinants for an alternate foot placement selection algorithm during human locomotion in cluttered terrain. J Neurophysiol. 2007;98(4):1928-40. PMid:17686917.
20. Jutte LS, Merrick MA, Ingersoll CD, Edwards JE. The relationship between intramuscular temperature, skin temperature, and adipose thickness during cryotherapy and rewarming. Arch Phys Med Rehabil. 2001;82(6):845-50. PMid:11387593.
21. Halar EM, DeLisa JA, Brozovich FV. Nerve conduction velocity: relationship of skin, subcutaneous and intramuscular temperatures. Arch Phys Med Rehabil. 1980;61(5):199-203. PMid:7377938.
22. Yanagisawa O, Homma T, Okuwaki T, Shimao D, Takahashi H. Effects of cooling on human skin and skeletal muscle. Eur J Appl Physiol. 2007;100(6):737-45. PMid:17479279. 23. Tomchuk D, Rubley MD, Holcomb WR, Guadagnoli M, Tarno
JM. The magnitude of tissue cooling during cryotherapy with varied types of compression. J Athl Train. 2010;45(3):230-7. PMid:20446835.
24. Rutkove SB. Effects of temperature on neuromuscular electrophysiology. Muscle Nerve. 2001;24(7):867-82. PMid:11410914.
25. Perry SD, Santos LC, Patla AE. Contribution of vision and cutaneous sensation to the control of centre of mass (COM) during gait termination. Brain Res. 2001;913(1):27-34. PMid:11532244.
27. Muraoka T, Omuro K, Wakahara T, Muramatsu T, Kanehisa H, Fukunaga T, et al. Effects of muscle cooling on the stiffness of the human gastrocnemius muscle in vivo. Cells Tissues Organs. 2008;187(2):152-60. PMid:17938563. 28. Mustalampi S, Ylinen J, Kautiainen H, Weir A, Häkkinen
A. Acute effects of cold pack on mechanical properties of the quadriceps muscle in healthy subjects. Phys Ther Sport. 2012;13(4):265-9. PMid:23068904.
29. Billot M, Handrigan GA, Simoneau M, Corbeil P, Teasdale N. Short term alteration of balance control after a reduction of plantar mechanoreceptor sensation through cooling. Neurosci Lett. 2013;535:40-4. PMid:23305721.
30. LaRiviere J, Osternig LR. The effect of ice immersion on joint position sense. J Sport Rehabil. 1994;3:58-67. 31. Khanmohammadi R, Someh M, Ghafarinejad F. The effect
of cryotherapy on the normal ankle joint position sense. Asian J Sports Med. 2011;2(2):91-8. PMid:22375224.
32. Dover G, Powers ME. Cryotherapy does not impair shoulder joint position sense. Arch Phys Med Rehabil. 2004;85(8):1241-6. PMid:15295747.
33. Wassinger CA, Myers JB, Gatti JM, Conley KM, Lephart SM. Proprioception and throwing accuracy in the dominant shoulder after cryotherapy. J Athl Train. 2007;42(1):84-9. PMid:17597948.
Correspondence
Rinaldo Roberto de Jesus Guirro
Faculdade de Medicina de Ribeirão Preto, USP Curso de Fisioterapia
Avenida Bandeirantes, 3900
![Table 2. Mean values and standard deviations (±) of support (SD), braking (BD) and propulsion (PD) durations (in seconds [s]) for the ice application sites (sole, ankle and calf) before application of ice (Pre), immediately after application of ice (T0) a](https://thumb-eu.123doks.com/thumbv2/123dok_br/19016400.469537/4.765.81.677.285.519/standard-deviations-propulsion-durations-application-application-immediately-application.webp)

