Cardiovascular coupling during graded postural
challenge: comparison between linear tools and joint
symbolic analysis
Alberto Porta1,2, Anielle C. M. Takahashi3, Aparecida M. Catai3
ABSTRACT | Background: A joint symbolic analysis (JSA) is applied to assess the strength of the cardiovascular coupling from spontaneous beat-to-beat variability of the heart period (HP) and the systolic arterial pressure (SAP) during an
experimental protocol inducing a gradual barorelex unloading evoked by postural change (i.e. graded head-up tilt).
Method: The adopted JSA can quantify the degree of association between the HP and SAP variabilities as a function
of the time scale of the HP and SAP patterns. Traditional linear tools assessing the HP-SAP coupling strength, such as squared correlation coeficient, squared coherence function, and percentage of barorelex sequences, were computed as well for comparison. Results: We found that: i) JSA indicated that the strength of the cardiovascular coupling at
slow temporal scales gradually increased with the magnitude of the orthostatic challenge, while that at fast temporal scales gradually decreased; ii) the squared correlation coeficient and percentage of barorelex sequences did not detect
this behavior; iii) even though squared coherence function could measure the magnitude of the HP-SAP coupling as a
function of the time scale, it was less powerful than JSA owing to the larger dispersion of the frequency domain indexes.
Conclusion: Due to its peculiar features and high statistical power, JSA deserves applications to pathological groups
in which the link between HP and SAP variabilities is lost or decreased due to the overall depression or impairment of the cardiovascular control.
Keywords: nonlinear dynamics; head-up tilt; heart rate variability; arterial pressure variability; cardiovascular control;
autonomic nervous system.
BULLET POINTS
• Joint symbolic analysis (JSA) was applied to assess the strength of the cardiovascular coupling during graded
orthostatic challenge from spontaneous heart period and arterial pressure variabilities.
• JSA indicated that the strength of the cardiovascular coupling at slow temporal scales gradually increased with the
magnitude of the orthostatic challenge, while that at fast temporal scales gradually decreased.
• Since JSA was found superior compared to its linear counterparts, it deserves to be tested in pathological populations likely to exhibit relevant nonlinear interactions between heart period and arterial pressure variabilities.
HOW TO CITE THIS ARTICLE
Porta A, Takahashi ACM, Catai AM. Cardiovascular coupling during graded postural challenge: comparison between linear tools and joint symbolic analysis. Braz J Phys Ther. 2016 Sept-Oct; 20(5):461-470. http://dx.doi.org/10.1590/bjpt-rbf.2014.0179
1 Department of Biomedical Sciences for Health, University of Milan, Milan, Italy
2 Department of Cardiothoracic, Vascular Anesthesia and Intensive Care, IRCCS Policlinico San Donato, San Donato, Milan, Italy 3 Departmento de Fisioterapia, Universidade Federal de São Carlos (UFSCar), São Carlos, SP, Brazil
Received: Nov. 10, 2015 Revised: Jan. 27, 2016 Accepted: Feb. 15, 2016
Introduction
Symbolic analysis (SA) is a prominent approach
utilized in many ields of science to tackle the
complexity of the behavior of a dynamical system and describe the interactions among its subparts1. SA is
based on a coarse graining procedure symbolizing
the time course of one (or more) of the variables
describing the behavior of the dynamical system. The symbolization procedure creates an alphabet of
states that are visited during the functioning of the
system. Speciic temporal sequences of the various states, associated to particular conditions of the system,
are searched and their rate of presence (or absence) is
taken as an indication of the likelihood of the system being in the considered condition, thus classifying and labeling speciic system behaviors.
In the ield of cardiovascular control analysis,
462 Braz J Phys Ther. 2016 Sept-Oct; 20(5):461-470
approach to identify different states of the autonomic nervous system and quantify its impairment due to pathology2-12. The univariate SA has been extended to become joint SA (JSA) with the aim of assessing the interactions between two series such as HP and systolic arterial pressure (SAP) variabilities13-17, HP variability and respiration17-19, and HP and ventricular
repolarization duration variabilities20,21. Higher levels
of integration of neural relexes can be studied when
JSA is gated according to a periodical input such as the respiratory activity15.
While the ability of the univariate SA compared to
linear methods, such as time and frequency domain analyses, has been demonstrated4-6,8,10,11, the power
of JSA in assessing HP-SAP variability interactions
compared to its linear counterparts, such as squared correlation coeficient, squared coherence function, and percentage of barorelex sequences, is not fully clariied. This capability has been recently suggested by the fact that JSA was found to be helpful in ranking
anesthesia procedures according to their ability to
preserve cardiovascular control, while the squared
coherence function was unable to provide a suitable
classiication16.
The aim of this study was to assess the HP-SAP coupling during graded head-up tilt via JSA together with linear time and frequency domain tools such as
squared correlation coeficient, squared coherence function, and percentage of barorelex sequences. The orthostatic challenge induced modiications of
the degree of the HP-SAP association in relation
to the magnitude of the challenge (i.e. the tilt table
inclination)22, thus allowing the comparison of the
ability of the methods to track changes in the strength of the cardiovascular coupling.
Method
Experimental protocol and data analysis
Experimental protocol
A set of recordings collected during an experimental protocol planned to study the effect of a graded
postural challenge on the cardiac barorelex control22
were used. Briely, 19 healthy humans aged from 21 to 48 years (median age=30 years, 8 males) were studied. All subjects had neither history nor clinical evidence of any disease. They had not taken any medication. They refrained from consuming any
caffeine or alcohol-containing beverages in the
24 hours before the recordings. Habitual drinkers, smokers and subjects with body mass index larger
than 30 kg/m2 were excluded from this study. Women
under hormone therapy or contraceptive therapy were
excluded as well. All experiments were performed in the morning. The subjects lay on the tilt table
supported by two belts at the level of thighs and waist respectively and with both feet touching the footrest of
the tilt table. During the entire protocol, the subjects
breathed spontaneously but they were not allowed
to talk. The study was performed according to the Declaration of Helsinki and it was approved by the Human Research Ethics Committee of the “L. Sacco” Hospital and Department of Biomedical and Clinical Sciences, University of Milan, Milan, Italy (approval number 110-09)22. A written informed consent was
obtained from all subjects.
ECG (lead II) and continuous plethysmographic arterial pressure (Finometer MIDI, Finapres Medical Systems, The Netherlands) were recorded. Signals were sampled at 300 Hz. The arterial pressure was measured from the middle inger of the left hand, being maintained at the level of heart by ixing the subject’s arm to his/her thorax during the upright position. All experimental sessions of the protocol included three periods in the same order: 1) 7 minutes at REST; 2) 10 minutes during passive head-up tilt (T); 3) 8 minutes of recovery. The inclination of
the tilt table was randomly chosen within the set
{15°,30°,45°,60°,75°,90°} (T15, T30, T45, T60, T75, T90). Each subject underwent one recording
with each tilt table inclination and completed the sequence of tilt table angles without experiencing
any sign of pre-syncope. The arterial pressure signal
was cross-calibrated in each session using a measure provided by a sphygmomanometer at the onset of
REST. The auto-calibration procedure of the arterial pressure device was switched off after the irst automatic calibration at the onset of the session. Beat-to-beat series extraction was performed after about 2 minutes from the start of each period.
Extraction of the beat-to-beat variability series
After detecting all R-waves on the ECG and locating their peak using parabolic interpolation, HP
was approximated as the temporal distance between
two consecutive parabolic apexes. The maximum
of arterial pressure inside of the i-th HP [ HP(i)], was taken as the i-th SAP, SAP(i). HP(i) and SAP(i)
After extracting the series HP = {HP(i), i=1,…,N} and SAP = {SAP(i), i=1,…,N}, where i is the progressive cardiac beat counter and N is the total cardiac beat
number, N=256 consecutive, synchronous, HP and SAP measures were chosen inside the REST and T periods, thus focusing short-term cardiovascular
regulatory mechanisms23. The stationarity of the selected HP and SAP sequences was tested according
to Magagnin et al.24 over the original series after
linear detrending. If the tests for the steadiness of the mean and variance were not fulilled, a new random selection was carried out again until the fulillment of the restricted weak stationarity test24.
HP-SAP correlation analysis
The squared correlation coeficient of the linear
regression in the plane (SAP(i),HP(i)) was taken as a
measure of the degree of the linear coupling between
the HP and SAP series in the time domain. This index,
indicated as r2 in the following, ranges from 0 to 1, where 0 indicates perfect uncorrelation between the HP and SAP, while 1 indicates full association.
HP-SAP squared coherence analysis
In the frequency domain, the degree of the linear
coupling between the HP and SAP series as a function of the frequency (f) was assessed through the squared coherence function [K2(f)], deined as the ratio between the square HP-SAP cross-spectrum modulus divided by the product of the HP and SAP power
spectra. K2(f) ranges from 0 to 1, where 0 indicates
perfect uncorrelation between HP and SAP, while 1 indicates full association. In the calculation of
K2(f), the cross-spectrum and power spectra were estimated according to the bivariate autoregressive
model the coeficients of which were identiied via a
traditional least squares technique25. The model order
was ixed at 10. K2(f) was sampled in correspondence
of the weighted average of the central frequencies of the components found in the SAP series in the low
frequency (LF, from 0.04 to 0.15 Hz, 0.15 Hz was included) and high frequency (HF, from 0.15 to 0.4 Hz, 0.15 Hz was excluded) bands, where the weights
were the powers of the components estimated from
the auto-spectra. The two indexes were referred to as
K2(LF) and K2(HF) in the following.
Detection of HP-SAP baroreflex sequences
In the time domain, the strength of the linear
HP-SAP coupling can be assessed by evaluating the
percentage of barorelex sequences26. A barorelex
sequence is deined as a sequence characterized
by the contemporaneous increase or decrease of
HP and SAP. The length of the sequences was four cardiac beats (i.e. three HPs). The lag between HP and SAP values, was set to 0 to pick up the fast vagal arm of the barorelex27. When plotted in the plane
(SAP(i),HP(i)), HP and SAP values belonging to a barorelex sequence lay on a straight line, thus allowing a linear regression analysis. The slope of the regression line was calculated and averaged over all barorelex sequences. This average was utilized as an estimate of the barorelex sensitivity (BRS) and expressed in ms/mmHg26. A barorelex sequence was considered
to be meaningful if the total HP variation was larger
than 5 ms, the total SAP variation was larger than 1 mmHg, and the correlation coeficient in the plane
(SAP(i),HP(i)) was larger than 0.85. The percentage of barorelex sequences [BRS%], was computed as the ratio of the number of barorelex sequences to the
total number of patterns of the same length multiplied
by 100. BRS% ranged from 0 to 100, where 0 indicated perfect HP-SAP uncoupling along the barorelex pathway, while 100 indicated full association.
HP-SAP JSA
The univariate SA described in Porta et al.10 was
applied to symbolize the HP and SAP series and
reduce the redundancy of patterns and the JSA set in
Porta et al.15 was carried out to assess the degree of
the HP-SAP coupling. Briely, the HP and SAP series were transformed into a sequence of ξ=6 symbols. Two sets of symbolic patterns were built by taking
three consecutive symbols from the two symbolic
series of HP and SAP respectively. All symbolic patterns were classiied into four classes depending
on the frequency content of the symbolic pattern:
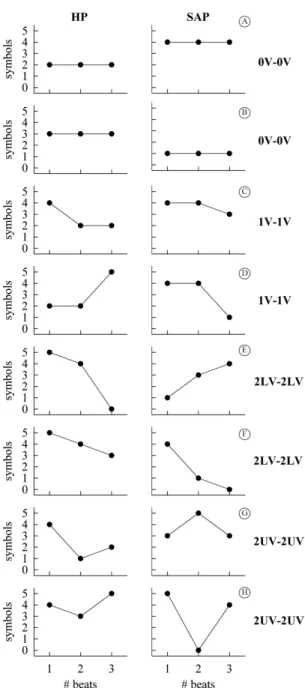
i) no variation (0V); ii) one variation (1V); iii) two like variations (2LV); iv) two unlike variations (2UV). 0V and 2UV families collected the most steady and the most variable patterns respectively, while 1V and 2LV classes exhibited an intermediate level of fast frequencies with the 2LV patterns faster than the 1V ones. From the two sequences of HP and SAP symbolic patterns, the JSA created a set of the joint
schemes by associating a HP symbolic pattern with
the τ-beat-ahead symbolic pattern of SAP, where τ represented the delay between HP and SAP samples.
Since the authors were not interested in the causal
464 Braz J Phys Ther. 2016 Sept-Oct; 20(5):461-470
to the convention of SAP measurement, SAP(i) can affect HP(i) along the causal pathway from
SAP to HP, while this situation cannot occur along the reverse causal pathway (i.e. from HP to SAP) and
one beat delay was imposed27. Patterns were deined to be coordinated whether symbolic patterns of HP
and SAP belonged to the same family (i.e. 0V, 1V, 2LV and 2UV). All coordinated patterns dropped into four families labeled as 0V-0V, 1V-1V, 2LV-2LV and 2UV-2UV respectively. Two examples of the
joint patterns for each pattern family are shown in Figure 1. The percentage of 0V-0V, 1V-1V, 2LV-2LV
and 2UV-2UV inside the class of the coordinated patterns was computed and indicated as 0V-0V%, 1V-1V%, 2LV-2LV% and 2UV-2UV%. 0V-0V%, 1V-1V%, 2LV-2LV% and 2UV-2UV% ranging from 0 to 100, where, assigned the type of coordination, 0 indicated perfect HP-SAP uncoupling, while 100 indicated full association.
Statistical analysis
One way repeated measures analysis of variance (Dunnett’s method for multiple comparisons), or
Friedman repeated measures analysis of variance on
ranks (Dunnett’s method for multiple comparisons) when appropriate, was applied to check the signiicance of the differences among parameters compared to REST.
The Pearson correlation analysis was performed to
check the linear association of any parameter with tilt table inclination. Linear regression analysis was carried out only if a signiicant difference compared to REST was found. Pearson product moment correlation coeficient r and the type I error probability p in testing the null hypothesis of lat slope was computed. Statistical analysis was carried out using a commercial statistical program (Sigmaplot, ver.11, Systat Software, San Jose, CA, USA). A p<0.05 was always considered as signiicant.
Results
Figure 2 shows the individual values (solid circles) of
r2 as a function of the tilt table inclination. A signiicant
variation of r2 with respect to REST was detected only during T90. A signiicant positive relation of r2 on tilt table angles was found (r=0.356, p=2.62.10-5). Since a signiicant modiication of r2 compared to REST and a signiicant linear relation of r2 on tilt table angles
were found, the linear regression (solid line) and its 95 percent conidence interval (dotted lines) were
plotted in Figure 2 as well.
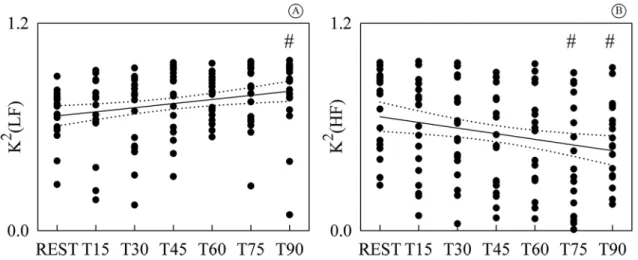
Figure 3 shows the individual values (solid circles) of K2(LF) (Figure 3A) and K2(HF) (Figure 3B) as
a function of the tilt table inclination. K2(LF) was
signiicantly different from REST during T90, while
K2(HF) was signiicantly different during T75 and T90. While K2(LF) exhibited a positive linear trend with tilt table angles (Figure 3A, r=0.245, p=4.46.10-3),
Figure 1. Representation of HP-SAP patterns formed by joining a
K2(HF) decreased with the magnitude of the orthostatic challenge (Figure 3B, r=-0.234, p= 6.81.10-3). Since
a signiicant modiication of K2(LF) and K2(HF)
compared to REST and signiicant linear relations of
K2(LF) and K2(HF) on tilt table angles were found,
linear regressions (solid lines) and their 95 percent conidence intervals (dotted lines) were plotted in Figures 3A, B as well.
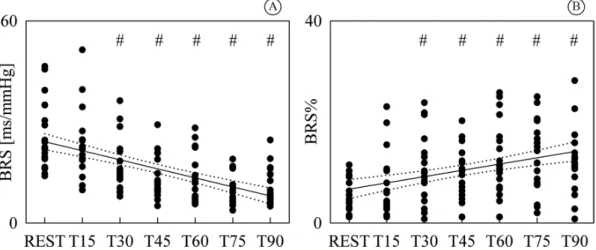
Figure 4 shows the individual values (solid circles)
of BRS (Figure 4A) and BRS% (Figure 4B) as a
function of the tilt table inclination. Both BRS and BRS% were signiicantly different from REST as early as T30 and steadily varied with tilt table inclination. While BRS exhibited a negative linear trend with
tilt table angles (Figure 4A, r=-0.575, p=4.77.10-13),
BRS% increased with the magnitude of the orthostatic
challenge (Figure 4B, r=0.378, p=7.71.10-6). Since a
signiicant modiication of BRS and BRS% compared to REST and signiicant linear relations of BRS and BRS% on tilt table angles were found, linear regressions (solid lines) and their 95 percent conidence intervals
(dotted lines) were plotted in Figures 4A, B as well.
Figure 5 shows the individual values (solid circles)
of 0V-0V% (Figure 5A), 1V-1V% (Figure 5B), 2LV-2LV% (Figure 5C) and 2UV-2UV% (Figure 5D)
as a function of the tilt table inclination. 0V-0V% and 2UV-2UV% were signiicantly different from REST during T45, T60, T75 and T90, while 2LV-2LV% was signiicantly different during T60, T75 and T90. 1V-1V% did not vary compared to REST. While 0V-0V% increased with tilt table inclination (Figure 5A, r=0.471, p=1.04.10-8), 2LV-2LV% and 2UV-2UV%
exhibited a negative linear relation on the magnitude of the orthostatic challenge (Figure 5C, r=-0.266, p=2.0.10-3 and Figure 5D, r=-0.441, p=1.08.10-7). Since
1V-1V% was stable with tilt table angles, the linear
regression analysis was not carried out (Figure 5B).
Since a signiicant modiication compared to REST and signiicant linear relations on tilt table angles were found only in the case of 0V-0V%, 2LV-2LV% and 2UV-2UV%, the linear regressions (solid lines) and
Figure 3. Individual values (solid circles) of K2(LF) (A) and K2(HF) (B) are shown as a function of the tilt table inclination. The signiicant
difference of the values compared to REST is marked by the symbol #. The linear regression (solid line) and its 95 percent conidence interval (dotted lines) were plotted as well. While a signiicant positive correlation on tilt table angles was found in (A), a negative one was detected in (B). K2(LF): squared coherence at low frequency; K2(HF): squared coherence at high frequency; T: head-up tilt.
Figure 2. Individual values (solid circles) of r2 are shown as a
function of the tilt table inclination. The signiicant difference of the values compared to REST is marked by the symbol #. The linear regression (solid line) and its 95 percent conidence interval (dotted lines) were plotted as well. A signiicant positive correlation on tilt table angles was found. r2: squared correlation
466 Braz J Phys Ther. 2016 Sept-Oct; 20(5):461-470
Figure 4. Individual values (solid circles) of BRS (A) and BRS% (B) are shown as a function of the tilt table inclination. The signiicant
difference of the values compared to REST is marked by the symbol #. The linear regression (solid line) and its 95 percent conidence interval (dotted lines) were plotted as well. While a signiicant negative correlation on tilt table angles was found in (A), a positive one was detected in (B). BRS: barorelex sensitivity; BRS%: percentage of barorelex sequences; T: head-up tilt.
Figure 5. Individual values (solid circles) of 0V-0V% (A); 1V-1V% (B); 2LV-2LV% (C) and 2UV-2UV% (D) are shown as a function
their 95 percent conidence intervals (dotted lines)
were plotted only in Figures 5A, C, D.
It is remarkable that the type I error probability
of the linear correlation analysis was much smaller
in case of 0V-0V% and 2UV-2UV% than r2, K2(LF),
K2(HF) and BRS%, thus suggesting a greater statistical power of JSA than time and frequency domain linear
HP-SAP coupling indexes.
Discussion
The main indings of the study can be summarized
as follows: i) the JSA indicated that the strength of the cardiovascular coupling at slow time scales gradually increased with the magnitude of the orthostatic
challenge, while coupling at fast time scales gradually
decreased; ii) this result could not be achieved by a global time domain index of HP-SAP coupling
strength such as the squared correlation coeficient and percentage of barorelex sequences; iii) the JSA
seemed to be more powerful than squared coherence
function as a likely result of a more limited dispersion of symbolic indexes.
JSA of HP and SAP variability series during graded head-up tilt
The adopted JSA could assess the degree of coordination between HP and SAP series at different time scales15. This property was the result of the
deinition of the 0V-0V, 1V-1V, 2LV-2LV and 2UV-2UV
families that associate HP and SAP patterns with
different frequency contents. For example, the joint pattern 2UV-2UV connected together rapidly changing HP and SAP patterns featuring fast temporal scales, while the joint pattern 0V-0V linked together very stable HP and SAP patterns characterized by slow time scales. The 1V-1V and 2LV-2LV classes allowed the
exploration of the degree of HP-SAP coordination at time scales intermediate between those covered by
0V-0V and 2UV-2UV families because 1V and 2LV
patterns exhibited a frequency content faster than
the 0V class and slower than the 2UV one with the 2LV patterns more rapidly varying than the 1V ones.
This study originally showed that the strength of the
cardiovascular coupling at slow time scales, as assessed by 0V-0V%, gradually increased with the magnitude of the orthostatic challenge, while that at fast time scales, as assessed by 2UV-2UV%, progressively decreased. The increase of 0V-0V%, with tilt table inclination was likely the effect of an augmented solicitation of the cardiac barorelex in response to the modiication
of posture22,28,29, while the decrease of 2UV-2UV% with tilt table angles could have been a consequence of the vagal withdrawal proportional to magnitude of the orthostatic challenge8,30-32 leading to a HP-SAP
uncoupling at the respiratory rate.
JSA is more powerful than its linear counterparts in the assessment of cardiovascular coupling during graded head-up tilt
The considered JSA was more powerful than a traditional linear analysis based on squared correlation
coeficient or percentage of barorelex sequences due
to the ability of the symbolic approach to assess the
coupling strength at different temporal scales. Indeed, the squared correlation coeficient was a global marker of the HP-SAP association, and the percentage of barorelex sequences assessed the strength of the
variability interactions along the time scale selected
for the description of the barorelex action (here the fast vagal arm). In this speciic application, the type I error probability of the squared correlation coeficient was above that of 0V-0V% and 2UV-2UV% probably because the squared correlation coeficient accounted
for the opposite trends of the HP-SAP association
occurring at faster and slower time scales. Similar conclusion holds for the percentage of barorelex sequences as a likely consequence of the limited ability of the cardiac barorelex in accounting for the
total HP-SAP interactions33 (this index mainly focused
the barorelex ones). It is worth noting that, although the squared correlation coeficient and percentage of barorelex sequences were indexes spanning different time scales and focused on different mechanisms, the conclusion was exactly the same (i.e. the strength of
the HP-SAP coupling increased with the tilt table
inclination).
It is remarkable that the considered JSA was
more powerful than a frequency domain tool that had intrinsically the ability to measure the coupling strength as a function of the time scale such as
the squared coherence function. Indeed, in this
experimental protocol squared coherence function in
the LF and HF bands exhibited the same trends with the magnitude of the orthostatic stimulus as 0V-0V% and 2UV-2UV% indexes respectively. However, the type I error probability of the squared coherence function in the LF and HF bands was much higher than that of 0V-0V% and 2UV-2UV%. This worse performance
468 Braz J Phys Ther. 2016 Sept-Oct; 20(5):461-470
indexes. The smaller dispersion of JSA markers
compared to frequency domain indexes might have been the effect of the coarse graining procedure reducing the superposed noise1. However, the capability of the JSA to interpret nonlinear dynamics may also have
played a role in boosting performances.
Perspective and significance
The degree of the cardiovascular coupling was
usually signiicant in healthy subjects due to the
closed-loop interactions between HP and SAP
variability. Both mechanical feedforward, due to diastolic runoff and the Starling law, and barorelex feedback contributed to the intertwined relations
between HP and SAP variabilities27,33. Therefore, a
lack of association between HP and SAP variability or
even a decrease of cardiovascular coupling below the
high values usually found at REST in healthy subjects
was considered to be an index of impairment of the
cardiovascular control. For example, the strength of the cardiovascular coupling decreased, especially at slow time scales, when cardiovascular control
was depressed by general anesthesia34. Pathological
conditions such as heart failure, myocardial infarction, cardiac autonomic neuropathy, peripheral neuropathy, ibromyalgia, dysautonomia, orthostatic intolerance and frailty syndrome signiicantly decreased the magnitude
of the HP-SAP coupling to such a level that HP and SAP series might be uncoupled35-39. However, even an exaggerated increase in coordination between HP and SAP variabilities could indicate the impairment
of the cardiovascular control. For example, just before the development of syncope, the degree of
HP-SAP association at slow time scales was found to be increased15. In the context of the quantiication
of the strength of the HP-SAP variability interactions,
JSA seems to be a powerful method capable of coping with the usually large within-subject and between-subject variability present in pathological groups and in particularly challenging situations such
as during general anesthesia and in critical care units. In addition, the application of this tool might provide
additional information compared to linear methods when nonlinear HP-SAP variability interactions are present40.
References
1. Porta A, BaumertM, Cysarz D, Wessel N. Enhancing dynamical signatures of complex systems through symbolic
computation.Phil Trans R Soc A.2015;373(2034):2014009.
PMid:25548265.
2. TakahashiACM, Porta A, MeloRC, Quiterio RJ, da Silva E,
Borghi-Silva A, et al. Aging reduces complexity of heart rate variability assessed by conditional entropy and symbolic
analysis.Intern Emerg Med. 2012;7(3):229-35. http://dx.doi.
org/10.1007/s11739-011-0512-z. PMid:21253879.
3. Moura-TonelloSCG, TakahashiACM, Francisco CO, Lopes
SLB, Del ValeAM, Borghi-Silva A, et al. Influence of type
2 diabetes on symbolic analysis and complexity of heart rate variability in men.Diabetol Metab Syndr. 2014;6(1):13.
http://dx.doi.org/10.1186/1758-5996-6-13. PMid:24485048.
4. Wessel N, Ziehmann C, Kurths J, MeyerfeldtU, Schirdewan A, Voss A. Short-term forecasting of life-threatening cardiac arrhythmias based on symbolic dynamics and finite-time
growth rates.Phys Rev E Stat Phys Plasmas Fluids Relat Interdiscip Topics. 2000;61(1):733-9. http://dx.doi.org/10.1103/
PhysRevE.61.733. PMid:11046317.
5. Voss A, Kurths J, Kleiner HJ, Witt A, Wessel N, Saparin P, et al. The application of methods of non-linear dynamics for the improved and predictive recognition of
patients threatened by sudden cardiac death.Cardiovasc Res. 1996;31(3):419-33.
http://dx.doi.org/10.1016/0008-6363(96)00008-9. PMid:8681329.
6. Cysarz D, Porta A, MontanoN, Leeuwen P, Kurths J. Quantifying heart rate dynamics using different approaches
of symbolic dynamics.Eur Phys J Spec Top. 2013;222(2):487
-500. http://dx.doi.org/10.1140/epjst/e2013-01854-7. 7. Cysarz D, Van Leeuwen P, Edelhauser F, MontanoN, Somers
VK, Porta A. Symbolic transformations of heart rate variability preserve information about cardiac autonomic
control.Physiol Meas. 2015;36(4):643-57. http://dx.doi.
org/10.1088/0967-3334/36/4/643. PMid:25798889. 8. Porta A, Tobaldini E, Guzzetti S, Furlan R, MontanoN,
Gnecchi-Ruscone T. Assessment of cardiac autonomic modulation during graded head-up tilt by symbolic analysis
of heart rate variability.Am J Physiol Heart Circ Physiol. 2007;293(1):H702-8. PMid:17308016.
9. Porta A, Faes L, MaséM, D’Addio G, Pinna GD, Maestri
R, et al. An integrated approach based on uniform quantization for the evaluation of complexity of short-term heart period
variability: application to 24h Holter recordings in healthy and heart failure humans.Chaos. 2007;17(1):015117. http://
dx.doi.org/10.1063/1.2404630. PMid:17411274.
10. Porta A, Guzzetti S, MontanoN, Furlan R, Pagani M, Malliani A, et al.Entropy, entropy rate and pattern classification as tools to typify complexity in short heart period variability
series.IEEE Trans Biomed Eng. 2001;48(11):1282-91. http://
dx.doi.org/10.1109/10.959324. PMid:11686627.
11. Guzzetti S, BorroniE, GarbelliPE, CerianiE, Della Bella P,
MontanoN, et al. Symbolic dynamics of heart rate variability
A probe to investigate cardiac autonomic modulation. Circulation. 2005;112(4):465-70. http://dx.doi.org/10.1161/
CIRCULATIONAHA.104.518449. PMid:16027252. 12. Zebrowski JJ, Poplawska W, BaranowskiR, Buchner T.
Symbolic dynamics and complexity in a physiological
time series.Chaos Solitons Fractals. 2000;11(7):1061-75.
http://dx.doi.org/10.1016/S0960-0779(99)00004-1.
13. Wessel N, Suhrbier A, RiedlM, MarwanN, Malberg H, Bretthauer
G, et al. Detection of time-delayed interactions in biosignals
using symbolic coupling traces.EPL. 2009;87(1):10004.
14. BaumertM, Walther T, Hopfe J, Stepan H, Faber R, Voss A. Joint symbolic dynamics analysis of beat-to-beat interactions of heart rate and systolic blood pressure in
normal pregnancy.Med Biol Eng Comput. 2002;40(2):241-6.
http://dx.doi.org/10.1007/BF02348131. PMid:12043807. 15. Porta A, Marchi A, BariV, Heusser K, Tank J, Jordan J, et al.
Conditional symbolic analysis detects nonlinear influences of respiration on cardiovascular control in humans. Philos Trans A Math PhysEng Sci.2015;373:20140096. 16. Guzzetti S, Marchi A, Bassani T, CiterioG, Porta A. Univariate
and bivariate symbolic analyses of cardiovascular variability
differentiate general anesthesia procedures. Physiol
Meas. 2015;36(4):715-26.
http://dx.doi.org/10.1088/0967-3334/36/4/715. PMid:25798537.
17. BaumertM, Javorka K, Kabir MM. Joint symbolic dynamics for the assessment of cardiovascular and
cardiorespiratory interactions. Philos Trans A Math Phys Eng Sci. 2015;373:20140097.
18. Kabir MM, Saint DA, NalivaikoE, Abbott D, Voss A,
BaumertM. Quantification of cardiorespiratory interactions
based on joint symbolic dynamics.Ann Biomed Eng. 2011;39(10):2604-14.
http://dx.doi.org/10.1007/s10439-011-0332-3. PMid:21618043.
19. Schulz S, Haueisen J, Bar K-J, Voss A. A high resolution joint symbolic analysis to enhance classification of the
cardiorespiratory system in patients with schizophrenia and their relatives. Philos Trans A Math PhysEng Sci. 2015;373:20140098.
20. Valencia JF, VallverdùM, RiveroI, Voss A, Bayes de Luna A, Porta A, et al. Symbolic dynamics to discriminate healthy and ischemic dilated cardiomyopathy populations: an
application to the variability of heart period and QT interval. Philos Trans A Math Phys Eng Sci. 2015;373:20140092.
21. BaranowskiR, Zebrowski JJ. Assessment of the RR versus
QT relation by a new symbolic dynamics method - Gender differences in repolarization dynamics.J Electrocardiol. 2002;35(2):95-103. http://dx.doi.org/10.1054/jelc.2002.32414.
PMid:11953908.
22. Porta A, CataiAM, TakahashiACM, MagagninV, Bassani T, Tobaldini E, et al. Causal relationships between heart period
and systolic arterial pressure during graded head-up tilt. Am
J Physiol Regul Integr Comp Physiol. 2011;300(2):R378-86.
PMid:20962207.
23. Task Force On. Heart rate variability: standards of
measurement, physiological interpretation and clinical use. Circulation. 1996;93(5):1043-65. http://dx.doi.org/10.1161/01.
CIR.93.5.1043. PMid:8598068.
24. MagagninV, Bassani T, BariV, Turiel M, MaestriR, Pinna
GD, et al. Non-stationarities significantly distort
short-term spectral, symbolic and entropy heart rate variability indexes.Physiol Meas. 2011;32(11):1775-86. http://dx.doi.
org/10.1088/0967-3334/32/11/S05. PMid:22027399. 25. Porta A, BaselliG, RimoldiO, Malliani A, Pagani M. Assessing
baroreflex gain from spontaneous variability in conscious
dogs: role of causality and respiration. Am J Physiol Heart
Circ Physiol. 2000;279(5):H2558-67. PMid:11045994.
26. BertinieriG, di RienzoM, Cavallazzi A, Ferrari AU, Pedotti A, ManciaG. A new approach to analysis of the arterial
baroreflex. J Hypertens. 1985;3(3):S79-81. PMid:2856787.
27. BaselliG, Cerutti S, Badilini F, BiancardiL, Porta A, Pagani
M, et al. Model for the assessment of heart period and arterial pressure variability interactions and respiratory
influences.Med Biol Eng Comput. 1994;32(2):143-52.
http://dx.doi.org/10.1007/BF02518911. PMid:8022210. 28. Porta A, Bassani T, BariV, Tobaldini E, TakahashiACM,
CataiAM, et al. Model-based assessment of baroreflex and cardiopulmonary couplings during graded head-up
tilt.Comput Biol Med. 2012;42(3):298-305. http://dx.doi.
org/10.1016/j.compbiomed.2011.04.019. PMid:21621756. 29. Porta A, Faes L, NolloG, BariV, Marchi A, De MariaB, et al.
Conditional self-entropy and conditional joint transfer
entropy in heart period variability during graded postural
challenge.PLoS One. 2015;10(7):e0132851. http://dx.doi.
org/10.1371/journal.pone.0132851. PMid:26177517. 30. Montano N, Gnecchi-Ruscone T, Porta A, Lombardi F,
Pagani M, Malliani A. Power spectrum analysis of heart rate variability to assess changes in sympatho-vagal balance
during graded orthostatic tilt.Circulation. 1994;90(4):1826-31.
http://dx.doi.org/10.1161/01.CIR.90.4.1826. PMid:7923668.
31. Furlan R, Porta A, Costa F, Tank J, BakerL, Schiavi R, et al.
Oscillatory patterns in sympathetic neural discharge and cardiovascular variables during orthostatic stimulus. Circulation. 2000;101(8):886-92. http://dx.doi.org/10.1161/01.
CIR.101.8.886. PMid:10694528.
32. Cooke WH, Hoag JB, Crossman AA, Kuusela TA, Tahvanainen
KUO, EckbergDL. Human responses to upright tilt: a window
on central autonomic integration. J Physiol. 1999;517(Pt
2):617-28. http://dx.doi.org/10.1111/j.1469-7793.1999.0617t.x.
PMid:10332107.
33. Porta A, Furlan R, RimoldiO, Pagani M, Malliani A, van
de Borne P. Quantifying the strength of the linear causal coupling in closed loop interacting cardiovascular variability
signals.Biol Cybern. 2002;86(3):241-51. http://dx.doi.
org/10.1007/s00422-001-0292-z. PMid:12068789.
34. Porta A, BariV, Bassani T, Marchi A, Pistuddi V, RanucciM.
Model-based causal closed loop approach to the estimate
of baroreflex sensitivity during propofol anesthesia in
patients undergoing coronary artery bypass graft. J Appl Physiol. 2013;115(7):1032-42. http://dx.doi.org/10.1152/
japplphysiol.00537.2013. PMid:23869064.
35. Pinna GD, MaestriR, RaczakG, La RovereMT. Measuring baroreflex sensitivity from the gain function between arterial
pressure and heart period.Clin Sci. 2002;103(1):81-8. http://
dx.doi.org/10.1042/cs1030081. PMid:12095408.
36. LipmanRD, Salisbury JK, Taylor JA. Spontaneous
indexes are inconsistent with arterial baroreflex gain.
Hypertension. 2003;42(4):481-7. http://dx.doi.org/10.1161/01.
HYP.0000091370.83602.E6. PMid:12975383.
37. ZamunérAR, Porta A, Andrade CP, Marchi A, Forti M, Furlan R, et al. Cardiovascular control in women with fibromyalgia syndrome: do causal methods provide non redundant information compared to more traditional approaches? Am J Physiol Regul Integr Comp Physiol.
2015;309(1):R79-84. PMid:25904683.
470 Braz J Phys Ther. 2016 Sept-Oct; 20(5):461-470
sympathetic baroreflex control to the vessels. Physiol
Meas. 2015;36(4):633-41.
http://dx.doi.org/10.1088/0967-3334/36/4/633. PMid:25798786.
39. Bassani T, BariV, Marchi A, Tassin S, Dalla VecchiaL, Canesi
M, et al. Model-free causality analysis of cardiovascular variability detects the amelioration of the autonomic control
in Parkinson’s disease patients undergoing mechanical stimulation.Physiol Meas. 2014;35(7):1397-408. http://
dx.doi.org/10.1088/0967-3334/35/7/1397. PMid:24875165. 40. NolloG, Faes L, Porta A, Pellegrini B, Ravelli F, Del Greco
M, et al. Evidence of unbalanced regulatory mechanism of heart
rate and systolic pressure after acute myocardial infarction.
Am J Physiol Heart Circ Physiol. 2002;283(3):H1200-7.
PMid:12181151.
Correspondence Alberto Porta
Università degli Studi di Milano
Dipartimento di Scienze Biomediche per la Salute Laboratorio di Modellistica di Sistemi Complessi IRCCS Policlinico San Donato
Via F. Fellini 4