Short Report
Printed in Brazil - ©2016 Sociedade Brasileira de Química0103 - 5053 $6.00+0.00*e-mail: [email protected], [email protected]
Simultaneous Determination of Thorium and Uranium in Mineral Fertilizers by
Inductively Coupled Plasma Optical Emission Spectrometry
Sidnei O. Souza,a,b Dayara V. L. Ávila,b Adnívia S. C. Monteiro,c Carlos Alexandre B. Garcia,b José P. H. Alves,b Tatiane A. Maranhãod and Rennan G. O. Araujo*,a,b
aInstituto de Química, Universidade Federal da Bahia (UFBA), 40170-115 Salvador-BA, Brazil
bLaboratório de Química Analítica Ambiental, Departamento de Química, Universidade Federal de
Sergipe (UFS), 49100-000 São Cristóvão-SE, Brazil
cUniversidade Estadual Paulista “Júlio de Mesquita Filho” (UNESP), 14800-901 Araraquara-SP, Brazil
dUniversidade Federal de Santa Catarina (UFSC), 88040-900 Florianópolis-SC, Brazil
The simultaneous determination of thorium and uranium in mineral fertilizers by inductively coupled plasma optical emission spectrometry (ICP OES) was optimized. The three-level factorial design was applied to optimize the operating conditions of radiofrequency power and nebulizer gas flow rate. The analytical method was specific and selective for both elements.
Keywords: thorium, uranium, simultaneous determination, experimental design, ICP OES
Introduction
In recent decades, food security has become an aspect of great concern regarding environmental safety due to the accumulation of toxic chemicals in the environment, caused
by the emission of natural and anthropogenic sources.1-9
Among the anthropogenic sources, mineral fertilizers used as supplies to provide chemical elements and needed nutrients for the plants can be highlighted. In recent years, with the expansion of agricultural activities, there has been an increase in the implementation of the same inefficient use of the planting areas that ended up in negative environmental consequences, such as pollution, biodiversity loss, soil nutrients imbalance, salinization, besides economic damage and human and animal health harm, as a result of the introduction of contaminants from various sources used in
the manufacturing process of agricultural supplies.1-6,10
Nitrogen, potassium and sulfur-based fertilizers are relatively free of contaminants, but the phosphate fertilizers, derived from phosphate rock, may contain several contaminants, such as As, Be, Cd, Cr, F, Hg, Mn, Pb, Sr, Th, U, V and Zr, and the concentrations of these depend on the geological origin and location of phosphate
rock mining.11-13
The actinide elements thorium and uranium are important from the point of view of technological applications, especially in metallurgy, ceramics and nuclear industry. They occur naturally in the environment at concentrations of 10-15
and 2-4 mg kg-1, respectively.14,15 These trace elements are
found in soil, rocks, water and other samples, and can be
incorporated into the human food chain.16 Their metal ions
are known to cause acute toxicological effects on humans,
and their compounds are potential carcinogenics.17-19
Aiming harmless food production, in recent decades, some countries have established limits for contaminants in mineral fertilizers. In Canada, through the Federal Fertilizers Act, limits for the contents of As, Cd, Pb and
Zn were adopted.20 In the United States one federal law
controls the content of contaminants in fertilizers, through the regulation published in July 24, 2002 by the United States Environmental Protection Agency (USEPA), which establishes limits for content of As, Cd, Cr, Pb and Hg in
zinc-based fertilizer.21 Besides each state having its own
regulation, in Brazil, the Ministry of Agriculture, Livestock and Food Supply (Ministério da Agricultura, Pecuária e Abastecimento (MAPA)), through the Normative No. 27 (June 5, 2006), established the maximum limits for contaminants, such as As, Cd, Cr, Pb and Hg in mineral fertilizers as well as the percentage of phosphorus pentoxide
Thorium and uranium determination in various types of matrices and by different techniques and methods has been
widely reported in the literature. Krejcova et al.23 carried
out the determination of Th, U and other elements in several related river species (fish, insects, benthos) by orthogonal time-of-flight (o-TOF) inductively coupled plasma mass
spectrometry (ICP-MS). Avivar et al.24 performed the
determination of Th and U, at trace level, in environmental samples using solid-phase extraction online connected to ICP-MS. The determination of Th, U and Ra isotopes in samples of water and soil was accomplished by alpha
spectroscopy, as described by Hao et al.25 According to
Zoriy et al.,26 Th and U concentrations in plant samples were
determined using quadrupole ICP-MS. Abdul-Hadi et al.27
used energy dispersive X-ray fluorescence spectrometry (EDXRF) to determine the concentrations of Th, U and K in rock samples. Determination of Th and U by inductively coupled plasma optical emission spectrometry (ICP OES) is described in many studies reporting separation processes of these two elements, in order to avoid spectral interferences caused by emission lines of Th on the lines of the U, as for
example, described by Daneshvar et al.18 that determined Th
and U in natural water samples by ICP OES after extraction and pre-concentration.
The determination of U by ICP OES may find some drawbacks due to spectral interferences caused by rare earth elements, calcium, iron, vanadium and zirconium. Thorium can also interfere in the determination of U, depending on the choice of the emission line, whose selection for analysis by ICP OES must take into account the following parameters: sensitivity, spectral interferences, sample matrix and the expected
concentrations of the elements.28-30
Different empirical methods were developed, such as combination of arrays, internal standardization, standard addition and methods based on empirical modeling, to
correct matrix effects in ICP OES.29-31 The current optical
spectrometers are equipped with grid echelle and charged-coupled devices (CCD), which improve the measurements of several spectral lines, allowing the separation of emission peaks and minimizing the overlap lines, thus enabling to
perform simultaneous measurements.28,31-36
The intensity of a spectral line depends on the experimental parameters of the ICP OES instrument, radiofrequency power, nebulizer gas flow and plasma observation site (axial or radial), which can be optimized. The adjustment of these operating parameters allows a robust condition for analysis, in which the ICP system resists changes in concentration of the concomitants in the matrix with no significant variation in the intensity of the
emission line of analytes.28,31-34
This work proposes the optimization of an analytical method for the simultaneous determination of Th and U in mineral fertilizers by ICP OES.
Experimental
Instrumentation
An ICP OES with axial view (View Pro, Varian, Mulgrave, Australia) and solid state detector cooled to –35 ºC by a Peltier system was employed in all measurements. The echelle polychromator is maintained at 34 ºC and purged with argon 99.9999% (White Martins, São Paulo, Brazil), allowing measurements in the spectral range of 167-785 nm. The observation zone in the axially viewed system was automatically set by the program supplied with the axial view control software using the Mn II 257.610 nm emission line. The operating conditions established are shown in Table 1.
External calibration was used for the determination of the elements. For Th and U an intermediate solution was prepared
by dilution of a 1000 mg L-1 stock solution (Specsol®) to a
concentration of 100 mg L-1. Another 1000 mg L-1 stock
solution (Specsol®) containing Ca and Fe was diluted
according to the calibration range. The calibration curves
were prepared in concentrations from 0.4 up to 4.0 mg L-1
for Th and U, and from 5.0 up to 200.0 mg L-1 for Ca and
Fe, six solutions including the blank.
Sampling, sample preparation and addition, and recovery test
Mineral fertilizer samples were obtained in the state of Sergipe, Brazil, and analyzed. The procedure employed
Table 1. Characteristics and operating conditions used for analysis by ICP OES with axial view
Parameter Condition
Radiofrequency power / kW 1.0
Plasma gas flow rate / (L min-1) 15.0 Auxiliary gas flow / (L min-1) 1.5 Nebulizer gas flow rate / (L min-1) 0.9
Nebulizer type concentric, SeaSpray
Spray chamber type cyclone
Replicates 3
Injector tube diameter / mm 2.4
Signal integration time / s 1.0
Background corrector automatic mode on Wavelength / nm Th II: 401.913; U II: 385.957;
in the preparation of the samples had been optimized in
another study carried out by our group.37 The first step of
the procedure was drying under mild conditions, in an oven
with air circulation for 48 h at the temperature of 40 oC, in
order to prevent the loss of volatile elements such as mercury. Prior to digestion, the samples were ground in a mortar, and sieved to achieve fine particle size smaller than 150 µm.
A mass of approximately 0.20 g (dry weighed) of the samples was introduced into Teflon pumps, suitable for
block digestion, and then, 1.4 mL of concentrated HNO3
(65% m/m), 1.0 mL of H2O2 (30% m/m) and 7.6 mL of
deionized water were added to a final volume of 10.0 mL. The system was closed and the samples were heated and
kept at 180 oC for 2 h. After digestion the samples were
transferred to volumetric flasks, and completed to a final
volume of 25.0 mL with deionized water.37
For addition and recovery test 1.0 mg L-1 of Th and
U was added to five different samples of commercial fertilizer and standard reference materials (SRMs), Florida Phosphate Rock (National Institute of Standards and Technology (NIST) SRM 120c) and Western Phosphate Rock (NIST SRM 694). The procedure was applied to the
samples, blank solutions and SRMs in triplicate.38,39
Results and Discussion
Evaluation of the operating conditions of the ICP OES using three-level full factorial design
The emission intensities of Th and U were measured at different wavelengths available on spectrometer program
software for Th (268.429, 269.242, 274.716, 283.730, 288.505, 318.019 and 401.913 nm) and U (263.553, 294.192, 367.007, 385.464, 385.957 and 409.013 nm). This procedure allowed the selection of the lines considered more sensitive and free of spectral interferences, since the spectrometer has a resolution of 0.002 nm. The lines chosen for subsequent steps of the study were wavelengths of 401.913 nm for Th and 385.957 nm for U.
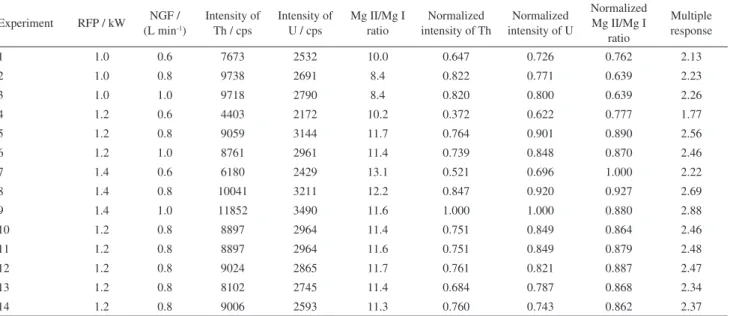
A three-level factorial design with two variables, in which the central point was quintuplicated, was applied to optimize the operating parameters of the ICP OES. The variables evaluated were radiofrequency power (RFP) and nebulizer gas flow rate (NGF). The matrix of the factorial
design is shown in Table 2.The experimental data were
treated using Statistica 8.0® software.
The response of the factorial design was evaluated through the intensities of Th and U and the ratio of the emission intensities of the atomic and ionic lines of magnesium [Mg II (280.265 nm)/Mg I (285.1213 nm)]. For Mg II/Mg I ratio, a value greater than 8.0 indicates the plasma robust conditions, which minimizes interferences from the ICP system allowing to adapt changes in the concentrations of the major elements, acids, and other components with no significant variation in the intensities
of analyte lines.32,33
The normalization of the intensities of Th, U and Mg II/Mg I ratio were performed dividing each value by the highest value of each response according to the concept of multiple response (MR) (equation 1) obtained through the sum of the three individual responses (intensity of Th, intensity of U and Mg II/Mg I ratio):
Table 2. Matrix of the three level factorial design and two variables
Experiment RFP / kW NGF / (L min-1)
Intensity of Th / cps
Intensity of U / cps
Mg II/Mg I ratio
Normalized intensity of Th
Normalized intensity of U
Normalized Mg II/Mg I
ratio
Multiple response
1 1.0 0.6 7673 2532 10.0 0.647 0.726 0.762 2.13
2 1.0 0.8 9738 2691 8.4 0.822 0.771 0.639 2.23
3 1.0 1.0 9718 2790 8.4 0.820 0.800 0.639 2.26
4 1.2 0.6 4403 2172 10.2 0.372 0.622 0.777 1.77
5 1.2 0.8 9059 3144 11.7 0.764 0.901 0.890 2.56
6 1.2 1.0 8761 2961 11.4 0.739 0.848 0.870 2.46
7 1.4 0.6 6180 2429 13.1 0.521 0.696 1.000 2.22
8 1.4 0.8 10041 3211 12.2 0.847 0.920 0.927 2.69
9 1.4 1.0 11852 3490 11.6 1.000 1.000 0.880 2.88
10 1.2 0.8 8897 2964 11.4 0.751 0.849 0.864 2.46
11 1.2 0.8 8897 2964 11.6 0.751 0.849 0.879 2.48
12 1.2 0.8 9024 2865 11.7 0.761 0.821 0.887 2.47
13 1.2 0.8 8102 2745 11.4 0.684 0.787 0.868 2.34
14 1.2 0.8 9006 2593 11.3 0.760 0.743 0.862 2.37
MR = Intensity of Th + Intensity of U +
Maximum intensity of Th Maximum intensity of U
(Mg II/Mg I) ratio Maximum (Mg II/Mg I) ratio
(1)
wherein intensity of Th is the intensity measured at wavelength 401.913 nm; maximum intensity of Th is the intensity measured at wavelength 401.913 nm in the factorial design proposed; intensity of U is the intensity measured at wavelength 385.957 nm; maximum intensity of U is the intensity measured at wavelength 385.957 nm in factorial design proposed; (Mg II/Mg I) ratio is the value between the intensities of the Mg II (280.265 nm) and Mg I (285.208 nm) emission lines, and maximum (Mg II/Mg I) ratio is the maximum value of the ratio between the intensities of the emission lines found in the experiments.
Observing the Pareto chart with standardized effect estimate (absolute value), shown in Figure 1, it is possible to confirm that all variables were significant for the system, as well as the interactions between them. The most significant variable was the linear NGF since it increases the efficiency of aerosol generation reaching the plasma, i.e., a large
amount of atoms are excited. The linear RFP is the second most significant variable.
The more RFP is increased, the more the increase in the energy available to excite Th atoms will be and, consequently, the higher the intensity of the emission lines of the analyte
will be.28 The interaction between the variables was also
positive, showing the direct relation of the RPF and NGF on the increase of the intensity of both elements.
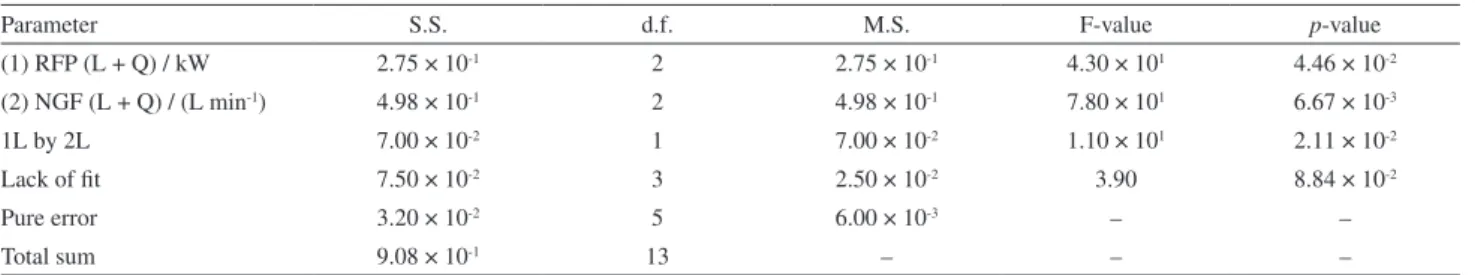
To evaluate the fitting of the model, the data analysis of variance (ANOVA) was applied. A summary of the ANOVA results is given in Table 3. The regression model was
significant for a 95% confidence level (Fcalculated2,11 = 10.34;
Ftabulated2,11 = 3.98; p-value = 2.96 × 10⁻³). The lack of fit
was evaluated through the F-test, wherein Fcalculated (3.90)
was less than Ftabulated (19.40), showing no lack of fit
(p-value = 8.84 × 10⁻²).40,41
The evaluation of the model was also done by correlation between the predicted values and obtained values and the results (Figure 2) show a good correlation
between the proposed experiments by the 32 factorial design
with two variables, expressed by correlation coefficient (r) equal to 0.96.
After statistical analysis, it was possible to attest that a better condition is achieved when there is a combination of
Figure 1. Pareto chart for the three level factorial design for two variables (effects of the RFP and NGF). L: Linear parameter; Q: quadratic parameter.
Table 3. ANOVA results obtained for the 32 factorial design
Parameter S.S. d.f. M.S. F-value p-value
(1) RFP (L + Q) / kW 2.75 × 10⁻¹ 2 2.75 × 10⁻¹ 4.30 × 101 4.46 × 10⁻²
(2) NGF (L + Q) / (L min-1) 4.98 × 10⁻¹ 2 4.98 × 10⁻¹ 7.80 × 101 6.67 × 10⁻³
1L by 2L 7.00 × 10⁻² 1 7.00 × 10⁻² 1.10 × 101 2.11 × 10⁻²
Lack of fit 7.50 × 10⁻² 3 2.50 × 10⁻² 3.90 8.84 × 10⁻²
Pure error 3.20 × 10⁻² 5 6.00 × 10⁻³ – –
Total sum 9.08 × 10⁻¹ 13 – – –
S.S.: Sum of squares; d.f.: degrees of freedom; M.S.: mean square; RFP: radiofrequency power; L: linear parameter; Q: quadratic paramenter; NGF: nebulizer gas flow.
RFP and NGF in high levels, especially for atoms and ions
with high energy excitation, as Th and U.42 The operating
conditions of the ICP OES were evaluated through the global response calculated from the sum of the responses regarding the intensities of Th and U, and Mg II/Mg I ratio (equation 1). The best overall response obtained was the
combination of the RFP of 1.4 kW and NGF of 1.0 L min-1,
but at these working conditions, higher power requires more frequent maintenance of the radiofrequency source and it causes an increased wear of the torch.
Therefore, the operating conditions adopted for this
work were RFP of 1.0 kW and NGF of 0.9 L min-1 at the
critical point, evaluated through the multiple response, since all values obtained were higher than 8.0 (Table 2), a clear indication of the robustness of the plasma because, at these conditions, an effective energy is transferred to analytes
running through the central channel of the plasma.33,42-44
Analytical parameters
Limits of detection and quantification
The limits of detection (LOD) and quantification (LOQ) were calculated by the background equivalent concentration (BEC) and the signal-to-background ratio (SBR), according to the International Union of Pure and Applied Chemistry (IUPAC): BEC = Cstandard / SBR, for SBR = (Istandard – Iblank) / Iblank;
Cstandard is the reference element concentration in the standard
solution, Istandard and Iblank are the emission intensities for the
reference element and blank solutions, respectively, at the
selected wavelength.45,46
The LOD was then calculated as (3 × RSDblank × BEC) / 100
and LOQ = (10 × RSDblank × BEC) / 100, where RSDblank
is the relative standard deviation of ten measurements of the emission intensity of the blank solution at the selected
wavelength.45,46 The LOD values were 0.6 to 0.8 µg g-1
for Th and U, respectively. The LOQ values were 2.2 and
2.5 µg g-1 for Th and U, respectively, as shown in Table 4.
The LOD and LOQ values obtained in this work for simultaneous determination of Th and U are comparable to those reported in the literature using separation and
preconcentration techniques.17,47-50 The analytical methods
using ICP-MS present LOD values better than those by
ICP OES technique (ng g-1 vs. µg g-1, respectively), but
ICP-MS is also susceptible to interference and is much more expensive.
Accuracy and precision
The accuracy of the method was evaluated by analysis of NIST SRMs 694 and 120c, and the found values compared with the certified values were in good agreement for U (Table 5), 89 ± 4 and 90 ± 10% (n = 3), respectively, calculated according to equation 2,
Agreement (%) = Found value × 100
Certified value (2)
in which the found value is the concentration obtained in the determination of the analytes by the method and the certified value is the one reported in the SRMs certification document. The precision, expressed as relative standard deviation (RSD), was better than 4.3% (n = 3) for analysis of the SRMs for uranium determination.
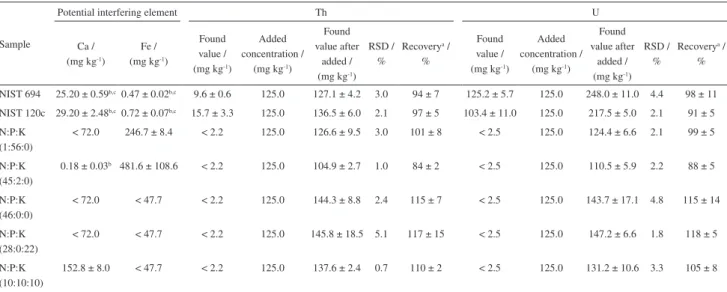
For Th, addition and recovery tests, using 125.0 mg kg-1
(or 1.0 mg L-1) of the analyte, were performed in NIST
SRMs 694 and 120c, and the recoveries were 94 ± 7 and 97 ± 5% (n = 3), respectively. The RSDs for addition and recovery tests for both elements were better than 3.0% for Th and 4.4% for U (Table 6). Recovery tests were performed since SRMs do not contain certified value for
Table 4. Values of background equivalent concentration (BEC), limits of detection (LOD) and quantification (LOQ) for simultaneous determination of Th and U by ICP OES
Parameter BEC / (µg L-1) LODa / (µg L-1) LOQa / (µg L-1) LODa / (mg kg-1) LOQa / (mg kg-1)
Th (401.913 nm) 13.0 5.0 18.0 0.6 2.2
U (385.957 nm) 15.0 6.0 20.0 0.8 2.5
aLimits established using 0.20 g of sample in a final volume of 25.0 mL. BEC: Background equivalent concentration; LOD: limit of detection; LOQ: limit of quantification.
Table 5. Certified values, found values, RSD and agreement between the values of U in standard reference materials (SRMs)
NIST SRM Certified value / % Found valuea / % RSD / % Agreementb / %
694 (as U) 0.01414 ± 0.00006 0.01252 ± 0.00057 1.8 89 ± 4
120c (as U3O8) 0.0135 ± 0.0002 0.0122 ± 0.0013 4.3 90 ± 10
Th, the sample matrices are highly complex due to the presence of several other elements and their composition is basically phosphate rocks, which are used as raw material in the manufacturing processes of fertilizers.
Application of optimized method
The optimized method was applied to five samples of commercial mineral fertilizers and the found concentrations of Th and U were lower than LOQ values. Thus, addition and recovery tests were also applied to these samples and the results obtained, using equation 3, ranged from 84 ± 2 to 117 ± 15% for Th and 88 ± 5 to 118 ± 5% for U (n = 3). These values are satisfactory considering a range
of 80-120%.51 The RSDs were better than 5.1% for Th
and better than 4.8% for U; these values are acceptable
for determination of trace elements,51 indicating the good
precision and accuracy of the analytical method (n = 3), as shown in Table 6.
Recovery (%) = [(found value after added – found value) /
added value) × 100] (3)
where found value after added is the measure of the concentration obtained for the analytes after adding them to the samples, the found value is a measure of the concentration obtained for the analytes without adding them to the sample, and the added value is the concentration of the analyte that was added.
In order to verify the presence of possible interferences caused by Ca and Fe, the concentrations of these elements were also determined in the mineral fertilizer samples and in the SRMs. When these elements are present in concentrations from < 72.0 to 29.20 ± 2.48% m/m for Ca and from < 47.7 to 0.72 ± 0.07% m/m for Fe, no significant differences were observed for the analytes when the results are compared with the recovery percentages obtained for the commercial samples and the SRMs. For mineral fertilizer samples, the concentrations of Th and U were below LOQs, as shown in Table 6.
The emission signals were obtained free of interferences. In Figure S1 (Supplementary Information) the uranium emission spectrum and the vicinity of the analytical ionic line at 385.957 nm for NIST SRM 694, which contains iron in the concentration of 0.47 ± 0.02% m/m, are shown. An emission spectrum and the vicinity of uranium at the same analytical ionic line for NIST SRM 694 containing Fe in the concentration of 0.47 ± 0.02% m/m with the
addition of 125.0 mg kg-1 (or 1.0 mg L-1) of Th and U were
also obtained, as shown in Figure S2. Finally, Figure S3
shows the emission spectrum of U (125.0 mg kg-1 or
1.0 mg L-1) in N:P:K fertilizer (45:2:0) sample and addition
of Th (125.0 mg kg-1 or 1.0 mg L-1) and presence of
Ca (0.18 ± 0.03% m/m) and Fe (481.6 ± 108.6 mg kg-1).
The results for the determination using the developed method are considered satisfactory and can be attributed to the use of the ionic lines of the elements. According
to Scott et al.52 no atomic line of uranium shows any
Table 6. Results of concentration values of the potential interfering elements, added and found, relative standard deviation and recovery for Th and U
Sample
Potential interfering element Th U
Ca / (mg kg-1)
Fe / (mg kg-1)
Found value / (mg kg-1)
Added concentration /
(mg kg-1)
Found value after
added / (mg kg-1)
RSD / %
Recoverya /
%
Found value / (mg kg-1)
Added concentration /
(mg kg-1)
Found value after
added / (mg kg-1)
RSD / %
Recoverya /
%
NIST 694 25.20 ± 0.59b,c0.47 ± 0.02b,c 9.6 ± 0.6 125.0 127.1 ± 4.2 3.0 94 ± 7 125.2 ± 5.7 125.0 248.0 ± 11.0 4.4 98 ± 11
NIST 120c 29.20 ± 2.48b,c0.72 ± 0.07b,c 15.7 ± 3.3 125.0 136.5 ± 6.0 2.1 97 ± 5 103.4 ± 11.0 125.0 217.5 ± 5.0 2.1 91 ± 5
N:P:K (1:56:0)
< 72.0 246.7 ± 8.4 < 2.2 125.0 126.6 ± 9.5 3.0 101 ± 8 < 2.5 125.0 124.4 ± 6.6 2.1 99 ± 5
N:P:K (45:2:0)
0.18 ± 0.03b 481.6 ± 108.6 < 2.2 125.0 104.9 ± 2.7 1.0 84 ± 2 < 2.5 125.0 110.5 ± 5.9 2.2 88 ± 5
N:P:K (46:0:0)
< 72.0 < 47.7 < 2.2 125.0 144.3 ± 8.8 2.4 115 ± 7 < 2.5 125.0 143.7 ± 17.1 4.8 115 ± 14
N:P:K (28:0:22)
< 72.0 < 47.7 < 2.2 125.0 145.8 ± 18.5 5.1 117 ± 15 < 2.5 125.0 147.2 ± 6.6 1.8 118 ± 5
N:P:K (10:10:10)
152.8 ± 8.0 < 47.7 < 2.2 125.0 137.6 ± 2.4 0.7 110 ± 2 < 2.5 125.0 131.2 ± 10.6 3.3 105 ± 8
aRecovery = [(found value after added – found value) / added concentration) × 100]; bconcentration expressed in % m/m; cresults expressed as concentration in % m/m of
CaO (NIST 694: found value = 35.3 ± 0.8%, certified value = 43.6 ± 0.4%, agreement = 81 ± 2%; NIST 120c: found value = 40.86 ± 3.47%, certified value = 48.02 ± 0.17%, agreement = 85 ± 7%) and Fe2O3 (NIST 694: found value = 0.67 ± 0.03%, certified value = 0.79 ± 0.06%, agreement = 85 ± 4%; NIST 120c: found value = 1.03 ± 0.10%,
appreciable intensity for the determination by ICP OES, but ionic lines may be employed.
The determinations of U were not significantly affected by the presence of possibly interfering elements as Th, Ca
and Fe present in mineral fertilizer samples. Fujino et al.53
reported that many rare earth elements and thorium may interfere in the determination of U when present in excess of 10× or more, and Ca, Fe, V and Zr also strongly affect
the emissions of U. Santos et al.29 demonstrated that calcium
causes suppression of the emission intensity for the lines
386.952 and 367.007 nm in concentrations of 10 mg L-1,
while the other three lines (385.957, 385.494 and 409.13 nm) are free of interferences. The same experiment was carried out to evaluate iron interferences and the results showed that,
under the conditions established (for at least 10 mg L-1 of
Fe), there is no interference in the emission intensity of U for the five lines. It also evaluated the effect of Al, Ba, Cd, Co, Cr, Fe, Mo, Ni, Sb, Pb, Sb, Zn and V on the determination of uranium and no influence was observed on the emission
intensity of U under the established conditions for five lines.29
To obtain correct measurements of the intensity of uranium emission, a wavelength suitable to provide good sensitivity and low interference caused by matrix effects was required to be chosen, as well as the spectral interferences caused by the overlapping of the analyte lines by other element lines, and also the presence of species more easily ionizable which can cause decrease of sensitivity. The use of a more adequate wavelength can also be evaluated by the limits of detection and background
equivalent concentration values.30 The values obtained for
these determinations were satisfactory since the ICP OES instrument used has a resolution of < 9 pm in the region ranging from ultraviolet to < 20 pm in the visible region, resulting in the minimization of the interferences.
Conclusions
The instrumental conditions of ICP OES with axial configuration have been optimized by applying a three-level factorial design with two variables and quintuplicate of central point, establishing a radiofrequency power of
1.0 kW and a nebulizer gas flow of 0.9 L min-1 as optimum
conditions for the determination of Th and U.
The optimized analytical method was applied successfully to the simultaneous determination of Th and U in commercial mineral fertilizer samples, where both element concentrations were below the limits of quantification obtained for the method in five samples.
The results for the determination obtained using the developed method are considered to be satisfactory and can be attributed to the use of the ionic lines for determination of
Th and U. Calcium and Fe were determined in the samples and the SRMs, but the concentrations are not significant as to affect the simultaneous determination of Th and U in mineral fertilizers. These determinations were satisfactory since the ICP OES instrument used has an adequate resolution, resulting in the minimization of the interferences.
Supplementary Information
Supplementary data are available free of charge at http://jbcs.sbq.org.br as PDF file.
Acknowledgements
The study was financially supported by Coordenação de Aperfeiçoamento de Pessoal de Nível Superior (CAPES), Conselho Nacional de Desenvolvimento Científico e Tecnológico (CNPq), Fundação de Amparo à Pesquisa do Estado de São Paulo (FAPESP), Fundação de Apoio à Pesquisa e Inovação Tecnológica do Estado de Sergipe (FAPITEC, Process No. 019.203.01713/2010-4) and Instituto Tecnológico e de Pesquisa do Estado de Sergipe (ITPS), which provided fellowships, financial support and infrastructure.
References
1. Chahuan, P.; Chauhan, R. P.; Gupta, M.; Microchem. J.2013, 106, 73.
2. Ma, L.; Feng, S.; Reidsma, P.; Qu, F.; Land Use Policy2014, 37, 52.
3. Bonano, G.; Ecotoxicol. Environ. Saf.2012, 80, 20.
4. El-Taher, A.; Althoyaib, S. S.; Appl. Radiat. Isot.2012, 70, 290. 5. Aydin, I.; Aydin, F.; Saydut, A.; Bakirdere, E. G.; Hamamci, C.;
Microchem. J.2010, 96, 247.
6. Jiao, W.; Chen, W.; Chang, A. C.; Page, A. L.; Environ. Pollut.
2012, 168, 44.
7. Jamali, M. K.; Kazi, T. G.; Arain, M. B.; Afridi, H. I.; Jalbani, N.; Kandhro, G. A.; Shah, A. Q.; Baig, J. A.; J. Hazard. Mater.
2009, 164, 1386.
8. Hee-Park, J.; Lamb, D.; Paneerselvam, P.; Choppala, G.; Bolan, N.; Chung, J. H.; J. Hazard. Mater.2011, 185, 549. 9. Kazy, S. K.; D’Souza, S. F.; Sar, P.; J. Hazard. Mater.2009,
163, 65.
10. Zhao, K.; Liu, X.; Xu, J.; Selim, H. M.; J. Hazard. Mater.2010, 181, 778.
11. Wetterland, J.; de Forges, A. C. R.; Nicoullaud, B.; Arrouays, D.; Soil Use Manage.2012, 28, 101.
13. El-Sheikh, A. H.; Al-Degs, Y. S.; Sweileh, J. A.; Said, A. J.; Talanta2013, 116, 482.
14. Maher, K.; Bargar, J. R.; Brown Jr., G. E.; Inorg. Chem.2013, 52, 3510.
15. Hosseini, M. S.; Hosseini-Bandegharaei, A.; J. Hazard. Mater.
2011, 190, 755.
16. Rosmaric, M.; Ivsic, A. G.; Grahek, Z.; Talanta2009, 80, 352. 17. Yousefi, S. R.; Ahmadi, S. J.; Shemirani, F.; Jamali, M. R.;
Niasari, M. S.; Talanta2009, 80, 212.
18. Daneshvar, G.; Jabbari, A.; Yamini, Y.; Paki, D.; J. Anal. Chem.
2009, 64, 602.
19. Rahmani-Sani, A.; Hosseini-Bandegharaei, A.; Hosseini, S. H.; Kharghani, K.; Zarei, H.; Rastegar, A.; J. Hazard. Mater.2015, 286, 152.
20. Agriculture and Agri-Food Canada; Guidelines to the Fertilizers Act and Regulations, 2nd ed.; Plant Health and Production
Division: Ottawa, 1996.
21. Environmental Protection Agency (EPA); Fed. Regist.2002, 67, 48393.
22. Ministério da Agricultura, Pecuária e Abastecimento (MAPA); Normative Instruction No. 27, June 5, 2006.
23. Krejcova, A.; Cernohorsky, T.; Pouzar, M.; Int. J. Environ. Anal. Chem.2012, 92, 620.
24. Avivar, J.; Ferrer, L.; Casas, M.; Cerda, V.; J. Anal. At. Spectrom.
2012, 27, 327.
25. Hao, L. C.; Tao, C. V.; Dong, N. V.; Kerntechnik2011, 76, 285. 26. Zoriy, P.; Ostapczuk, P.; Dederichs, H.; Hobig, J.; Lennartz, R.;
Zoriy, M.; J. Environ. Radioact.2010, 101, 414.
27. Abdul-Hadi, A.; Al-Qadhi, W.; El-Zeen, E.; J. Radioanal. Nucl. Chem.2011, 290, 261.
28. Guiné, M. F.; Inductively Coupled Plasma Optical Emission Spectrometry; CENA/USP: Piracicaba, 1998.
29. Santos, J. S.; Teixeira, L. S. G.; Araujo, R. G. O.; Fernandes, A. P.; Korn, M. G. A.; Ferreira, S. L. C.; Talanta2011, 97, 113. 30. Santos, J. S.; Teixeira, L. S. G.; dos Santos, W. N. L.; Lemos,
V. A.; Godoy, J. M.; Ferreira, S. L. C.; Anal. Chim. Acta2010, 674, 143.
31. Mosqueda, Y.; Pomares, M.; Cappe, E. L. P.; Miranda, A.; Fariñas, J. C.; Larrea, M. T.; Anal. Bioanal. Chem.2006, 386, 1855.
32. Schiavo, D.; Trevizan, L. C.; Pereira-Filho, E. R.; Nóbrega, J. A.; Spectrochim. Acta, Part B2009, 64, 544.
33. Guimarães-Silva, A. K.; de Lena, J. C.; Froes, R. E. S.; Costa, L. M.; Nascentes, C. C.; J. Braz. Chem. Soc.2012, 23, 753. 34. Benzo, Z.; Maldonado, D.; Chirinos, J.; Marcano, E.;
Gómez, C.; Quintal, M.; Salas, J.; Microchem. J.2009, 93, 127.
35. Bizzi, C. A.; Barin, J. S.; Garcia, E. E.; Nóbrega, J. A.; Dressler, V. L.; Flores, E. M. M.; Spectrochim. Acta, Part B2011, 66, 394.
36. Dantas, A. N. S.; Matos, W. O.; Gouveia, S. T.; Lopes, G. S.; Talanta2013, 107, 292.
37. Souza, S. O.; da Costa, S. S. L.; Santos, D. M.; Pinto, J. S.; Garcia, C. A. B.; Alves, J. P. H.; Araujo, R. G. O.; Spectrochim. Acta, Part B2014, 96, 1.
38. Hoenig, M.; Talanta2001, 54, 1021.
39. Krug, F. J.; Métodos de Preparo de Amostras: Fundamentos sobre Preparo de Amostras Orgânicas e Inorgânicas para
Análise Elementar, 1ª ed.; CENA/USP: Piracicaba, 2010. 40. Barros Neto, B.; Scarminio, I. S.; Bruns, R. E.; Como Fazer
Experimentos: Pesquisa e Desenvolvimento na Ciência e na
Indústria, 3a ed.; Editora da Unicamp: Campinas, 2003.
41. Bezerra, M. A.; Santelli, R. E.; Oliveira, E. P.; Villar, L. S.; Escaleira, L. A.; Talanta2008, 76, 965.
42. Montaser, A.; Inductively Coupled Plasma Mass Spectrometry; Wiley-VCH: New York, 1998.
43. Mermet, J. M.; Poussel, E.; Appl. Spectrosc. 1995, 49, 12. 44. Trevizan, L. C.; Nóbrega, J. A.; J. Braz. Chem. Soc.2007, 14,
678.
45. Froes, R. E. S.; Borges Neto, W.; Naveira, R. L. P.; Silva, N. C.; Nascentes, C. C.; Silva, J. B. B.; Microchem. J.2009, 92, 68. 46. IUPAC Analytical Chemistry Division; Spectrochim. Acta, Part
B1978, 33, 247.
47. Godoy, M. L. D. P.; Godoy, J. M.; Kowsmann, R.; dos Santos, G. M.; da Cruz, R. P.; J. Environ. Radioact.2006, 88, 109. 48. Shinotsuka, K.; Ebihara, M.; Anal. Chim. Acta1997, 338, 237. 49. Kamata, E.; Nakashima, R.; Furukawa, M.; J. Anal. At.
Spectrom.1987, 2, 321.
50. Aydin, F. A.; Soylak, M.; Talanta2007, 72, 187.
51. ISO Guide 5725-1: Accuracy (Trueness and Precision) of Measurement Methods and Results. Part 1: General Principles
and Definitions, ISO: Geneva, 1994.
52. Scott, R. H.; Strasheim, A.; Kokot, M. L.; Anal. Chim. Acta
1976, 82, 67.
53. Fujino, O.; Umetani, S.; Ueno, E.; Shigeta, K.; Matsuda, T.; Anal. Chim. Acta 2000, 420, 65.
Submitted: August 25, 2015
Published online: November 24, 2015