0584-8547/02/$ - see front matter䊚2002 Elsevier Science B.V. All rights reserved. PII: S 0 5 8 4 - 8 5 4 7Ž0 2.0 0 1 7 6 - 3
Evaluation of inductively coupled plasma optical emission
spectrometers with axially and radially viewed configurations
夞
Fernando V. Silva , Lilian C. Trevizan , Cıntia S. Silva , Ana Rita A. Nogueira ,
a,b a´
a bJoaquim A. Nobrega *
´
a,Grupo de Analise Instrumental Aplicada, Departamento de Quımica, Universidade Federal de Sao Carlos, Caixa Postal 676,
a ´ ´ ˜
13560-970 Sao Carlos, SP, Brazil Embrapa Pecuaria Sudeste, Sao Carlos, SP, Brazil
b ´
Received 14 May 2002; accepted 27 August 2002
Abstract
The analytical performance of two inductively coupled plasma optical emission spectrometers with axially and radially viewed configurations, equipped with charge coupled device solid-state detectors was evaluated using Ar, Ba, Mg, and Ni as test elements. Both instruments have similar Echelle optical arrangements and radio-frequency generators, differing only in the viewing mode and in the diameter of the central injector tube, i.e. 2.3 for the axially and 1.4 mm for the radially viewed ICP. The figures of merit evaluated were: warm-up time, short- and long-term stabilities, UV and VIS spectral resolution and limit of detection (LOD) for Ni in 0.14 molly1 HNO and 1000
3
mg ly1 Cr media, respectively. The influence of residual carbon content on background equivalent concentration
(BEC)and sensitivity attained for Al, As, Ca, Cd, Co, Cr, Cu, Fe, Mg, Mn, Se and Zn was also investigated in both viewing modes. The robustness, short- and long-term stabilities, and UV and VIS spectral resolutions were similar for both configurations. For the radially viewed equipment, the warm-up time was at least a factor of 2 shorter than that for the axially viewed configuration. On the other hand, the sensitivity attained for Ni with the axially viewed arrangement was approximately 20 times better than that with the radially viewed. In both viewing modes, and for most of the evaluated elements, the values of BEC and LOD were similar for all studied carbon concentrations(from 10 to 10 000 mg lCy1 )when working with robust plasma conditions. The Mg IIyMg I ratio at an applied power of 1.3 kW and a nebulizer gas flow-rate of 0.90 and 0.70 l miny1 for axially and radially viewed configurations were 10.6 and 13.7, respectively. Quantitative determinations were successfully performed using both systems.
䊚2002 Elsevier Science B.V. All rights reserved.
Keywords: Figures of merit; Axialviewing; Radialviewing; ICP OES
夞This paper was presented at the 7th Rio Symposium on Atomic Spectrometry, held in Florianopolis, Brazil, April 2002 and is´ published in the Special Issue ofSpectrochimica Acta Part B, dedicated to that conference.
1. Introduction
Inductively coupled plasma optical emission spectrometry (ICP OES) is a well established method for multielemental analysis. This method had a rebirth in the last decade due to the devel-opment of equipments with axially viewed config-uration and solid-state detectors that improved flexibility and sensitivityw1x. The incorporation of segmented charged device or charge coupled device (CCD) solid-state detectors enabled to reach spectral resolution, linear response range and simultaneous reading of a wide range of electro-magnetic spectrum, required by an ICP OES. The use of this kind of detector became possible after development of new materials in the semi-conduc-tors technology w2,3x. The idea of axially viewed measurements was proposed in the 1970s w4x, however, in spite of an improvement in sensitivity, the system performance was degraded due to increased interferences. After two decades this proposal becomes viable due to the development of proper interface systems based on shear gas or end-on gas w1x. However, common sense in this area still recommends ICP OES with axially viewed configuration for applications requiring better sensitivity, but without a complex matrix. For samples with complex matrices, the best option appears to be to use an ICP OES with radially viewed configuration. This generalopinion needs a more critical evaluation. Dubuisson et al. w5x showed that neither the effect caused by easily ionizable elements, nor the gain in sensitivity was so impressive in an ICP OES with axially viewed configuration. These authors employed three ICP OES systems with different configurations. Ivaldi and Tyson w6x presented similar conclusions and pointed out that an axially viewed plasma might be successfully used when lower detection limits are desired, but reduced plasma robustness could be a problem.
In a recent comprehensive review, Brenner and Zander w1x pointed out that the interfaces used in ICP OES with axially viewed configuration should be critically compared to gain better understanding of the performance of each arrangement. Similarly, ICP OES with the same opticalarrangement and solid-state detector, but with different torch
posi-tions should also be compared to generate critical data about the performance of each system. The work here described dealt with this evaluation using plasma diagnostics according experiments proposed by Mermet w7x, Pousselet al.w8x, and Mermet and Pousselw9x.
2. Experimental
2.1. Instrumentation
meas-Table 1
Characteristics of Vista AX and RL ICP OES
Characteristic Vista AX and RL
Generator frequency 40 MHz
Optical sytem
Polycromator Echelle-gratingqCaF cross dispersing prism2
Grating density groove 95 grooves mmy1
Focallength 400 mm
Entrance slit Heights0.029 mm and widths0.051 mm
Sample introduction system
Nebulizer Concentric
Spray chamber Cyclonic
Detector Peltier cooled CCD
70 908 pixels spread across 70 non-linear arrays Wavelength ranges167–785 nm
Torch injector tube diameter 2.3(axially viewed)and 1.4 mm(radially viewed)
Table 2
Operational parameters used in axially and radially viewed ICP OES
Operationalparameter
RF power(kW) 1.2
Plasma gas-flow rate(lminy1)
15.0 Auxiliary gas-flow rate(lminy1) 1.5
Nebulizer gas-flow rate(lminy1) 0.8
Sample flow-rate(mlminy1) 0.8
Observation height(mm)a 13
Emission lines(nm) AlI 396.152 Cr II 267.716
Ar I 404.442 Cu I 324.760
Ar I 404.597 Fe II 238.204
As I 188.980 Mg II 280.264
Ba II 230.424 Mg I 285.208
Ba II 455.403 Mn II 257.610
Ca II 317.937 Ni II 231.604
Cd II 226.502 Se I 196.026
Co II 228.619 Zn II 206.204
Only for radially viewed configuration. a
urements were performed using two pixels for each wavelength.
Microwave-assisted acid digestion of two certi-fied reference materials was performed using a cavity-type oven (ETHOS 1600, Milestone, Sori-sole, Italy) equipped with ten closed perfluoral-koxy Teflon vessels with pressure relief mechanism. The power applied was controlled by monitoring the temperature in a single vessel using a fiber opticalsensor.
2.2. Solutions
Table 3
Summary of diagnostic procedure used for evaluation of axially- and radially-viewed ICP OESw5–7x
Figure of merit Parameter
UV spectral resolution Profile of Ba II 230 nm line VIS spectral resolution Profile of Ba II 455 nm line
Robustness Mg II 280yMg I 285 nm ratio
Short-term stability R.S.D. for Mg I 285 nm emission signal(ns15)
Long-term stability R.S.D. for Mg I 285 nm emission signal(ns8;ts2 h)
Sensitivity LOD for Ni II 231 nm line
Warm-up time R.S.D. for Ar, Ba and Mg emission signals
Table 4
Heating program used to perform closed-vessel microwave-assisted acid digestions
Step Time(min) Power(W) T(8C)
1 2.0 250 100
2 2.0 0 100
3 5.0 250 120
4 4.5 400 180
5 4.5 650 220
A sixth step was implemented to perform 5 min of ventila-tion without heating.
10 mg lNi in 1000 mg lCr medium andy1 y1 multielement solutions containing 20 mg ly1 of Al, As, Ca, Cd, Co, Cr, Cu, Fe, Mg, Mn, Se and Zn in 10, 100, 1000 and 10 000 mg lC medium,y1 respectively, were employed. All solutions were prepared by suitable dilution of 1000 or 5000 mg ly1 stock solutions of each element (Spex Sample Preparation, Metuchen, NJ) with Milli-Q䉸distilled and deionized water (Millipore, Bed-ford, MA) and sub-boiling distilled nitric acid
(Milestone). Urea(CH N O, Reagen, Brazil4 2 ) was used as carbon source for investigation of residual carbon content effects on sensitivity. The use of this compound was based on a previously described study w10x.
An analytical curve—Blank: 0.14 mol ly1 of HNO ; Reference Solution 1: 2.0 mg ly1 of Cu,
3
Fe, Mn and Znq20 mg lMgy1 q50 mg lCa,y1 and Reference Solution 2: 4.0 mg ly1 of Cu, Fe, Mn and Znq40 mg lMgy1 q100 mg lCa—y1 was used to assess the precision and accuracy of measurements performed in both axially and radi-ally viewed configurations.
2.3. Procedure
Diagnostic tests performed were based on exper-iments proposed by Mermetw7x, Pousselet al.w8x and Mermet and Poussel w9x and they are sum-marized in Table 3.
The background equivalent concentration
(BEC) and LOD were calculated according to IUPAC w11x.
Crs IrsyIblank
BECs , SBRs ,
SBR Iblank
3=BEC=R.S.D. LODs
100
where, Crs, concentration of multielemental refer-ence solution (20 mg ly1); SBR, signal-to-back-ground ratio; IrsandIblank, emission intensities for multielemental reference and blank solutions, respectively, and R.S.D., relative standard devia-tion for 10 measurements of blank soludevia-tion.
2.4. Sample preparation
A mass of 250 mg of two certified reference materials, NIST 1577b Bovine liver and NIST 1515 Apple leaves(NationalInstitute of Standards and Technology, Gaithersburg, MD), was digested using 2 ml of concentrated sub-boiling distilled HNO plus 1 ml of H O 30% v3 2 2 yv. The heating program used is shown in Table 4.
3. Results and discussion
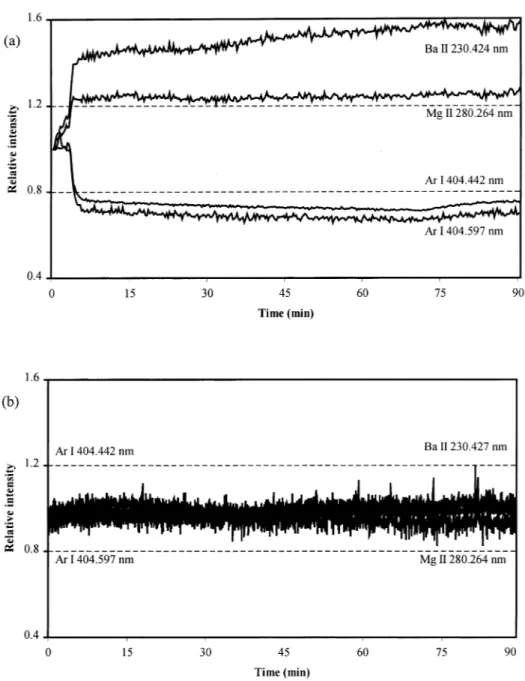
Fig. 1. Warm-up time for axially and radially viewed ICP OES.(a)Axially and(b)radially viewed configurations.
404.597 nm, Ba II 230.424 nm and Mg II 280.264 nm were used for evaluation of warm-up time. The relative intensity observed for both equipment used is shown in Fig. 1.
In the ICP OES with axially viewed configura-tion, a high variation of emission signals was observed during the initial5 min. Ar I emission
Table 5
Emission intensities and Mg IIyMg I ratios for axially and radially viewed configurations
Configuration Mg I 285.208 nm Mg II 280.265 nm Mg IIyMg Ia
Axially viewed 151 075 890 419 10.6
Radially viewed 2643 20 139 13.7
Multiplied by 1.8 according to Ref.w12x. a
Table 6
LOD and BEC for Ni II (231.604 nm) in 0.14 mol ly1 HNO and 1000 mg ly1 of Cr media for axially and radially viewed 3
configurations
Sample medium Axially viewed Radially viewed
BEC(mg ly1) LOD(mg ly1) BEC(mg ly1) LOD(mg ly1) 0.14 molly1HNO
3 11 0.23 301 3.8
1000 mg lof Cry1 4 0.31 741 7.6
and 10 min, respectively. These times were estab-lished by considering emission intensity deviations less than 5%.
The short-term stability was determined by per-forming 15 consecutive measurements of emission intensity at the Mg II 280.265 nm line. For axially and radially viewed configurations, R.S.D. were 0.70 and 0.60%, respectively. When the emission signalwas monitored during a 2-h period (ns8, i.e. measurements at time intervals of 15 min), R.S.D. observed for radially and axially viewed configurations were 1.5 and 1.4%, respectively.
The Mg IIyMg I ratio is a practicalcriterion to evaluate plasma robustness and analytical perform-ance. The term robustness was proposed to repre-sent the efficiency of energy transfer and response of the plasma to changes in atomization and excitation conditions and chemicalcomposition of the aspirated solution w7x. This experiment was made by applying a radio-frequency power of 1.3 kW in both ICP, and afterwards by adjusting the nebulizer gas flow-rate in each one to reach the highest Mg IIyMg I ratio. This parameter was set at 0.90 and 0.70 l miny1 for axially and radially viewed ICP OES, respectively. The obtained ratios were multiplied by 1.8 to correct response inten-sities taking into account the use of an Echelle grating and a solid-state detector. This value was previously established by Dennaud et al.w12x, also working with a Vista ICP; according to these
authors this value can vary from 1.5 to 1.8. As expected, the results showed a higher Mg IIyMg I ratio for the radially viewed configuration (Table 5). The elevated ratios obtained indicate that both instruments were operated at robust conditionsw1x. It should also be mentioned that robust conditions are effective to alleviate matrix effects but the sensitivity is slightly degradedw6x.
Spectral resolution was similar in both Echelle polychromators. Using Ba II 230.424 and Ba II 455.403 nm emission lines, spectral resolution values of 8 and 30 pm were measured, respectively. It should be mentioned that the selected Ba lines are positioned at the center of the order in the CCD detector that is characterized by a better resolution.
LOD in each configuration were evaluated using Ni II 231.604 nm line. The LODs were calculated based on BEC. The effect of matrix on the LODs was evaluated determining this parameter in 0.14 molly1HNO and 1000 mg ly1Cr media. Results
3
Table 7
LOD and BEC for Al, As, Ca, Cd, Co, Cr, Cu, Fe, Mg, Mn, Se and Zn in solutions containing different carbon concentrations in axially viewed ICP OES
Element Carbon concentration(mg ly1)
0.14 molly1 HNO3
10 100 1000 10 000
BEC LOD BEC LOD BEC LOD BEC LOD BEC LOD
AlI 396.152 0.11 0.072 0.12 0.077 0.11 0.073 0.11 0.074 0.13 0.086
As I 188.980 2.2 2.4 2.4 2.6 2.3 2.5 2.3 2.5 2.5 2.7
Ca II 317.937 0.091 0.067 0.097 0.071 0.091 0.067 0.092 0.067 0.097 0.071
Cd II 226.502 0.34 0.40 0.36 0.44 0.34 0.41 0.35 0.42 0.38 0.46
Co II 228.619 0.73 0.84 0.78 0.90 0.74 0.85 0.74 0.86 0.79 0.91
Cr II 267.716 0.18 0.28 0.19 0.30 0.18 0.29 0.18 0.29 0.19 0.30
Cu I 324.760 0.064 0.048 0.069 0.051 0.065 0.048 0.064 0.048 0.068 0.051
Fe II 238.204 0.45 0.54 0.48 0.59 0.46 0.56 0.46 0.56 0.49 0.60
Mg II 280.264 0.022 0.039 0.024 0.041 0.023 0.039 0.023 0.039 0.024 0.042 Mn II 257.610 0.038 0.082 0.040 0.087 0.038 0.082 0.038 0.083 0.040 0.087
Se I 196.026 4.8 4.2 5.3 4.7 5.0 4.5 5.2 4.6 5.6 5.0
Zn II 206.204 0.42 0.22 0.45 0.24 0.42 0.22 0.43 0.23 0.47 0.25
Values of BEC and LOD are expressed inmg l .y1
Table 8
LOD and BEC for Al, As, Ca, Cd, Co, Cr, Cu, Fe, Mg, Mn, Se and Zn in solutions containing different carbon concentrations in radially viewed ICP OES
Element Carbon concentration(mg ly1)
0.14 molly1 HNO3
10 100 1000 10 000
BEC LOD BEC LOD BEC LOD BEC LOD BEC LOD
AlI 396.152 8.6 5.2 8.9 5.4 8.4 5.1 8.3 5.0 9.5 5.7
As I 188.980 40 98 40 98 37 92 37 89 37 90
Ca II 317.937 10 9.8 11 10 10 9.5 9.9 9.5 11 10
Cd II 226.502 19 26 18 23 17 22 16 21 18 23
Co II 228.619 27 34 26 32 25 31 24 30 26 32
Cr II 267.716 34 30 31 28 29 26 29 25 29 26
Cu I 324.760 4.3 1.9 4.4 2.0 4.2 1.9 4.2 1.8 4.3 1.9
Fe II 238.204 16 14 14 13 13 12 13 12 14 13
Mg II 280.264 0.50 0.79 0.50 0.80 0.47 0.75 0.47 0.75 0.48 0.77
Mn II 257.610 4.2 2.8 4.2 2.8 3.9 2.7 3.9 2.6 4.0 2.7
Se I 196.026 66 148 63 142 60 135 57 127 49 111
Zn II 206.204 17 37 17 37 16 35 16 35 17 38
Values of BEC and LOD are expressed inmg l .y1 in the radially viewed configuration. These results seem to indicate that the end-on gas interface used to eliminate the plasma tail recombination zone in the axially viewed configuration was efficient. The performance of the end-on gas interface can even proportionate lower matrix interferences in axially viewed compared to the radially viewed
configu-ration, as recently demonstrated for Dy, Eu and Yb determination in sheep faeces w13x. Results obtained for the influence of the carbon content on the sensitivity of measurements also confirms this observation(Tables 7 and 8).
Table 9
Results for Ca, Cu, Fe, Mg, Mn and Zn determination based on dry matter, using axially and radially viewed ICP OES
Sample Ca(% m my1) Cu(mg kgy1) Fe(mg kgy1) Mg(% mg kgy1) Mn(mg kgy1) Zn(mg kgy1) NIST 1577b Bovine liver
Axially viewed 146a"12
142"1 164"4 546"5 7.20"0.58 114"1 Radially viewed 107"5 148"1 156"4 523"4 9.14"0.75 110"3 Certified value 116"4 160"8 184"15 601"28 10.5"0.17 127"16
NIST 1515 Apple leaves
Axially viewed 1.32"0.06 4.98"0.23 61.9"1.4 0.241a"0.010 44.5"1.1 10.9"0.3 Radially viewed 1.46"0.03 6.14"0.06 66.5"4.3 0.247"0.003 48.5"2.5 19.6"2.7 Certified value 1.526"0.015 5.64"0.24 (80)b 0.271"0.008 54"3 12.5"0.3
Concentration expressed in mg kg for Ca and % m m for Mg.
a y1 y1
Estimated value. b
when the carbon concentration of a multielement solution varied from 10 to 10 000 mg ly1. In general, the deviation of results was less than 15%. The suitable performance presented by this config-uration can be associated to the efficiency of the end-on gas interface to eliminate the plasma tail recombination zone. The increase of carbon con-centration could produce non-specific emission and deteriorate the power of detection due to the increase of background radiation (BEC). It is expected that this drawback could be more pro-nounced for the axially viewed configuration. However, this undesirable effect was not observed in the evaluated carbon concentration range using the ICP OES with an end-on gas interface. Similar behavior was observed using radially viewed figuration when operating the ICP at robust con-ditions. In this case the presence of carbon in multielement solutions only affected the BEC and LOD for Se I 196.025 nm, for which a variation approximately 30% was observed over the carbon concentration range evaluated. The matrix effect caused by residualcarbon on ICP OES measure-ments of Se was previously described by Knapp et al. w14x, and it can also cause problems in inductively coupled plasma mass spectrometry w15,16x.
Recovery experiments were performed using both instruments to assess the accuracy and pre-cision of measurements. All results for Ca, Cu, Fe, Mg, Mn and Zn were in agreement with certified values at a 95% confidence level(Table 9). Other elements, such as Al, As, Cd, Co, Cr and Se, were
not determined because their concentration in digestates were below the detection limit, even when using ICP OES with axially viewed configuration.
4. Conclusion
Axially and radially viewed configurations pre-sented similar figures of merit. Despite differences in warm-up time and LODs, analytical perform-ance of both configurations was not significantly compromised. It can be inferred that quantitative determinations can be carried out with suitable precision and accuracy using any viewing config-uration. Taking into account the obtained results, the axially viewed configuration presented higher detection power than that achieved by the radially viewed configuration, independent of the complex-ity of the sample medium. In spite of some particularities, such as the longer warm-up time observed for the axially-viewed configuration, it could be supposed that the efficiency of the end-on gas interface improved the performance of this arrangement. It can also be supposed that most applications could perfectly be performed using an ICP OES with this arrangement without any seri-ous degradation of analytical performance, as pre-viously suggested by Brenner and Zanderw1x.
Acknowledgments
support provided(Process 98y10814-3). F.V. Silva, L.C. Trevizan, and C.S. Silva are also grateful to FAPESP and CNPq, respectively, for fellowships provided. A.R.A. Nogueira and J.A. Nobrega are´ thankfulto CNPq for research scholarships provided.
References
w1x I.B. Brenner, A.T. Zander, Axially and radially viewed inductively coupled plasmas—a critical review, Spectro-chim. Acta Part B 55(2000)1195–1240.
w2x T.W. Barnard, M.I. Crockett, J.C. Ivaldi, P.L. Lundberg, D.A. Yates, P.A. Levine, D.J. Sauer, Solid-state detector for ICP-OES, Anal. Chem. 65(1993)1231–1239.
w3x S. de Goy, D. Lanzisera, K. Lopez, J. Noonam, J. Rebello, Which CCD detector is right for you?, Spec-troscopy 13(1998)36–41.
w4x M.H. Abdallah, R. Diemiaszonek, J. Jarosz, J.M. Mer-met, J. Robin, C. Trassy, Spectrometric study on radio-frequency induced plasma. 1. Analytical performance, Anal. Chim. Acta 84(1976)271–282.
w5x C. Dubuisson, E. Poussel, J.M. Mermet, Comparison of axially and radially viewed inductively coupled plasma atomic emission spectrometry in terms of signal-to-background ratio and matrix effects, J. Anal. At. Spec-trom. 12(1997)281–286.
w6x J.C. Ivaldi, J.F. Tyson, Performance evaluation of an axially-viewed horizontal inductively coupled plasma for opticalemission spectrometry, Spectrochim. Acta Part B 50(1995)1207–1226.
w7x J.M. Mermet, Use of magnesium as a test element for inductively coupled plasma atomic emission spectrom-etry diagnostics, Anal. Chim. Acta 250(1991)85–94.
w8x E. Poussel, J.M. Mermet, O. Samuel, Simple experi-ments for the control, the evaluation and the diagnosis
of inductively coupled plasma sequential systems, Spec-trochim. Acta Part B 48(1993)743–755.
w9x J.M. Mermet, E. Poussel, ICP emission spectrometers: analytical figures of merit, Appl. Spectrosc. 49(1995)
12–18.
w10x S.T. Gouveia, F.V. Silva, L.M. Costa, A.R.A. Nogueira, J.A. Nobrega, Determination of residualcarbon by´ inductively-coupled plasma optical emission spectrom-etry with axialand radialview configurations, Anal. Chim. Acta 445(2001)269–275.
w11x IUPAC, Analytical Chemistry Division, Commission on Spectrochemicaland OpticalProcedures for Analysis, Nomenclature, symbols, units and their usage in spec-trochemicalanalysis-II. Data interpretation, Spectro-chim. Acta Part B 33(1978)242–245.
w12x J. Dennaud, A. Howes, E. Poussel, J.M. Mermet, Study of ionic-to-atomic line intensity ratios for two axial viewing-based inductively coupled plasma atomic emis-sion spectrometers, Spectrochim. Acta Part B 56(2001)
101–112.
w13x E.E. Garcia, A.R.A. Nogueira, J.A. Nobrega, Matrix´ effects on the determination of dysprosium, europium and ytterbium used as animalfaecalmarkers by induc-tively coupled plasma optical emission spectrometry with axially- and radially-viewed configurations, J. Anal. At. Spectrom. 16(2001)825–830.
w14x G. Knapp, B. Maichin, U. Baumgartner, Interferences in ICP-OES by organic residue after microwave-assisted sample digestion, At. Spectroc. 19(1998)220–222.
w15x P. Allain, L. Jaunault, Y. Mauras, J.M. Mermet, T. Delaporte, Signal enhancement of elements due to presence of carbon-containing compounds in inductively coupled plasma mass spectrometry, Anal. Chem. 63
(1991)1497–1498.