Rev Saúde Pública 2005;39(4) www.fsp.usp.br/rsp
INTRODUCTION
In Brazil, the Ministry of Health has been responsi-ble for Indigenous health care by means of the
imple-mentation of Sistemas Locais de Saúde [Local Health
Systems] denominated Distritos Sanitários Especiais
Indígenas (DSEI), [Special Indigenous Sanitary
Dis-D imensions and potentialities of the
geographic information system on indigenous
health
Luiza Garneloa, Luiz Carlos Brandãob and Antônio Levinoa
aCentro de Pesquisas Leônidas & Maria Deane. Fundação Instituto Oswaldo Cruz. Manaus, AM,
Brasil. bNúcleo de Estudos de Saúde Pública. Universidade Federal do Amazonas. Manaus, AM, Brasil
Correspondence to:
Luiza Garnelo
Rua Teresina, 476 Adrianópolis 69057-070Manaus, AM, Brasil E-mail: [email protected]
Paper presented at the VII Congresso Brasileiro de Saúde Coletiva [VIIth Brazilian Congress in Collective Health], Brasília, DF, Julho 2003.
Research was conducted at the Centro de Pesquisas Leônidas e Maria Deane [Leônidas e Maria Deane Research Center] (Fiocruz) and the Núcleo de Estudos de Saúde Pública, Universidade Federal do Amazonas [Nucleus of Public Health Studies of the Federal University of Amazonas].
Received on 23/3/2004. Reviewed on 22/2/2005. Approved on 17/3/2005.
Keywords
Indians, South American. Geographic information systems. Tuberculosis. Malaria. Infant mortality.
Abstract
Objective
To discuss the potentials of the Geographic Information System in the analysis of the epidemiological and socio-demographic profiles of indigenous peoples and of the organization of health services directed towards their care.
Methods
Geoprocessing analysis of tuberculosis, malaria and mortality notification of 374,123 indigenous people distributed in 36 Distritos Sanitários Especiais Indígenas (Special Indigenous Sanitary Districts) in Brazil was conducted. A gradient of risk intensity for tuberculosis, malaria, and infant mortality among indigenous populations was defined for the years 2000 to 2002. These coefficients were then compared with those of non-indigenous populations, during the same period.
Results
The analysis showed that the previous available data are fragmentary and do not allow for a comprehensive assessment of life conditions and health situations of these ethnic groups. The construction of gradients of risk indicated incidence of tuberculosis coefficients among the indigenous population more than 1,000 times greater than those found among the general population in Brazil. The mean malaria API among the indigenous population was up to 10 times greater than the mean values found among the non-indigenous population and the coefficient of infant mortality among the indigenous population varied from 74.7/1,000 live births in 2000 to 56.5/1,000 live births in 2001, exceeding the national average (31.8/1,000) for the same period in more than 100%.
Conclusions
The Geographic Information System is a useful administrative tool for assessing health conditions, evaluating population risks, constructing scenarios, and planning intervention strategies in several levels, shifting quickly and efficiently between macro-and micro-level realities.
tricts]. Thirty-four districts are in activity and are re-sponsible for caring for the health of an indigenous population, living within Native Brazilian villages, estimated in 374,123 people and distributed among 3,225 villages in the diverse federated units of the
country.6 These activities constitute a subsystem
Rev Saúde Pública 2005;39(4) www.fsp.usp.br/rsp
GIS in indigenous health Garnelo L et al
*According to the IBGE localities are divided hierarquically in: Federal Capitals, Capitals, Cities (Municipal seats), Villages, Urban Áreas, Isolated Urban Áreas and Rural Agglomerations. Indigenous villages are classified as an isolated Rural Agglomeration subtype. However, this type of classification is not congruent with the living arrangements found in indigenous areas.
health services and disorders among the Kaingang In-dians in the State of Rio Grande do Sul.
Funasa has suggested the use of the Sistema de
In-formações de Localidades(SISLOC) for ruralareas, which also presents problems of congruence in rela-tion to other data banks such as the IBGE. This oc-curs because this Institute adopts a standardized con-cept of classification of the locality,* based on po-litical and administrative criteria that are distinct from those adopted by the SISLOC.
If within the municipal scales and at the local level the lack of cartographic bases and the low degree of confidence or even the lack of data make it difficult to develop analysis base on geoprocessing,1 an additional
problem arises with respect to the DSEI. That is, the need to define a more appropriate unit of analysis that contemplates characteristics of the indigenous uni-verse, which is not possible with the Cadastro de
Lo-gradouros [Census of Public Addresses] of the IBGE or of the SISLOC itself. In both cases, the official forms
of geographic reconnaissance of the indigenous
vil-lages, communities, or areas are incompatible with the characteristics of mobility or the populations’ patterns of settlement. The lack of information concerning the perimeter of the villages also makes it difficult to rep-resent them as polygons and to appropriately express morbid events on thematic maps.
Within this context, the present article attempts to contribute towards research on the health of indigenous populations, by discussing the potentialities of geo-processing. The latter is considered as a means for mak-ing socio-demographic analysis, as well as analysis of the organization of services and of the epidemiological profile of Brazilian ethnic groups by the indigenous health subsystem viable. Towards this end, the DSEI was considered the point of departure, being adopted as a unit of analysis, both when focusing on particular situ-ations that express inequities within districts, and when using it as a reference while studying micro-realities such as the case of the Rio Negro DSEI in which the analysis of the distribution of deaths within a specific ethnic group according to village and clan is conducted.
M ETH O D S
Geoprocessing of data on indigenous health re-quired the reorganization of data from the year 2000
to 2002, made available by the Departamento de
Saúde do Índio (DESAI) [Department of Indigenous Health], by means of the SIASI.
Health System], which is administrated by the
Fun-dação Nacional de Saúde (Funasa) [National Health Foundation] that celebrated agreements with non-governmental entities and city halls, that are execut-ing the programmed activities accordexecut-ing to the health districts’ plans. The districts’ routines cover a range of services geared towards the development of pro-grammatic activities that seek to control the most frequent disorders such as malaria, tuberculosis,
mal-nutrition, and vaccine-preventable diseases.6
Despite the advances represented by the implemen-tation of the indigenous health subsystem, several problems still need to be addressed; among these are the precariousness of the data system, which does not supply the health teams with consistent information, congruent with the necessities and peculiarities of the population being attended.
Funasa has been implementing the Sistema de
Informação em Saúde Indígena (SIASI) [Indigenous Health Data System] that includes modules related to the demographic composition of the population and disorders that are most prevalent in the various dis-tricts. The fact that the SIASI is not accessible for public consultation at present makes the task of evalu-ating its limits and potentialities more difficult. How-ever, its structural similarity to the other morbidity and mortality data systems already in existence in Brazil suggests that it operates with a high degree of complexity. This gives rise to problems in obtaining information rapidly, impeding decision-making in the daily administration of health services.
Another difficulty is the geoprocessing of data from rural sites, since the digitization of registers depends upon a minimum standardization of addresses in order to define the unit of analysis that makes it possible to aggregate or disaggregate information in a precise way. In urban sites, the use of the Census Sectors of the
Instituto Brasileiro de Geografia e Estatística (IBGE)
[Brazilian Institute of Geography and Statistics] as a unit of analysis and geographic reference for data on health has been recommended. This procedure guar-antees the homogeneity of data, making it possible to aggregate it for reliable spatial analysis in several dif-ferent scales, according to the intended degree of de-tail, for each event being studied. This technique has been applied frequently in urban contexts,1-3,5,8-10,12
however similar initiatives do not exist with respect to the analysis of health situations in indigenous areas. Hokerberg et al’s7 paper is an exception, for it explored
!
Rev Saúde Pública 2005;39(4) www.fsp.usp.br/rsp
GIS in indigenous health Garnelo L et al
The systematic organization of the data initiated with the geoprocessing of the
“raster” figure in the Funasa/Ministério da
Saúde’s [Ministry of Health’s] homepage, and with the digitization of the DSEI according to Federated Units, transforming them into
digital maps. The databank was composed
of notifications of disorders provided by the DESAI and organized in Excel spreadsheets.
Thematic maps were elaborated, indicating: a) risk intensity gradients for tuberculosis, ma-laria and infant mortality; b) comparing health indicators among the DSEI themselves as well as well as with those found among non-indig-enous populations of the macro-regions and federated units in which DSEI are located.
Geoprocessing of the villages and the elaboration of thematic maps containing epi-demiological data were performed, as well as information concerning the social organiza-tion of ethnic groups, expressed inequities on the local level. This data was plotted onto a pilot-map containing the set of villages within the Baniwa indigenous area, of the Rio Negro DSEI.
Geoprocessing was conducted with the aide of the
software Map Info Professional [Professional Map
Info Program] (7.0 SCP version).
Data concerning the non-indigenous population
was obtained from the Sistema Nacional de Agravos
Notificáveis (SINAN) [National System of Notifiable
Disorders]. The Índice Parasitário Anual (IPA)
[An-nual Parasite Index], which represents the number of positive slides for malaria per 1,000 inhabitants/year within a specif ied area, was utilized to analyze the situation with respect to malaria.
RESU LTS
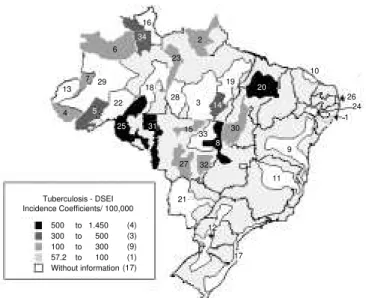
Considering the sanitary district as the unit of analysis, it was possible to compare coeffi-cients of the incidence of tuberculosis in 17 DSEI, for the year 2000. This data, contained in Figure 1, indicates the absence of notifica-tions, particularly in the Southern, Southeast-ern and NortheastSoutheast-ern regions in which only two of the nine existing DSEI supplied informa-tion to Funasa. The seven districts in which the greatest number of cases of tuberculosis were notified were: Araguaia, whose incidence co-efficient was 1448.6/100 thousand inhabit-ants; Vilhena, with 540.2/100 thousand; Porto Velho, with 537.9/100 thousand; Maranhao, with 534.2/100 thousand; Kayapo/Para, with 490.3/100 thousand, Yanomami with 333.0/ 100 thousand and Alto Purus 302.1/100 thou-sand. All the above mentioned Districts are
lo-Figure 1 - Distribution of the tuberculosis incidence coefficient (per 100,000 inhabitants) according to Indigenous Special Sanitary Districts, 2000.
Source: Fundação Nacional de Saúde/Departamento de Saúde Indígena. [National Health Foundation/Department of Indigenous Health. Relatório [Report]. Brasília (DF); 2002
Identification of the DSEI: 1 Alagoas and Sergipe; 2 Amapa and Norte of Para; 3 -Altamira; 4 - Alto Rio Jurua; 5 - Alto Rio Purus; 6 - Alto Rio Negro; 7 - Alto Rio Solimoes; 8 - Araguaia; 9 - Bahia; 10 - Ceara; 11 - Minas Gerais and Espírito Santo; 12 - Interior Sul; 13 Vale do Javari; 14 Kayapo (PA); 15 Kayapo (MT); 16 East Roraima; 17 -Southern Coast; 18 - Manaus; 19 - Guama-Tocantins; 20 - Maranhao; 21 - Mato Grosso do Sul; 22 Médio Rio Purus; 23 Parintins; 24 Pernambuco; 25 Porto Velho; 26 -Potiguara; 27 - Cuiaba; 28 - Tapajos River; 29 - Medio Solimões River and Tributaries; 30 - Tocantins; 31 - Vilhena; 32 - Xavante; 33 - Xingu Indigenous Park; 34 - Yanomami
500 to 1.450 300 to 500 100 to 300 57.2 to 100 Without information
(4) (3) (9) (1) (17) Tuberculosis - DSEI Incidence Coefficients/ 100,000
34
16
6
13
22 29 7
23
18 28
5
4
25
3 14
19
15
31
8
33
27 32
21
11
12
17 9 30
20
10
26 24 1 2
52 to 92 48.4 to 52 42.6 to 48.4 30.1 to 42.6 0.4 to 30.1
(5) (3) (6) (7) (6) Brasil - Tuberculosis - 2000 Incidence coefficients/ 100,000
56.72
76.51
0.42
41.42
53,81 49.7
56.46
0.54
48.04
41.17 21.87
19.01 33.22 32.63
30.85
51.96
47.98 30.13
91.93 45.85
45.62
28.3 42.57
48.38 50.74 42.87
Figure 2 - Distribuition of the incidence of tuberculosis coefficient (per 100,000 inhabitants) according to States, 2000.
" Rev Saúde Pública 2005;39(4) www.fsp.usp.br/rsp
GIS in indigenous health Garnelo L et al
cated within Legal Amazonia.
Comparing the risk gradient, expressed by the in-cidence of tuberculosis within the DSEI (Figure 1), with that of the general population in the federated units in which these Districts are located (Figure 2), it may be observed that the districts’ coefficients, when these were informed, were all greater than those found among the general population within the Federated Units in which they were located.
Comparison of geographic macro-regions indicates that the 25 DSEI located in Legal Amazonia (including Araguaia that compre-hends both Mato Grosso and Goias) had mean tuberculosis incidence coefficients of 229.83/ 100 thousand, whereas the mean incidence for the general population of the Northern re-gion did not surpass 36.5/100 thousand and the Central Western region, did not surpass 30.4/100 thousand in the year 2000.
Analysis of malaria IPA for the year 2000 indicates that the districts with the greatest number of notifications were: Rio Tapajos (IPA=820.5), Yanomami (627.5), Guama/ Tocantins (431.1), Amapa/North of Para (272.8), Javari(251.3), Altamira (245.0) and Kaiapo Para (242.5).
Among the 23 DSEI that notified cases of malaria during the year 2000, the IPA varied
from 0.6 to 30/1,000 in eight; it varied from 30 to 50/1,000 in two; from 50 to 100/1,000 in four and from 100 to 821/1,000 in nine of these districts (Figure 3).
The indigenous population of the Altamira, Kayapo/PA, Guama/Tocantins and Rio Tapajos DSEI, located in Para, Guamá presented a mean IPA of 434.7. In the Amazons, the DSEI Alto Rio Negro (IPA=26.8), Alto Solimoes (IPA=52.4), Javari (IPA=251.3), Medio Purus (IPA=106.1), Manaus (IPA=185.5), Parintins (IPA=1.5) and Medio Solimoes (IPA=52.6) pre-sented the mean IPA of 96.9.
In 2001 the DSEI that presented IPA above 50/1,000 were: Altamira (393.9/1,000), Rio Tapajos (264/1,000), Yanomami (208.9/1,000), Medio Purus (210/1,000), Manaus (128.6/ 1,000), Amapa/Norte do Para (99.6/1,000), Porto Velho (76.6/1,000), Guama/Tocantins (73.9/1,000) and Kayapo (65.8/1,000).
Analysis of the gradient of risk of death in childhood (Figure 4) indicates that 29 DSEI presented coefficients of infant mortality above the national average, estimated at 31.8/1,000 live births for the year 2000 by the IBGE.
In 2001 the notification of infant mortality indicated that only seven of the 34 DSEI registered coefficients below the national average: (Alto Solimoes: 28,7/1,000, Minas Gerais/Espírito Santo: 11.3/1,000, East Roraima: Malaria - DSEI - 2000
Annual Parasitic Index - IPA/ 1,000 100 to 821 50 to 100 30 to 50 0.6 to s 30 without information
(9) (4) (2) (8) (11)
6
13 7 29
4 5
22 18
27
34 16
23
2
20
19
10
30
21
11 9
12 17 32 15
33 8 31
25
3 14 28
1 26 24
Figure 3 - Incidence of malaria, according to the Annual Parasitic Index (per 1,000 inhabitants) in the Distritos Sanitários Especiais Indígenas [Indigenous Special Sanitary Districts], 2000.
Source: Fundação Nacional de Saúde/Departamento de Saúde Indígena [National Health Foundation/Department of Indigenous Health]. Relatório[Report] Brasília (DF); 2002
DSEI - Infant Mortality Coefficient - 2000 CMI/ 1,000 - live births
(1) (1) (6) (15) (6) (3) (2) 300 to 417 200 to 300 100 to 200 50 to 100 31.8 to 50 10.99 to 31.8 0 to 10.99
13 7
5
29 22 6
34
25 31
28 3
2
18
4
16
23
19
14 20
30 15
33 8
10
26
24
1 9
11 27 32
21
17
12
Figure 4 - Infant Mortality Coefficient (per 1,000 live births) in the Indigenous Special Sanitary Districts, 2000.
#
Rev Saúde Pública 2005;39(4) www.fsp.usp.br/rsp
GIS in indigenous health Garnelo L et al
25.93/1,000, Manaus: 25.21/1,000, Guama/ Tocantins: 28.57/1,000, Pernambuco: 21.4/ 1,000 and Potiguara: 20.6/1,000).
Shifting the focus of the study from the Sani-tary District to the level of the village and uti-lizing the Baniwa ethnic group as an example, Figure 5 indicates the geographic location of their villages, distributed according to clan* subdivisions in various stretches of the Icana and Aiari rivers. The Baniwa population is com-posed of a total of 3,760 individuals that live within the territory of the Rio Negro DSEI. All the Baniwa villages are set out on this map, which indicates all of those in which deaths occurred, utilizing four symbols (star, circle, tri-angle and square) each of which designates one of the clans. The following results were gener-ated after calculating the general mortality co-efficients for each clan: 46.1/10,000 for the Coripaco clan, 56.3/10,000 for the Hohodene
clan, 24.5/10,000 for the Walipere clan and 61.6/10,000 for the Dzawenai clan. These coefficients indicate that, even within a small and apparently homogeneous popu-lation, there are disparities that may be apprehended by a geographic information system.
D ISCU SSIO N
The tuberculosis notifications speak for them-selves about the profound inequities in health to which the Brazilian indigenous populations are sub-mitted. All the DSEI that notified cases, presented coefficients of the incidence of tuberculosis much greater than those registered for the general popula-tion, surpassing in more than 1,000 times the great-est coefficients found among the non-indigenous population. The precariousness of the data system suggests that the situation with respect to tubercu-losis may be even worse than that which has been registered in this study, particularly because 17 of the Sanitary Districts did not notify this disorder
during the period under study.4,6
The situation with respect to malaria is also a cause of concern. The World Health Organization consid-ers that populations with IPAs greater than 50/1,000 are under high risk for malaria and that IPAs varying from 10-49/1,000 express a medium risk for this dis-ease. The comparison of malaria risk gradients among the DSEI (Figure 3) indicates that approximately 30% of the DSEI that notified this disorder are in a high risk situation and all the others may be classified in a medium risk situation.
Legal Amazon is a region in which the States pertain-ing to it have traditionally presented much greater inci-dence of malaria than the rest of the country, frequently attaining coefficients 10 times higher than the national average.12 In the States of Amazonas and Para, for
exam-ple, the mean IPA for the general population in the year 2000 was 34.1/1,000 and in 2001 it was 44.9/1,000. These numbers place the region as a whole in the me-dium risk category. However, the mean IPA of the indig-enous population in these States was 69.06 for the year 2000 and 51.58 for the year 2001, indicating that the sanitary disparities express themselves in an even more
incisive form among this population group.6
The infant mortality notifications differ from those of tuberculosis and malaria for the latter presented high rates of non-notifying DSEI, whereas notifications of the former disorder, presented a national homogene-ity, revealing a kind of equilibrium among the DSEI of the various regions of the country. However, the risk of indigenous infant mortality is very high. The mean rate of indigenous infant mortality in the year 2000 (74.7/1,000 live births) surpassed in over 100% the coefficient of infant mortality of the Brazilian popula-tion as a whole in 2000; in 2001 this value (56.5/ 1,000 live births) was approximately 78% greater than the national average. These general coefficients do not reveal the profound disparities between districts, indi-cated on Figure 4, in which 91% of the DSEI exhibit coefficients greater than the national average, being that, in the gravest situations, these coefficients excede the national average in up to 10 or 15 times.11 In the
seven DSEI that presented coefficients below the
na-*The Baniwa are divided in four clans or fratrias Coripaco (that have 1,084 members), Hohodene (that have 887 members), Walipere (816 members) and Dzawenai (973 members), distributed among four micro-regions (Alto Içana, Médio Içana, Aiari e Baixo Içana).
Baniwa Village without deaths
Villages with Coripaco clan deaths Villages with Hohodene clan deaths Villages with Walipere clan deaths Villages with Dzawenai clan deaths
Figure 5 - Distribution of deaths per clan in the Baniwa area in the Rio Negro Indigenous Special Sanitary District, 2002.
$ Rev Saúde Pública 2005;39(4) www.fsp.usp.br/rsp
GIS in indigenous health Garnelo L et al
REFEREN CES
1. Barcellos CC, Sabroza PC, Peiter P, Iñiguez Roja L. Organização espacial, saúde e qualidade de vida: análise espacial e uso de indicadores na avaliação de situações de saúde. Inf Epidemiol SUS
2002;11(3):129-38.
2. Barcellos CC, Sabroza PC. Socio-environmental determinants of the leptospirosis outbreak of 1996 in the western Rio de Janeiro: a geographical approach. Int J Environ Health Res 2000;10:301-13.
3. Carvalho MS, Cruz O. Análise espacial por micro-áreas: métodos e experiências. In: Veras RP, Barreto ML, Almeida Filho N, Barata RB, organizadores. Epidemiologia: contextos e pluralidade. Rio de Janeiro: Fiocruz/ Abrasco; 1998. p. 79-89. (Série EpidemioLógica).
4 . Escobar A, Coimbra Jr CE, Camacho L, Portela MC. Tuberculose em Populações Indígenas de
Rondônia, Amazônia, Brasil. Cad Saúde Pública 2001;17:285-98.
5. Freitas ED, Paim JS, Silva LMV, Costa MCN. Evolução e distribuição espacial da mortalidade por causas externas em Salvador, Bahia, Brasil. Cad Saúde Pública 2000;16:1059-70.
6. Garnelo L, Macedo G, Brandão LC. Os povos indígenas e a construção das políticas de saúde no Brasil. Brasília (DF): OPAS; 2003. p. 98.
7. Hokerberg Y, Duchiade M, Barcelos C. Organização e qualidade da assistência dos índios Kaingáng do Rio Grande do Sul, Brasil, 2001. Cad Saúde Pública 2001;17(2):261-72.
8. Iñiguez-Rojas L. Geography and health: themes and perspectives in Latin America. Cad Saúde Pública 1998;14(4):701-11.
9. Iñiguez-Rojas L, Barcellos C, Peiter P. The usage of maps in epidemiology in Brazil: thoughts about the presentations during the IV Brazilian Conference of Epidemiology. Inf Epidemiol SUS 1999;8(2):27-35.
10. Levino A. Estudo da associação entre tuberculose e a infecção pelo HIV no Município de Manaus, AM [dissertação de mestrado]. Rio de Janeiro: ENSP/ Fiocruz; 2001.
11. Ministério da Saúde. Saúde Brasil: uma análise da situação de saúde. Brasília: Ed. Ministério da Saúde; 2004.
12. Organização Panamericana de Saúde. Sistemas de informação geográfica em saúde: conceitos básicos. Brasília (DF): OPAS; 2002.
13. Paim JS. Abordagens teórico-conceituais em estudos de condições de vida e saúde: notas para reflexão e ação. In: Barata RB, organizador. Condições de vida e situação de saúde. Rio de Janeiro: Abrasco; 1997. p. 7-30.
tional average, (Alto Rio Solimoes, Minas Gerais/ Espirito Santo, Leste de Roraima, Guama/Tocantins, Pernambuco, Potiguara e Manaus) the precarious na-ture of the sanitary data is more suggestive of sub no-tification than of good standards of health.6 The
plas-ticity of the geographic information system propiti-ated the production of both macro-regional and dis-trict level analysis and made it possible to study the micro-level of the village as well (Figure 5).
Within this sphere, by comparing the spatial distri-bution of the deaths to the demographic composition and the distribution of residential groups – data that is of interest to the district management in programming and evaluating the extension of health activities – in-ternal disparities within the groups were brought to light. These disparities express power relations within ethnic groups that have important implications with respect to access to services and, consequently, in the morbidity profile of the population. Other data, such as rates of disorders notified by each village or avail-ability of environmental and nutritional resources, could easily be inserted into the data banks, propitiat-ing the elaboration of thematic maps capable of repre-senting information according to micro-region, clans and ethnic groups. Geographic information systems
do not substitute other more conventional methods being utilized by the Brazilian Unified Health System and the subsystem of indigenous health. However, man-agement of geoprocessed data makes it possible to rapidly and efficiently build scenarios that express the disparities in the morbidity profile of the population being attended.
The use of geoprocessing propitiates the intersec-tion of epidemiological indicators, facilitates the in-sertion of intersectorial data and supports analytical approaches that express the relations between living conditions and standards of health and illness.13 It
![Figure 3 - Incidence of malaria, according to the Annual Parasitic Index (per 1,000 inhabitants) in the Distritos Sanitários Especiais Indígenas [Indigenous Special Sanitary Districts], 2000.](https://thumb-eu.123doks.com/thumbv2/123dok_br/19033106.476013/4.812.67.437.95.399/incidence-parasitic-inhabitants-distritos-sanitários-especiais-indígenas-indigenous.webp)

