Rev Saúde Pública 2005;39(4) www.fsp.usp.br/rsp
H ousehold food availability in Brazil:
distribution and trends (1974-2003)
Renata Bertazzi Levy-Costaa, Rosely Sichierib, N ézio dos Santos Pontesc and Carlos
Augusto M onteirod
aNúcleo de Investigação em Nutrição. Instituto de Saúde. Secretaria de Estado da Saúde de São
Paulo. São Paulo, SP, Brasil. bDepartamento de Epidemiologia. Instituto de Medicina Social. Universidade Estadual do Rio de Janeiro. Rio de Janeiro, RJ, Brasil. cCoordenação de Índices de Preços. Pesquisa de Orçamentos Familiares. Instituto Brasileiro de Geografia e Estatística (IBGE). Rio de Janeiro, RJ, Brasil. dDepartamento de Nutrição. Faculdade de Saúde Pública. Universidade de São Paulo. São Paulo, SP, Brasil
Correspondence to: Carlos Augusto Monteiro Departamento de Nutrição - FSP/USP Av. Dr. Arnaldo, 715
01246-904 São Paulo, SP, Brasil E-mail: [email protected]
Received on 25/2/2005. Approved on 25/4/2005.
Keywords
Household budget survey. Food consumption. Drinking. Diet. Metropolitan zones. Family income. Socio-economic factors.
Abstract
Objective
Data from household food budget surveys were examined in order to describe the regional and socio-economic distribution of household food availability in Brazil in 2002-2003 and trends from 1974 to 2003.
Methods
The study uses data from the “Pesquisa de Orçamento Familiar 2002-2003” budget survey conducted by the Brazilian Institute for Geography and Statistics (Instituto Brasileiro de Geografia e Estatística) from July 2002 to June 2003, including a national sample of 48,470 households. In each household, during seven consecutive days, all monetary and non-monetary expenses with food and beverages for family consumption were registered. Crude weights of purchased foods were transformed into calories and nutrients with the use of food composition tables.
Results
Adequate protein content and a high proportion of animal protein were found in all regions and income strata. These were the most important positive aspects identified in the household food availability in Brazil. On the other hand, all regions and socio-economic strata showed excess calories from sugar and little availability of fruits and vegetables. An excessive proportion of calories came from total and saturated fat in the more economically developed regions and in the urban milieu, as well as among higher-income families. Time-trends in metropolitan areas indicated a decline in the consumption of basic, traditional foods, such as rice and beans; notable increases (up to 400%) in the consumption of processed food items, such as cookies and soft drinks; maintenance of the excessive consumption of sugar; and a continuous increase in total fat and saturated fat content in the diet.
Conclusions
Patterns and trends regarding household food availability in Brazil are consistent with the increasing participation of chronic non-communicable diseases in morbidity and mortality and with the continuous increase in the prevalence of obesity.
INTRODUCTION
Inadequate diet and physical inactivity are of great importance to population health due to their strong association with a number of highly prevalent non-communicable chronic diseases such as obesity,
type-2 diabetes, and coronary disease.23 On the other hand,
Rev Saúde Pública 2005;39(4) www.fsp.usp.br/rsp
Food availability in Brazil Levy-Costa RB et al
pling strategy was designed to be able to produce rep-resentative estimates for Brazil as a whole, for its great geographical Regions (North, Northeast, Southeast, South, and Center-West), and for all Federation Units. For Brazil and great Regions, the sample allows for representative estimates to be drawn for both urban and rural households.
The basic information analyzed by the HBS is the purchase of food and beverages for household con-sumption by the concon-sumption unit (household) dur-ing a period of seven consecutive days, recorded daily by a member of the household or by the IBGE inter-viewer in a diary. This record includes a detailed de-scription of the product, the amount purchased, and the measurement unit, in addition to the amount paid in Reais, place of purchase, and form of purchase (monetary/non-monetary). The 2002-2003 HBS reg-istered approximately 820 thousand purchases of food and beverages for household consumption. In roughly 80% of purchases it was possible to determine di-rectly the amount purchased in kilograms or liters of product; in the remaining cases, the amount was de-duced based on the value paid and on the mean price of the product.
Indicators used include the mean total caloric value of household food availability (expressed as kcal per capita per day) and the relative participa-tion in food availability of foods, food groups, and selected nutrients.
In order to transform crude amounts of food into calories and macronutrients, we first grouped similar products with little participation in the entire body of purchases (for instance, peas, lentils, and chickpeas were grouped as ‘other legumes’), which yielded a short list of 214 food items. In the case of items composed of more than one type of food, we considered the nutri-tional composition of the food with greatest participa-tion in the item. The transformaparticipa-tion began by apply-ing correction factors to the crude amounts of food so as to exclude inedible portions.3 Next, in order to
ar-rive at the available amount of calories and macronu-trients, three food composition tables were employed: the TACO table (Tabela Brasileira de Composição de Alimentos - Brazilian Table of Food Composition)14;
the Guilherme Franco table,2 and the IBGE/ENDEF
(IBGE/Estudo Nacional de Despesa Familiar - IBGE/ National Household Expenditure Survey) table.3 The
TACO table was used for all foods of animal origin with the exception of sausages and other processed meat products, for which the Guilherme Franco table was used. The IBGE/ENDEF table was used for all re-maining foods. In addition, for specific fatty acid com-position – lacking in the Guilherme Franco and IBGE/ both nutritional deficiencies and non-communicable
chronic diseases. Such modifications must be based on systems capable of monitoring food consumption indexes, preferably with basis on the flow of informa-tion already available. Household Budget Surveys (HBS) are a valuable source from which to derive food consumption indexes, and the use of such surveys has been increasing in developing countries.16,20
Brazil has conducted HBS in metropolitan areas with some regularity, and has evaluated, through these surveys, the time trends in food availability in the country.10,11 HBS do not allow for an evaluation of
individual consumption; rather, they occupy an in-termediate position between food balance sheets, which describe food availability nationwide, and surveys designed to evaluate individual consump-tion. Although the main aim of HBS is to estimate price rates, they constitute an important source of data on diets due to their use of standardized data collection methodologies and probabilistic samples, their periodicity, and their detailed measurement of socio-economic characteristics.8
The present study attempts to describe the regional and socio-economic distribution of household food availability in Brazil and to evaluate the evolution of this availability in the last three decades, based on the national database of the 2002/2003 Brazilian HBS5 and on databases for metropolitan areas from
HBS conducted in the mid 1970’s, 80’s, and 90’s.4
M ETH O D S
The 2002/2003 HBS was carried out between July 2002 and June 2003, with a sample of 48,470 house-holds. The sampling procedure employed in this sur-vey, which is similar to that adopted by the Brazilian Institute for Geography and Statistics (Instituto Brasileiro de Geografia e Estatística – IBGE) in previ-ous hprevi-ousehold budget surveys, is described in detail elsewhere.5 Briefly, this was a two-stage cluster
sam-!
Rev Saúde Pública 2005;39(4) www.fsp.usp.br/rsp
Food availability in Brazil Levy-Costa RB et al
ENDEF tables – United States food composition ta-bles were employed.19
In order to describe the relative participation of foods and food groups in the total food availability of the household, the 214 food items were regrouped into 48 items, classified into 15 groups: three groups of basic foods of vegetable origin, sources of energy and, in different proportions, also of protein, micronutrients, and fiber (cereals and derived products, beans and other legumes, and roots, tubercles, and derived products); three groups of foods of animal origin, simultaneous sources of energy, protein, fat (especially saturated fat), and micronutrients (meat and derived products, dairy products, and eggs); two groups of foods of vegetable origin, with low energy density and rich in micronu-trients and fiber (fruit and natural juices and legumes and greens); four groups of essentially caloric foods (vegetable oils and fats, animal fats, sugar, and soft drinks and alcoholic beverages); and three additional groups of foods with less important participation in the food consumption of the Brazilian population (oleaginous seeds, condiments, and ready-made meals and industrialized mixes).
The relative contribution of each nutrient to food availability considered only the contribution of macronutrients – i.e., carbohydrates (subdivided into sugar [sucrose] and other carbohydrates), proteins (subdivided into animal or vegetable), and lipids (subdivided into monounsaturated, polyunsaturated, and saturated fatty acids). Regarding both foods and macronutrients, the relative participation in house-hold food availability was expressed as the percent-age of calories the food or macronutrient represented in the total calories available for consumption.
Estimates of the caloric value of household food availability and of the relative participation of dif-ferent foods, food groups, and nutrients in that ca-loric value are presented according to household situ-ation (urban/rural), the five great Regions, and in-come class. Inin-come classes considered range from families with monthly incomes of up to one-quarter minimum wage per capita (the 5.8% households with lowest income) to families with monthly income above five minimum wages per capita (the 4.2% households with highest income).
Estimates for the country’s metropolitan areas based on the 2002/2003 HBS were compared to estimates based on family budget surveys conducted by IBGE in 1974/75, 1986/87, and 1995/96. This group includes the metropolitan areas of Belém, Fortaleza, Salvador, Belo Horizonte, Rio de Janeiro, Sao Paulo, Curitiba, and Porto Alegre, the Federal District, and the
munici-pality of Goiânia. Procedures identical to those the 2002/2003 HBS were employed in each of these sur-veys for generating food availability indicators.
All estimates considered the expansion factors used in the HBS as well as the complexity of sampling design.
The evaluation of the nutritional adequacy of household food availability was based on recent nu-tritional recommendations formulated by United Nations agencies.23
RESU LTS
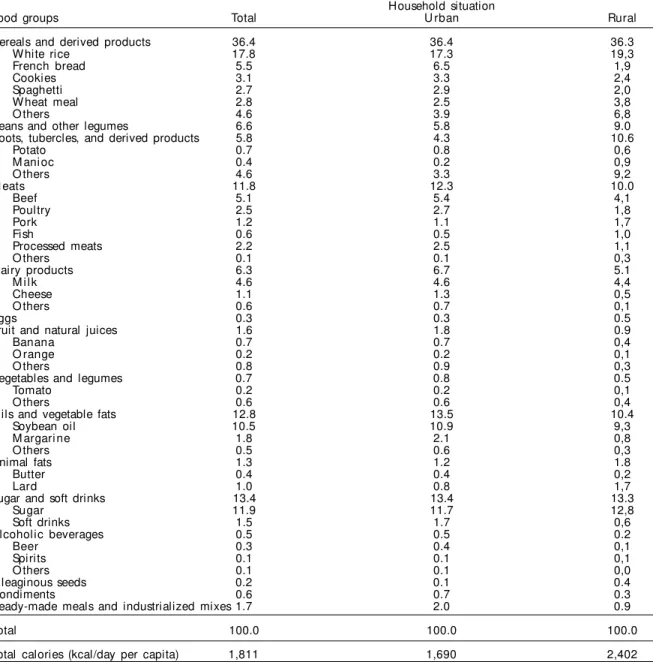
Mean household food availability in Brazil was es-timated at 1,800 kcal per person per day. Mean avail-ability was of 1,700 kcal in urban areas and 2,400 kcal in rural areas (Table 1). It should be noted that it is impossible to evaluate the adequacy of this calorie availability, since we lack a direct evaluation of the food actually consumed by these families as well as of the amount of food consumed outside the household.
Table 1 shows the relative participation of foods and food groups in household food availability. Ba-sic foods of vegetable origin (cereals, legumes, and roots and tubercles) account for roughly 50% of all calories, followed by essentially caloric foods (oils and vegetable fats, animal fat, sugar and soft drinks, and alcoholic beverages) with 28%, and animal prod-ucts (meat, dairy prodprod-ucts, and eggs) with 18%. Fruit, vegetables, and legumes accounted for only 2.3% of total calories, or about one-third of the recommended daily intake (at least 400 grams per day, or about 6-7% of the calories in a 2,300 kcal diet, the daily ca-loric value corresponding the mean daily need of the Brazilian population according to the Food and Ag-riculture Organization (FAO).15
The importance of cereals and derived products in the diet was similar in rural and urban areas, there being a greater participation of bread, cookies, and pasta in the urban milieu and of rice and flour in rural areas. There was a greater participation of fruit, veg-etables and legumes, meat, and dairy products in the urban area, whereas greater participation of beans and other legumes and roots and tubercles was found in rural areas. The participation in the diet of ready-made meals and industrialized mixes was three times greater in urban areas (Table 1).
" Rev Saúde Pública 2005;39(4) www.fsp.usp.br/rsp
Food availability in Brazil Levy-Costa RB et al
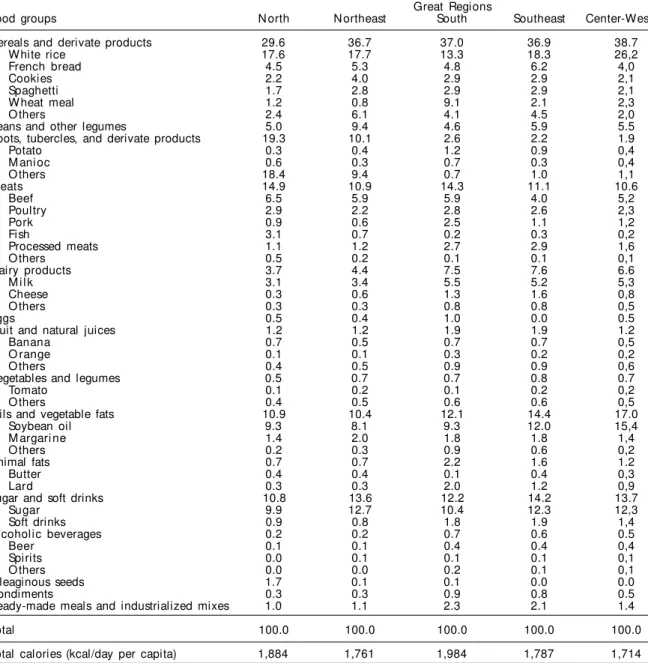
respectively, those of the other regions in the country. Similar scenarios are found regarding beans and cook-ies in the Northeast, manioc flour in the North and Northeast, meat in the North and South, fish in the North, pork in the South, fruit and natural juices in the South and Southeast, oil in the Center-West, lard in the South, soft drinks, alcoholic beverages, condiments, and ready-made meals in the South and Southeast, and oleaginous seeds (Brazil-nuts) in the North. Examples of availability much below national average are dairy products and vegetables and legumes in the North and Northeast and eggs in the Southeast.
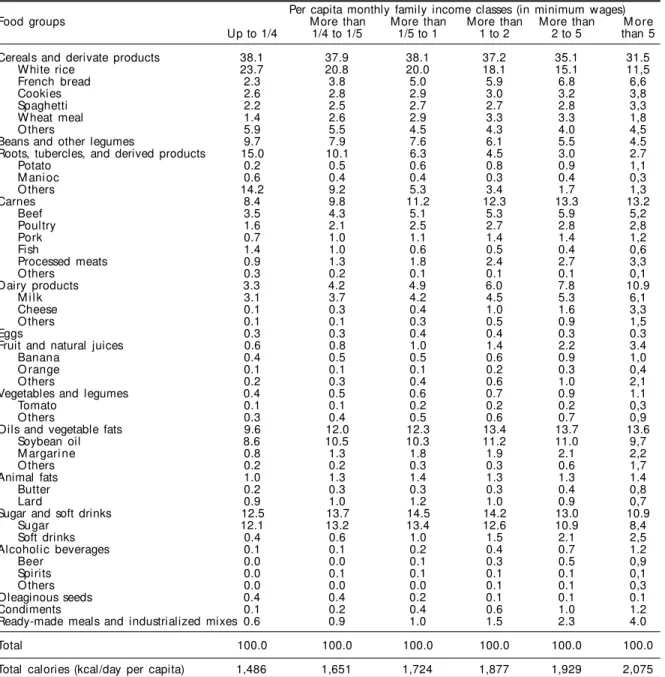
The effect of family income was substantial for most foods and food groups (Table 3). Food groups whose participation in the diet increased uniformly with
in-come include meat, dairy products, fruit, vegetables and legumes, alcoholic beverages, condiments, and roots and tubercles. The participation of cereals and derived products in the diet was relatively constant up to the two minimum-wage per capita threshold, and gradually decreased as income increased past this point. Contrasting patterns with respect to income were found for rice, whose consumption decreases mark-edly as income rises, and for bread and cookies, whose consumption increases with income. Distinct patterns were also found in the sugar and soft-drinks group. There is slight increase in sugar consumption up to one minimum wage per capita and a steep decline af-terwards, so that sugar consumption in the highest so-cioeconomic stratum was 50% lower than that of the lowest stratum. By contrast, there was a marked and
Table 1 - Relative participation (%) of foods and food groups in the total calorie consumption, as determined by household food purchase, according household situation. Brazil, 2002/2003.
Household situation
Food groups Total U rban Rural
Cereals and derived products 36.4 36.4 36.3
White rice 17.8 17.3 19,3
French bread 5.5 6.5 1,9
Cookies 3.1 3.3 2,4
Spaghetti 2.7 2.9 2,0
Wheat meal 2.8 2.5 3,8
Others 4.6 3.9 6,8
Beans and other legumes 6.6 5.8 9.0
Roots, tubercles, and derived products 5.8 4.3 10.6
Potato 0.7 0.8 0,6
M anioc 0.4 0.2 0,9
Others 4.6 3.3 9,2
M eats 11.8 12.3 10.0
Beef 5.1 5.4 4,1
Poultry 2.5 2.7 1,8
Pork 1.2 1.1 1,7
Fish 0.6 0.5 1,0
Processed meats 2.2 2.5 1,1
Others 0.1 0.1 0,3
Dairy products 6.3 6.7 5.1
M ilk 4.6 4.6 4,4
Cheese 1.1 1.3 0,5
Others 0.6 0.7 0,1
Eggs 0.3 0.3 0.5
Fruit and natural juices 1.6 1.8 0.9
Banana 0.7 0.7 0,4
O range 0.2 0.2 0,1
Others 0.8 0.9 0,3
Vegetables and legumes 0.7 0.8 0.5
Tomato 0.2 0.2 0,1
Others 0.6 0.6 0,4
Oils and vegetable fats 12.8 13.5 10.4
Soybean oil 10.5 10.9 9,3
M argarine 1.8 2.1 0,8
Others 0.5 0.6 0,3
Animal fats 1.3 1.2 1.8
Butter 0.4 0.4 0,2
Lard 1.0 0.8 1,7
Sugar and soft drinks 13.4 13.4 13.3
Sugar 11.9 11.7 12,8
Soft drinks 1.5 1.7 0,6
Alcoholic beverages 0.5 0.5 0.2
Beer 0.3 0.4 0,1
Spirits 0.1 0.1 0,1
Others 0.1 0.1 0,0
Oleaginous seeds 0.2 0.1 0.4
Condiments 0.6 0.7 0.3
Ready-made meals and industrialized mixes 1.7 2.0 0.9
Total 100.0 100.0 100.0
#
Rev Saúde Pública 2005;39(4) www.fsp.usp.br/rsp
Food availability in Brazil Levy-Costa RB et al
continuous increase in soft-drink consumption with income, so that the participation of soft drinks in the diet among the higher-income class was fivefold that of the lowest-income class.
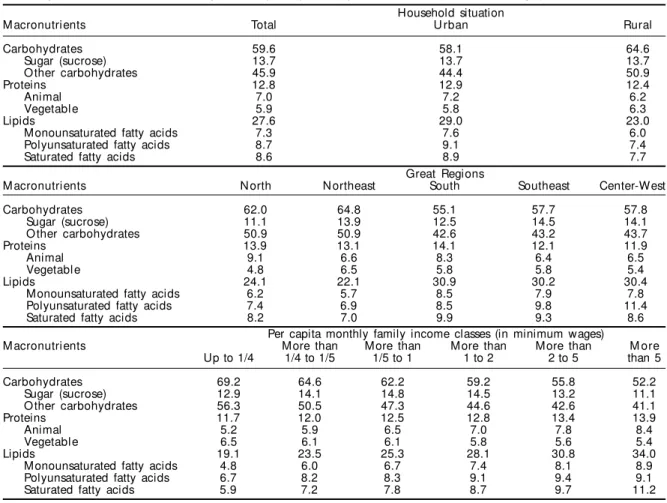
The relative participation of macronutrients in household food availability indicates that 59.6% of all calories consumed come from carbohydrates, 12.8% from proteins, and 27.6% from lipids, show-ing an adequacy of the diet to nutritional recommen-dations (55%-75% of total calories coming from car-bohydrates, 10%-15% from proteins, and 15%-30% from lipids). The fact that over 50% of proteins were of animal origin (with greater biological value) and the low saturated fatty acid content (below the rec-ommended limit of 10%) also provide evidence of
the nutritional adequacy of mean national food avail-ability. The only evidence of an imbalance is the ex-cessive participation of sucrose in the total carbohy-drate consumption (13.7%), which is above the 10% level set by nutritional recommendations (Table 4).
The relative participation of macronutrients in the diet indicates similarities in terms of protein content (12%-14% of total calories), but substantial differ-ences regarding carbohydrate and lipid content be-tween urban and rural households and different geo-graphical regions and income classes (Table 4). This table also shows that the participation of lipids in the diet is close to, or even higher than 30% (the maxi-mum recommended value) in urban areas and, gener-ally speaking, in the South, Southeast, and
Center-Table 2 - Relative participation (%) of foods and food groups in the total calorie consumption, as determined by household food purchase, according to the five Great Regions. Brazil, 2002/2003.
Great Regions
Food groups North Northeast South Southeast Center-West
Cereals and derivate products 29.6 36.7 37.0 36.9 38.7
White rice 17.6 17.7 13.3 18.3 26,2
French bread 4.5 5.3 4.8 6.2 4,0
Cookies 2.2 4.0 2.9 2.9 2,1
Spaghetti 1.7 2.8 2.9 2.9 2,1
Wheat meal 1.2 0.8 9.1 2.1 2,3
Others 2.4 6.1 4.1 4.5 2,0
Beans and other legumes 5.0 9.4 4.6 5.9 5.5
Roots, tubercles, and derivate products 19.3 10.1 2.6 2.2 1.9
Potato 0.3 0.4 1.2 0.9 0,4
M anioc 0.6 0.3 0.7 0.3 0,4
Others 18.4 9.4 0.7 1.0 1,1
M eats 14.9 10.9 14.3 11.1 10.6
Beef 6.5 5.9 5.9 4.0 5,2
Poultry 2.9 2.2 2.8 2.6 2,3
Pork 0.9 0.6 2.5 1.1 1,2
Fish 3.1 0.7 0.2 0.3 0,2
Processed meats 1.1 1.2 2.7 2.9 1,6
Others 0.5 0.2 0.1 0.1 0,1
Dairy products 3.7 4.4 7.5 7.6 6.6
M ilk 3.1 3.4 5.5 5.2 5,3
Cheese 0.3 0.6 1.3 1.6 0,8
Others 0.3 0.3 0.8 0.8 0,5
Eggs 0.5 0.4 1.0 0.0 0.5
Fruit and natural juices 1.2 1.2 1.9 1.9 1.2
Banana 0.7 0.5 0.7 0.7 0,5
O range 0.1 0.1 0.3 0.2 0,2
Others 0.4 0.5 0.9 0.9 0,6
Vegetables and legumes 0.5 0.7 0.7 0.8 0.7
Tomato 0.1 0.2 0.1 0.2 0,2
Others 0.4 0.5 0.6 0.6 0,5
Oils and vegetable fats 10.9 10.4 12.1 14.4 17.0
Soybean oil 9.3 8.1 9.3 12.0 15,4
M argarine 1.4 2.0 1.8 1.8 1,4
Others 0.2 0.3 0.9 0.6 0,2
Animal fats 0.7 0.7 2.2 1.6 1.2
Butter 0.4 0.4 0.1 0.4 0,3
Lard 0.3 0.3 2.0 1.2 0,9
Sugar and soft drinks 10.8 13.6 12.2 14.2 13.7
Sugar 9.9 12.7 10.4 12.3 12,3
Soft drinks 0.9 0.8 1.8 1.9 1,4
Alcoholic beverages 0.2 0.2 0.7 0.6 0.5
Beer 0.1 0.1 0.4 0.4 0,4
Spirits 0.0 0.1 0.1 0.1 0,1
Others 0.0 0.0 0.2 0.1 0,1
Oleaginous seeds 1.7 0.1 0.1 0.0 0.0
Condiments 0.3 0.3 0.9 0.8 0.5
Ready-made meals and industrialized mixes 1.0 1.1 2.3 2.1 1.4
Total 100.0 100.0 100.0 100.0 100.0
$ Rev Saúde Pública 2005;39(4) www.fsp.usp.br/rsp
Food availability in Brazil Levy-Costa RB et al
West Regions. Saturated fat content is very close to the upper limit (10%) in the South and Southeast (9.9% and 9.3% of total calories, respectively). Moreover, the sugar content in the diet greatly ex-ceeds the 10% maximum in all regions.
Greater income is associated with a marked increase in fat content and an equally marked decrease in car-bohydrate content. Regarding the latter, the 55% rec-ommended minimum contribution to total calorie in-take is not fulfilled for the class with monthly income above five minimum wages per capita, with the further problem that about one-fifth of the carbohydrates in the diet in this income class (11% in 52%) come from sugar. As to fats, the maximum limit of 30% of total calories is exceeded by the class with monthly income
higher than two minimum wages per capita. Saturated fats tend to increase even more markedly with income than do other fats. The recommended maximum con-tribution of saturated fats to calorie intake (10%) is virtually reached by classes earning between two and five minimum wages per capita (9.7%) and clearly exceeded by families earning more than this (11.2% of total calories). The 10% maximum limit for calories from sugar is exceeded across all income classes. The most critical scenario corresponds to the intermediate income classes, where the participation of sugar reaches almost 15% (Table 4).
Important variations in indicators of household food availability were found in the country’s met-ropolitan areas between 1972 and 2003, with
re-Table 3 - Relative participation (%) of foods and food groups in the total calorie consumption, as determined by household food
purchase, according to per capita monthly family income (in minimum wages. Brazil, 2002/2003.
Per capita monthly family income classes (in minimum wages)
Food groups More than More than More than More than M ore
Up to 1/4 1/4 to 1/5 1/5 to 1 1 to 2 2 to 5 than 5
Cereals and derivate products 38.1 37.9 38.1 37.2 35.1 31.5
White rice 23.7 20.8 20.0 18.1 15.1 11,5
French bread 2.3 3.8 5.0 5.9 6.8 6,6
Cookies 2.6 2.8 2.9 3.0 3.2 3,8
Spaghetti 2.2 2.5 2.7 2.7 2.8 3,3
Wheat meal 1.4 2.6 2.9 3.3 3.3 1,8
Others 5.9 5.5 4.5 4.3 4.0 4,5
Beans and other legumes 9.7 7.9 7.6 6.1 5.5 4.5
Roots, tubercles, and derived products 15.0 10.1 6.3 4.5 3.0 2.7
Potato 0.2 0.5 0.6 0.8 0.9 1,1
M anioc 0.6 0.4 0.4 0.3 0.4 0,3
Others 14.2 9.2 5.3 3.4 1.7 1,3
Carnes 8.4 9.8 11.2 12.3 13.3 13.2
Beef 3.5 4.3 5.1 5.3 5.9 5,2
Poultry 1.6 2.1 2.5 2.7 2.8 2,8
Pork 0.7 1.0 1.1 1.4 1.4 1,2
Fish 1.4 1.0 0.6 0.5 0.4 0,6
Processed meats 0.9 1.3 1.8 2.4 2.7 3,3
Others 0.3 0.2 0.1 0.1 0.1 0,1
Dairy products 3.3 4.2 4.9 6.0 7.8 10.9
M ilk 3.1 3.7 4.2 4.5 5.3 6,1
Cheese 0.1 0.3 0.4 1.0 1.6 3,3
Others 0.1 0.1 0.3 0.5 0.9 1,5
Eggs 0.3 0.3 0.4 0.4 0.3 0.3
Fruit and natural juices 0.6 0.8 1.0 1.4 2.2 3.4
Banana 0.4 0.5 0.5 0.6 0.9 1,0
O range 0.1 0.1 0.1 0.2 0.3 0,4
Others 0.2 0.3 0.4 0.6 1.0 2,1
Vegetables and legumes 0.4 0.5 0.6 0.7 0.9 1.1
Tomato 0.1 0.1 0.2 0.2 0.2 0,3
Others 0.3 0.4 0.5 0.6 0.7 0,9
Oils and vegetable fats 9.6 12.0 12.3 13.4 13.7 13.6
Soybean oil 8.6 10.5 10.3 11.2 11.0 9,7
M argarine 0.8 1.3 1.8 1.9 2.1 2,2
Others 0.2 0.2 0.3 0.3 0.6 1,7
Animal fats 1.0 1.3 1.4 1.3 1.3 1.4
Butter 0.2 0.3 0.3 0.3 0.4 0,8
Lard 0.9 1.0 1.2 1.0 0.9 0,7
Sugar and soft drinks 12.5 13.7 14.5 14.2 13.0 10.9
Sugar 12.1 13.2 13.4 12.6 10.9 8,4
Soft drinks 0.4 0.6 1.0 1.5 2.1 2,5
Alcoholic beverages 0.1 0.1 0.2 0.4 0.7 1.2
Beer 0.0 0.0 0.1 0.3 0.5 0,9
Spirits 0.0 0.1 0.1 0.1 0.1 0,1
Others 0.0 0.0 0.0 0.1 0.1 0,3
Oleaginous seeds 0.4 0.4 0.2 0.1 0.1 0.1
Condiments 0.1 0.2 0.4 0.6 1.0 1.2
Ready-made meals and industrialized mixes 0.6 0.9 1.0 1.5 2.3 4.0
Total 100.0 100.0 100.0 100.0 100.0 100.0
%
Rev Saúde Pública 2005;39(4) www.fsp.usp.br/rsp
Food availability in Brazil Levy-Costa RB et al
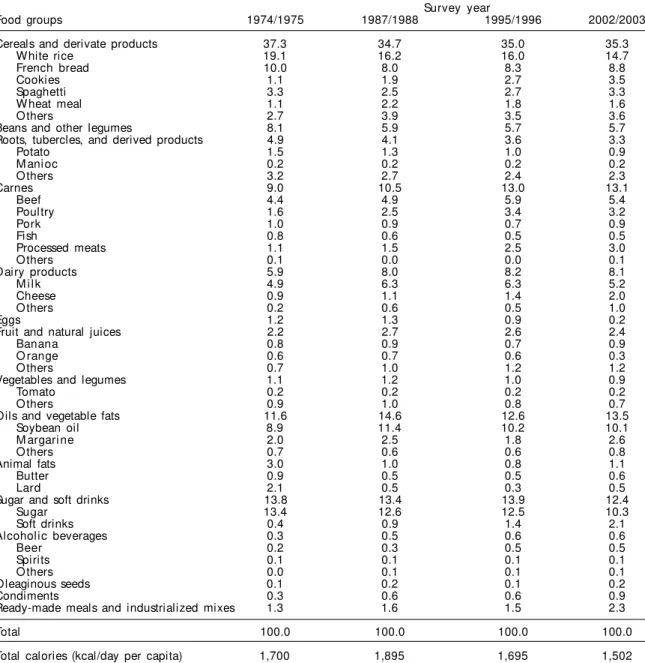
spect to both the relative participation of foods and food groups and macronutrient content. Par-ticipation increased for meats in general (almost 50% increase), beef (+22%), poultry (+100%), proc-essed meats (+300%), dairy products (+36%), veg-etable oils and fats (+16%), cookies (+400%), and ready-made meals (+80%). Foods and food groups showing an inverse trend include rice (23% reduc-tion), beans and other legumes (-30%), roots and tubercles (-30%), f ish (-50%), eggs (-84%), and animal fat (-65%). Sugar and soft drinks show op-posite trends during the period, the former decreas-ing by 23% and the latter increasdecreas-ing by 400%. The participation of fruit and vegetables and legumes in the diet remained relatively constant through-out the entire period (3%-4%), and, therefore, much below the 6%-7% of total calorie intake recom-mended for this food group (Table 5).
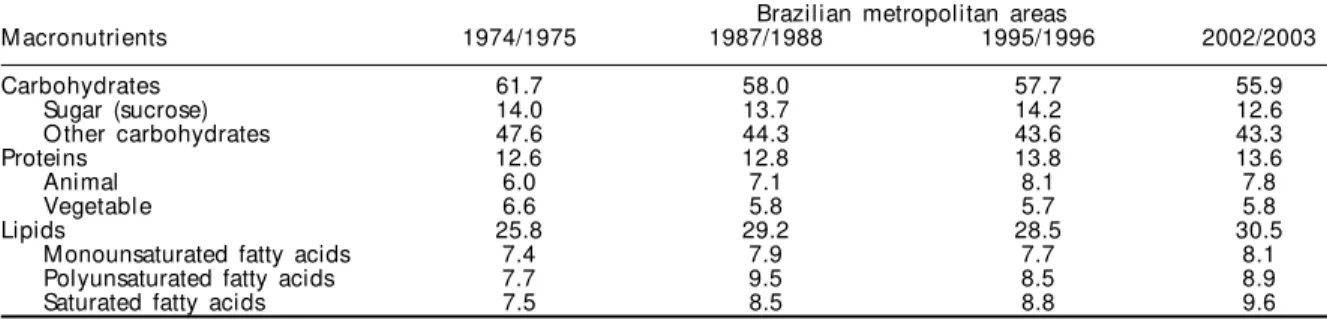
The evolution of macronutrient composition in the diet showed evidence of increase in fat content and reduction in carbohydrate content. Regarding carbo-hydrates, levels in the last survey are very close to the minimum level of 55% of total calorie intake, with the further problem that about one-fifth of the carbohydrates in the diet (12% in 56%) correspond
to sugar. As to fats, the maximum limit of 30% of total calories is exceeded in the last survey. Saturated fats tend to increase markedly and continuously between surveys, and the maximum limit of 10% of total calo-ries is virtually reached in the last survey (9.6%). The 10% maximum limit for sugar-derived calories is ex-ceeded in all surveys, despite a slight decline in the two most recent studies. Even though protein con-tent in the diet shows an increasing trend, the propor-tion of calories from protein was adequate in all four surveys (Table 6).
D ISCU SSIO N
Due to the exceptionally wide territorial coverage of the 2002/2003 HBS, we have been able to describe, for the first time in Brazil, the recent scenario and the regional and socioeconomic distribution of impor-tant indicators of pattern of food consumption in the population.
Positive characteristics of consumption patterns, found in all regions and across all income classes, included the adequacy of the protein content of di-ets and the high relative contribution of proteins of high biological value (of animal origin). Negative
Per capita monthly family income classes (in minimum wages)
Macronutrients More than More than More than More than M ore
Up to 1/4 1/4 to 1/5 1/5 to 1 1 to 2 2 to 5 than 5
Carbohydrates 69.2 64.6 62.2 59.2 55.8 52.2
Sugar (sucrose) 12.9 14.1 14.8 14.5 13.2 11.1
Other carbohydrates 56.3 50.5 47.3 44.6 42.6 41.1
Proteins 11.7 12.0 12.5 12.8 13.4 13.9
Animal 5.2 5.9 6.5 7.0 7.8 8.4
Vegetable 6.5 6.1 6.1 5.8 5.6 5.4
Lipids 19.1 23.5 25.3 28.1 30.8 34.0
Monounsaturated fatty acids 4.8 6.0 6.7 7.4 8.1 8.9
Polyunsaturated fatty acids 6.7 8.2 8.3 9.1 9.4 9.1
Saturated fatty acids 5.9 7.2 7.8 8.7 9.7 11.2
Great Regions
Macronutrients North Northeast South Southeast Center-West
Carbohydrates 62.0 64.8 55.1 57.7 57.8
Sugar (sucrose) 11.1 13.9 12.5 14.5 14.1
Other carbohydrates 50.9 50.9 42.6 43.2 43.7
Proteins 13.9 13.1 14.1 12.1 11.9
Animal 9.1 6.6 8.3 6.4 6.5
Vegetable 4.8 6.5 5.8 5.8 5.4
Lipids 24.1 22.1 30.9 30.2 30.4
Monounsaturated fatty acids 6.2 5.7 8.5 7.9 7.8
Polyunsaturated fatty acids 7.4 6.9 8.5 9.8 11.4
Saturated fatty acids 8.2 7.0 9.9 9.3 8.6
Table 4 - Relative participation (%) of macronutrients in the total calorie consumption, as determined by household food purchase,
according household situation, Great Regions, and per capita family income classes (in minimum wages). Brazil, 2002/2003. Household situation
Macronutrients Total U rban Rural
Carbohydrates 59.6 58.1 64.6
Sugar (sucrose) 13.7 13.7 13.7
Other carbohydrates 45.9 44.4 50.9
Proteins 12.8 12.9 12.4
Animal 7.0 7.2 6.2
Vegetable 5.9 5.8 6.3
Lipids 27.6 29.0 23.0
Monounsaturated fatty acids 7.3 7.6 6.0
Polyunsaturated fatty acids 8.7 9.1 7.4
& Rev Saúde Pública 2005;39(4) www.fsp.usp.br/rsp
Food availability in Brazil Levy-Costa RB et al
characteristics, also widespread in the country, were the excessive consumption of sugar and the insuffi-cient presence of fruit and vegetables in the diet. In the economically more developed regions (South, Southeast, and Center-West) and, generally speak-ing, in the urban milieu and in higher income house-holds, in addition to the excessive consumption of sugar, there was also excess consumption of total and saturated fat.
The evolution of food consumption patterns in Brazil in the last three decades, which we were able to study only in the country’s metropolitan areas, indicates a decline in the consumption of traditional foods such as rice and beans. There were increases of up to 400% in the consumption of industrialized
products such as cookies and soft drinks, a persist-ence of the excessive consumption of sugar and of the insufficient consumption of fruit and vegeta-bles, and a systematic increase in total and satu-rated fat content. Taken together, these results indi-cate unfavorable trends in food consumption pat-terns, especially from the perspective of obesity, diabetes, cardiovascular disease, certain types of cancer, and other chronic diseases associated with diets with high energy density, lacking fibers and micronutrients, and with excessive total and satu-rated fat content.23 Previous studies of household
food availability in metropolitan areas indicate that some of these trends began to take place already in the 1960’s and ’70’s, and gained in intensity in the 1980’s and ’90’s.10,11
Table 5 - Evolution of the relative participation (%) of foods and food groups in the total calorie consumption, as determined by household food purchase in metropolitan areas and municipality of Goiânia. Brazil, 1974/1975-2002/2003.
Survey year
Food groups 1974/1975 1987/1988 1995/1996 2002/2003
Cereals and derivate products 37.3 34.7 35.0 35.3
White rice 19.1 16.2 16.0 14.7
French bread 10.0 8.0 8.3 8.8
Cookies 1.1 1.9 2.7 3.5
Spaghetti 3.3 2.5 2.7 3.3
Wheat meal 1.1 2.2 1.8 1.6
Others 2.7 3.9 3.5 3.6
Beans and other legumes 8.1 5.9 5.7 5.7
Roots, tubercles, and derived products 4.9 4.1 3.6 3.3
Potato 1.5 1.3 1.0 0.9
M anioc 0.2 0.2 0.2 0.2
Others 3.2 2.7 2.4 2.3
Carnes 9.0 10.5 13.0 13.1
Beef 4.4 4.9 5.9 5.4
Poultry 1.6 2.5 3.4 3.2
Pork 1.0 0.9 0.7 0.9
Fish 0.8 0.6 0.5 0.5
Processed meats 1.1 1.5 2.5 3.0
Others 0.1 0.0 0.0 0.1
Dairy products 5.9 8.0 8.2 8.1
M ilk 4.9 6.3 6.3 5.2
Cheese 0.9 1.1 1.4 2.0
Others 0.2 0.6 0.5 1.0
Eggs 1.2 1.3 0.9 0.2
Fruit and natural juices 2.2 2.7 2.6 2.4
Banana 0.8 0.9 0.7 0.9
O range 0.6 0.7 0.6 0.3
Others 0.7 1.0 1.2 1.2
Vegetables and legumes 1.1 1.2 1.0 0.9
Tomato 0.2 0.2 0.2 0.2
Others 0.9 1.0 0.8 0.7
Oils and vegetable fats 11.6 14.6 12.6 13.5
Soybean oil 8.9 11.4 10.2 10.1
M argarine 2.0 2.5 1.8 2.6
Others 0.7 0.6 0.6 0.8
Animal fats 3.0 1.0 0.8 1.1
Butter 0.9 0.5 0.5 0.6
Lard 2.1 0.5 0.3 0.5
Sugar and soft drinks 13.8 13.4 13.9 12.4
Sugar 13.4 12.6 12.5 10.3
Soft drinks 0.4 0.9 1.4 2.1
Alcoholic beverages 0.3 0.5 0.6 0.6
Beer 0.2 0.3 0.5 0.5
Spirits 0.1 0.1 0.1 0.1
Others 0.0 0.1 0.1 0.1
Oleaginous seeds 0.1 0.2 0.1 0.2
Condiments 0.3 0.6 0.6 0.9
Ready-made meals and industrialized mixes 1.3 1.6 1.5 2.3
Total 100.0 100.0 100.0 100.0
'
Rev Saúde Pública 2005;39(4) www.fsp.usp.br/rsp
Food availability in Brazil Levy-Costa RB et al
When analyzing the purchase of products for fam-ily consumption, it is important to consider initially that these data are highly dependent on what is con-sumed outside the household.22 In the municipality
of Rio de Janeiro, in 1996, approximately 50% of the lunchtime and afternoon meals eaten by adult males took place outside home and without using food pur-chased for the household.18 Although the 2002/2003
HBS investigated for the first time the expense asso-ciated with each food item consumed outside home and the type of establishment where the food was consumed, the type and amount of food consumed were not sufficiently specified. This is, without doubt, an important limitation of the estimates made in the present study. Another limitation, inherent to any household budget study, is the failure to consider the fraction of the food purchased that is not consumed by the members of the household.
It is also important to draw attention to the fact that the short reference period (one week) for the collec-tion of food purchase data by families determines that the HBS estimates should be calculated based on clusters of families rather than on individual fami-lies. Moreover, the variation in the energy require-ments of different populational strata was not con-sidered, which prevents us from deducing, for in-stance, that the probability of caloric deficits in the country is greater in urban than in rural areas. In this case, it is actually more likely that the lesser food availability in the urban milieu reflects a greater con-sumption of food outside home and, possibly, also lower energy requirements than those found in the rural environment. Notwithstanding, food purchase data can provide useful information on household food consumption patterns, especially when the in-dicators used focus, as in the present study, on the relative participation of different foods and food groups rather than on absolute amounts. It is also important to note that household budget surveys re-flect the beginning of the consumption chain, allow-ing for the establishment of public policies capable of modifying food supply and the purchase patterns of the population.
Despite its limitations, family purchases are related to individual consumption patterns, as shown by a study that modeled European family budget data in relation to individual consumption data, correcting for age, sex, and alterations due to losses and process-ing.13 In this study, the correlation between food
pur-chase and actual consumption was greater than 0.80 for meat, dairy products, vegetables, and fruit. In an-other study, a comparison between purchase and ac-tual consumption showed reasonable agreement for all food groups with the exception of pastries and alcoholic beverages.1
As to the time trends for the evaluated indicators, the data in the present study should be viewed as a conservative estimate of changes taken place in di-etary patterns in Brazil during the last three decades. Since only the population of metropolitan areas was considered, not all changes related to the intense ur-banization which occurred in the country during this period could be observed. Nonetheless, very clear and alarming changes were detected in relation to certain foods, with emphasis on the 400% increase in the consumption of cookies and soft drinks. The marked increase in soft-drink consumption is a cern, since there is evidence that the excessive con-sumption of these products is associated with greater consumption of calories and greater weight gain among adolescents.7,9 Moreover, there is evidence that
calories present in liquid foods are less recognized by the organism than those present in solid foods.21
Cookies, on the other hand, are a major source of trans fatty acids in the diet, together with vegetable spreads and fried products, especially those sold in fast-food chains. Trans fatty acids assume a confor-mation similar to that of saturated fatty acids, and are considered as having a major hypercholesterolemic effect, increasing low-density lipoproteins and reduc-ing high-density lipoproteins. Their consumption should therefore remain below 1% of total calorie consumption.23
Finally, we emphasize that the trends in the food consumption patterns of the Brazilian population Table 6 - Evolution of the relative participation (%) macronutrients in the total calorie consumption, as determined by household food purchase in metropolitan areas and municipality of Goiânia. Brazil, 1974/1975-2002/2003.
Brazilian metropolitan areas
Macronutrients 1974/1975 1987/1988 1995/1996 2002/2003
Carbohydrates 61.7 58.0 57.7 55.9
Sugar (sucrose) 14.0 13.7 14.2 12.6
Other carbohydrates 47.6 44.3 43.6 43.3
Proteins 12.6 12.8 13.8 13.6
Animal 6.0 7.1 8.1 7.8
Vegetable 6.6 5.8 5.7 5.8
Lipids 25.8 29.2 28.5 30.5
Monounsaturated fatty acids 7.4 7.9 7.7 8.1
Polyunsaturated fatty acids 7.7 9.5 8.5 8.9
Rev Saúde Pública 2005;39(4) www.fsp.usp.br/rsp
Food availability in Brazil Levy-Costa RB et al
REFEREN CES
1. Becker W. Comparability of household and individual food consumption data – evidence from Sweden. Public Health Nutr 2001;4:1177-82.
2. Franco G. Tabela de composição química dos alimentos. 9ª ed. São Paulo: Atheneu; 1992.
3. Instituto Brasileiro de Geografia e Estatística (IBGE). Tabela de composição de alimentos. 4ª ed. Rio de Janeiro: IBGE. [Estudo Nacional da Despesa Familiar - ENDEF]; 1996.
4. Instituto Brasileiro de Geografia e Estatística (IBGE). Pesquisa de Orçamentos Familiares 1987 e 1996. Rio de Janeiro: IBGE; 1999. Disponível em http:// www.sidra.ibge.gov.br/bda/tabela/
listabl.asp?c=419&z=p80=8 [1 out 2004]
5. Instituto Brasileiro de Geografia e Estatística (IBGE). Pesquisa de orçamentos familiares, 2002-2003. Aquisição alimentar domiciliar per capita, Brasil e grandes regiões. Rio de Janeiro; 2004.
6. Instituto Brasileiro de Geografia e Estatística (IBGE). Pesquisa de Orçamentos Familiares 2002-2003: análise da disponibilidade domiciliar de alimentos e do estado nutricional no Brasil. Rio de Janeiro; 2004.
7. James J, Thomas P, Cavan D, Kerr D. Preventing childhood obesity by reducing consumption of carbonated drinks: cluster randomised controlled trial. BMJ 2004;328:1237.
8. Lagiou P, Trichopoulou A. The DAFNE initiative: the methodology for assessing dietary patterns across Europe using household budget survey data. Public Health Nutr 2001;4:1135-41.
9. Ludwig DS, Peterson KE, Gortmaker SL. Relation between consumption of sugar-sweetened drinks and childhood obesity: a prospective, observational analysis. Lancet 2001;357:505-8.
10. Mondini L, Monteiro CA. Mudanças no padrão de alimentação na população urbana brasileira (1962-1988). Rev Saúde Pública 1994;28(6):433-9.
11. Monteiro CA, Mondini L, Levy-Costa RB. Mudanças na composição e adequação nutricional da dieta familiar nas áreas metropolitanas do Brasil (1988-1996). Rev Saúde Pública 2000;34(3):251-8.
12. Monteiro CA, Benicio MHD’A, Conde WL, Popkin BM. Shifting obesity trends in Brazil. Eur J Clin Nutrit 2000;54:342-6.
13. Naska A, Paterakis S, Eeckman H, Remaut AM, Trygg K. Methodology for rendering household budget and individual nutrition surveys comparable, at the level of the dietary information collected. Public Health Nutr 2001;4:1153-8.
14. Núcleo de Estudos e Pesquisas em Alimentação. Universidade Estadual de Campinas [NEPA/ Unicamp]. Tabela Brasileira de Composição de Alimentos [TACO]: versão 1. São Paulo: NEPA/ Unicamp; 2004.
15. Nutrition country profiles-Brazil, Rome: FAO; 2000. Disponível em http://www.fao.org/es/ESN/nutrition/ bra-e.stm [1 nov 2004]
16. Serra-Majem L, MacLean D, Ribas L, Brule D, Sekula W, Prattala R et al. Comparative analysis of nutrition data from national, household, and individu-al levels: results from a WHO-CINDI collaborative project in Canada, Finland, Poland, and Spain. J Epidemiol Commun Health 2003;57:74-80.
17. Sichieri R, Coitinho DC, Leão MM, Recine E, Everhart JE. High temporal, geografic, and income variation in body mass index among adults in Brazil. Am J Public Health 1994;84(5):793-8.
18. Sichieri, R. Epidemiologia da obesidade. Rio de Janeiro: UERJ; 1998. p. 140.
19. Souci SW, Fachmann W, Draut H. Food composition and nutrition tables. 5th ed. Stuttgart: Medpharm Scientific; 1994.
20. Trichopoulou A, Naska A, and the DAFNE III Group. European food availability databank based on household budget surveys. Eur J Public Health 2003;13(3 Suppl):24-8.
21. Van Wymelbeke V, Beridot-Therond ME, de La Gueronniere V, Fantino M. Influence of repeated consumption of beverages containing sucrose or intense sweeteners on food intake. Eur J Clin Nutr 2004;58:154-61.
22. Vasdekis VGS, Stylianou S, Naska A. Estimation of age and gender-specific food availability from household budget survey data. Public Health Nutr 2001;4:1149-51.
23. World Health Organization. Food and Agriculture Organization [WHO/FAO]. Diet, nutrition and the prevention of chronic diseases. Geneva; 2003. [WHO - Technical Report Series, 916]
revealed by the present study are consistent with the growing participation of non-communicable chronic diseases in the morbidity and mortality profile of the Brazilian population and, particularly, with the
in-creases in the prevalence of overweight and obesity in this country, evident since the 1980’s,12,17 and once