Prevalence of chronic spinal pain and identiication
of associated factors in a sample of the population of
São Paulo, Brazil: cross-sectional study
Prevalência de dores de coluna crônicas e identiicação de fatores associados
em uma amostra da população da cidade de São Paulo, Brasil: estudo transversal
Jidiene Dylese Presecatan Depintor
I, Eduardo Sawaya Botelho Bracher
II, Dayane Maia Costa Cabral
III, José Eluf-Neto
IVDepartment of Preventive Medicine, Faculdade de Medicina da Universidade de São Paulo (FMUSP), São Paulo, SP, Brazil
ABSTRACT
CONTEXT AND OBJECTIVE: Chronic spinal pain, especially low-back pain and neck pain, is a leading cause of years of life with disability. The aim of the present study was to estimate the prevalence of chronic spinal pain among individuals aged 15 years or older and to identify the factors associated with it.
DESIGN AND SETTING: Cross-sectional epidemiological study on a sample of the population of the city of São Paulo.
METHOD: Participants were selected using random probabilistic sampling and data were collected via face-to-face interviews. The Hospital Anxiety and Depression Scale (HADS), EuroQol-5D, Alcohol Use Dis-orders Identiication Test (AUDIT), Fagerström test for nicotine dependence and Brazilian economic clas-siication criteria were used.
RESULTS: A total of 826 participants were interviewed. The estimated prevalence of chronic spinal pain was 22% (95% conidence interval, CI: 19.3-25.0%). The factors independently associated with chronic spi-nal pain were: female sex, age 30 years or older, schooling level of four years or less, symptoms compatible with anxiety and high physical exertion during the main occupation. Quality of life and self-rated health scores were signiicantly worse among individuals with chronic spinal pain.
CONCLUSION: The prevalence of chronic spinal pain in this segment of the population of São Paulo was 22.0%. The factors independently associated with chronic pain were: female sex, age 30 years or older, low education, symptoms compatible with anxiety and physical exertion during the main occupation.
RESUMO
CONTEXTO E OBJETIVO: A dor de coluna crônica, especialmente dor lombar e cervical, é uma causa importante de anos de vida com incapacidade. O objetivo deste estudo foi estimar a prevalência de algias vertebrais crônicas em indivíduos com 15 ou mais anos de idade e identiicar fatores associados.
TIPO DE ESTUDO E LOCAL: Estudo epidemiológico de corte transversal em uma amostra da população da cidade de São Paulo
MÉTODO: A seleção de participantes foi feita por amostragem probabilística aleatória e a colheita de dados, por entrevistas presenciais. Foram utilizadas a escala hospitalar de ansiedade e depressão (HADS), o EuroQol-5D, o teste de identiicação de desordens devido ao uso de álcool (AUDIT), o teste de Fagerström para dependência de nicotina e o critério de classiicação econômica Brasil.
RESULTADOS: Um total de 826 participantes foi entrevistado. A prevalência de algias vertebrais crônicas foi estimada em 22% (intervalo de coniança, IC 95%: 19,3-25,0). Os fatores independentemente asso-ciados com algias vertebrais crônicas foram: sexo feminino, 30 ou mais anos de idade, quatro anos ou menos de escolaridade, sintomas compatíveis com ansiedade e esforço intenso físico durante a ocupação principal. Participantes com algias vertebrais crônicas apresentaram escores de qualidade de vida e auto-avaliação de saúde signiicativamente piores.
CONCLUSÃO: A prevalência de algias vertebrais crônicas em um segmento da população de São Paulo foi de 22%. Os fatores independentemente associados à dor crônica foram: sexo feminino, idade igual ou superior a 30 anos, baixa escolaridade, sintomas compatíveis com ansiedade e esforço físico durante a ocupação principal.
IDC, MSc. Associate Professor, Instituto Paulista
de Pós-Graduação (IPPG), São Paulo, SP, Brazil.
IIMD, DC, PhD. Private Practice, Axis Clinica de
Coluna, São Paulo, SP, Brazil.
IIIDC, MSc. Associate Professor, Universidade
Anhembi Morumbi, São Paulo, SP, Brazil.
IVMD, PhD. Professor, Department of Preventive
Medicine, Faculdade de Medicina da Universidade de São Paulo (FMUSP), São Paulo, SP, Brazil.
KEY WORDS: Back pain. Chronic pain. Low back pain. Prevalence.
Cross-sectional studies.
INTRODUCTION
Spinal pain is one of the most commonly reported musculo-skeletal conditions.1 It has been estimated that 5-10% of cases of
spinal pain become chronic2,3 and one ith lead to pain-related
disability one year ater the irst pain episode.4 Low-back pain
and neck pain are the biggest and fourth biggest causes of years of life with disability worldwide, respectively, and the preva-lence of neck pain is surpassed only by major depressive disor-der and other musculoskeletal disordisor-ders.5
he International Association for the Study of Pain (IASP) deines chronic pain as pain that persists past the normal time of tissue healing. For nonmalignant pain, three months has been sug-gested as the most convenient point of division between acute and chronic pain. Chronic pain is a complex syndrome that involves biological, cognitive and lifestyle components.6,7 he American
College of Rheumatology classiication criteria for ibromyalgia deine chronic widespread pain (CWP) as pain in the let and right sides of the body, above and below the waistline, together with axial skeletal pain.8
Reviews of the literature on chronic pain have indicated that the prevalences of chronic neck pain, upper back pain and low-back pain range from 14.5% to 51%,9-15 10% to 20%11,12,16 and 15%
to 45%,1 respectively. In Brazil, one study reported that the
prev-alence of chronic spinal pain (CSP) was 19%,17 and three other
Brazilian studies reported prevalences of low-back pain ranging from 4.0 to 14.7%.18-20
Cultural and socioeconomic diferences and distinct criteria for classifying chronic pain have been described as factors afect-ing the prevalence estimates for chronic pain.21,22 Several studies
have used the duration of pain as the sole deinition of chronic pain, and while most studies have deined chronic pain as pain that lasts for three months,9,11,12,14,23,24 others have considered it to
be pain that persists for six or more months.10,20,25 Some studies
have also included additional criteria for CSP, such as the pres-ence of pain episodes over the last month and a score greater than or equal to 5 on a 0-10 visual analogue pain scale.25,26
Chronic spinal pain, especially low-back and neck pain, is usu-ally associated with other painful conditions27,28 and
psychologi-cal disorders.3,29 Female sex, greater age, low education levels, low
socioeconomic status, anxiety and depression are commonly asso-ciated with CSP.14,18,19,20,23
Chronic spinal pain is a common symptom within the com-munity and is associated with a signiicant impact on health. Understanding the epidemiology and impact of CSP is essential in developing public policies aimed towards prevention of spinal pain and health promotion.30
OBJECTIVE
In this study, we estimated the prevalence of CSP among individ-uals aged 15 years or older and identiied the factors associated
with it. We also compared the health-related quality of life of individuals with and without CSP and estimated the prevalence of CWP among individuals with CSP.
METHOD
his was a cross-sectional epidemiological study conducted in the central-western area of the city of São Paulo, Brazil, which is covered by the Family Health Program (FHP). he study was approved by the Research Ethics Committee of the University of São Paulo Medical School, the Research Ethics Committee of the São Paulo Municipal Health Department and the Research Ethics Committee of the Hospital Irmandade da Santa Casa de Misericórdia de São Paulo, which manages the “Dr. Alexandre Vranjac” Teaching Healthcare Center in Barra Funda, São Paulo. Permission to use the EuroQol-5D instrument was granted by the EuroQol group. All families residing in the study area were regis-tered at this healthcare center.
Population and sample
he community consisted of 8,052 individuals grouped into 2,549 families. Households were divided into 17 geographi-cally deined micro-areas, each consisting of approximately 150 households. For this study, the prevalence of chronic spinal pain was estimated at 16%, based on a recent study conducted at a primary healthcare unit in São Paulo.31 he sample size was
esti-mated as 482 individuals, considering a sampling error of 3% and a 95% conidence interval, but was then raised by 30% due to the expected losses, to a total of 627 individuals. Data collection for this study was conducted in conjunction with another study that evaluated the prevalence of chronic pain.32 hus, 820 individuals
were to be interviewed.
Participants were selected using a probability sampling method. In each micro-area, a number of households propor-tional to the size of the micro-area was selected using the random number generator function in the Excel sotware, version 2010.11. he Kish method was used to select one individual aged 15 years or older within each household. his method uses a pre-assigned table for each household, in which all residents are listed based on age and sex, relative to the head of the household. he member within the household to be interviewed is previously selected from the table to which the household has been assigned.33
same method described above. Re-draws were made to replace selected participants who were not interviewed.
A large number of foreigners from Bolivia, Paraguay and South Korea were found to be residing in the study area. Because of the language barrier and their reluctance to participate in the interview owing to their likely irregular status in the country, this group of individuals was excluded from the study.
Data collection and instruments
Home interviews were conducted by two authors and by pre-viously trained undergraduate students. A pilot study was con-ducted at a university practice ambulatory clinic to train inter-viewers and potentially improve the questionnaire.
In accordance with the criteria from the International Association of Pain, chronic pain was deined as persistent pain for three or more months.6 In order to avoid selecting
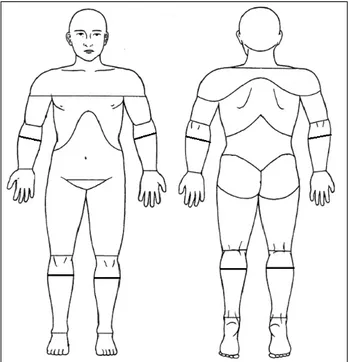
partic-ipants with low-frequency chronic pain, particpartic-ipants needed to report at least one pain episode in the previous month. Respondents with chronic pain were asked to indicate all their painful regions, by marking them on a diagram representing the front and back views of a human igure. We used a modiied version of the Brief Pain Inventory, which originally divided the human body into 45 regions.34 In our study, the diagram was
divided into 59 regions (Figure 1).
Respondents were asked to indicate the main location of pain, i.e. the area that hurt the most, by marking the diagram in Figure 1 with an arrow. Individuals with CSP were deined as those who indicated areas corresponding to the cervical, thoracic or lumbar regions, whether or not those were the main sites of pain.
Low-back pain was deined as pain localized in the region bounded by the twelth rib, superiorly; the gluteal line, inferiorly; and the anterior axillary line, anteriorly. Neck pain was deined as pain localized in the region bounded by the lower edge of the occipital bone, superiorly; the spine of the scapula, inferiorly; and the anterior edge of the sternocleidomastoid muscle, anteriorly. Upper back pain was deined as pain in the posterior part of the chest between the irst thoracic vertebrae and the upper contour of the trapezius muscle, superiorly; the twelth thoracic vertebrae and the lower edge of the twelth ribs, inferiorly; and the right and let axillary line, laterally.35
Chronic widespread pain (CWP) was deined as pain in the let and right side of the body, above and below the waistline. Axial skeletal pain was deined as pain in any of the following regions: neck, anterior or posterior part of the chest, or lower back8. Participants with chronic pain who did not have CWP
were classiied as having chronic regional pain (CRP).
he interview included questions asking for personal and sociodemographic information and administration of a pain questionnaire. Information on the presence of comorbidities was obtained through self-reporting. Additionally, four health assess-ment scales that had previously been validated and culturally adapted to the Brazilian cultural context, and one socioeconomic status scale, were applied.
Symptoms consistent with anxiety and depression were assessed using the Hospital Anxiety and Depression Scale (HADS).36 HADS was developed to assess non-psychiatric patients
in diferent populations and has 14 items, seven of which relate to anxiety and seven to depression.37,38 Each item on the
question-naire was scored from 0 to 3 for a maximum score of 21 for either anxiety or depression. In our study, a cutof of 9/21 points was established for symptoms of either anxiety or depression.37
Health-related quality of life was assessed by means of the EuroQol-5D (EQ-5D) instrument. EQ-5D includes questions about the following ive dimensions: mobility, self-care, usual activities, pain/discomfort and anxiety/depression. he inal score (EQ-index) combines the ive dimensions and ranges from 0 (worst quality of life) to one (best quality of life). In addition, the respondent’s self-rated health is recorded on a visual analogue scale (VAS) numbered from 0 to 100, where 100 means the ‘best imaginable health state’ and 0 means the ‘worst imaginable health state’.39
he Fagerström Test for Nicotine Dependence (FTND) was used to assess the severity of nicotine dependence. his instru-ment contains six questions and respondents are assigned to one of ive dependence levels.40,41
Alcohol use was assessed using the Alcohol Use Disorders Identiication Test (AUDIT). AUDIT consists of 10 questions: three about hazardous alcohol use, three about dependence symptoms and four about harmful alcohol use. he inal scores are grouped into four levels of risk.42
he participants’ socioeconomic status was assessed by means of the Brazilian Economic Classiication Criteria (CCEB), which classify the population into ive socioeconomic categories from A to E, based on ownership of a range of durable assets and the head-of-household’s education level.43
he participants answered all of these questionnaires, except the FTND, which was answered by smokers only.
Statistical analysis
Descriptive analyses on the median, mean, standard deviation and percentage were used to establish the demographic and clinical characteristics of the sample. he CSP prevalence and its 95% con-idence interval (CI) were determined. he association between CSP and the selected variables was estimated using prevalence ratios and their 95% CI.
We used a Cox regression model with constant time and robust variance.44 Cox regression is commonly used to analyze
time-to-event data. When a constant risk period (time = 1) is assigned to all subjects, the hazard ratio estimated by Cox regres-sion equals the prevalence ratio in cross-sectional studies.45
In bivariate analyses, statistical associations were deter-mined by means of the log-rank test. For ordinal variables, we used the chi-square test for trend. Variables with a P-value < 0.20 in bivariate analyses were selected for multivariate analysis. Multivariate models were constructed by adding variables one at a time through forward stepwise addition, starting from the vari-able with the lowest P-value, followed by the other varivari-ables with P < 0.20. Variables with a P-value < 0.05 according to the maxi-mum likelihood ratio test were retained in the inal model. Lastly, we estimated the PR and 95% CI for each variable in the inal model. Data were considered signiicant at P < 0.05.
he analyses were performed using the STATA 13.0 sotware (StataCorp LP, College Station, Texas, USA).
RESULTS
Characteristics of the source population and response rate A total of 6,297 individuals aged 15 years or older were included, and most of them (3,666; 58.2%) were women. A total of 1,385 households (54.3% of the registered families) were selected to par-ticipate in the study, and one person from each household was selected for the interview. Of the selected individuals, 559 were not interviewed for the following reasons: they were ineligible (n = 277), were not located (n = 220), declined participation in the interview (n = 60) or were deemed dangerous to be interviewed (n = 2). he ineligible individuals were considered thus because they had moved (n = 192), were foreigners (n = 64), were incapable of answering (n = 15), or had died (n = 6). hus, approximately three quarters of all the eligible individuals selected were interviewed (n
= 826; 74.5%). Re-draws were made to replace all the eligible par-ticipants who had not been interviewed.
Characteristics of the sample
In total, 826 individuals were interviewed between December 2011 and February 2012. he respondents’ mean age was 51.4 ± 19.3 years. Most respondents were women (69.0%), single (62.2%) and had completed eight or more years of education (55.2%). Nearly half (48.9%) of the respondents reported sufering from at least one illness, 50.8% were employed at the time of the interview and most (93.7%) reported performing no hard physical activity during the workday. he vast majority of the respondents were of socioeco-nomic levels B or C (86%) (Table 1).
Symptoms consistent with anxiety and depression were observed in 189 (22.9%) and 96 (11.6%) respondents, respec-tively. Only 2.2% (14/637) of the individuals without anxiety symptoms had depression, whereas 43.4% (82/189) of the respon-dents with anxiety symptoms had depression. Most responrespon-dents were non-smokers (81.1%) and only 7.6% had high or very high nicotine dependence. Possible alcohol dependence, harmful use of alcohol or hazardous drinking was observed in 8.5% of the respondents (Table 1).
Prevalence and characteristics of chronic back pain
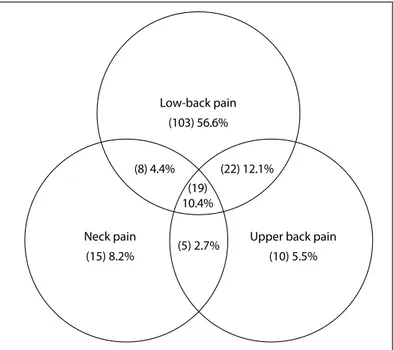
Chronic spinal pain, deined as persistent pain in the cervical, thoracic or lumbar spine lasting three or more months and at least one pain episode in the last month, was reported by 182 individuals, corresponding to a prevalence of 22.0% (95% CI: 19.3-25.0%). he prevalence of CSP was signiicantly higher among women (25.8%; 95% CI: 22.2-29.6%) than among men (13.7%; 95% CI: 9.7-18.5; P < 0.001). Chronic low-back pain was reported by 152 individuals, corresponding to a prevalence of 18.4% (95% CI: 15.8-21.2%). Additionally, upper back pain and neck pain were reported by 56 and 47 individuals, respec-tively, corresponding to prevalences of 6.8% (95% CI: 5.2-8.7%) and 5.7% (95% CI: 4.2-7.5%), respectively. he sum of individu-als with cervical, thoracic or lumbar pain exceeded the number of individuals with CSP because 54 respondents reported pain in more than one area (Figure 2). he individuals with CSP indi-cated 7.3 ± 7.2 painful regions and the mean duration of pain was 6.6 ± 8.6 years (median: 4.0 years.).
he prevalences of CRP and CWP among the individuals with CSP were 16.7% (95% CI: 14.2-19.3%) and 5.3% (95% CI: 3.8-6.9%), respectively. More than three quarters of the respon-dents with CSP had CRP (75.8%) and approximately one quarter had CWP (24.2%).
signiicantly lower among individuals with CSP (65.2 ± 21.5) than among individuals without CSP (78.8 ± 18.8; P < 0.001).
Factors associated with chronic back pain
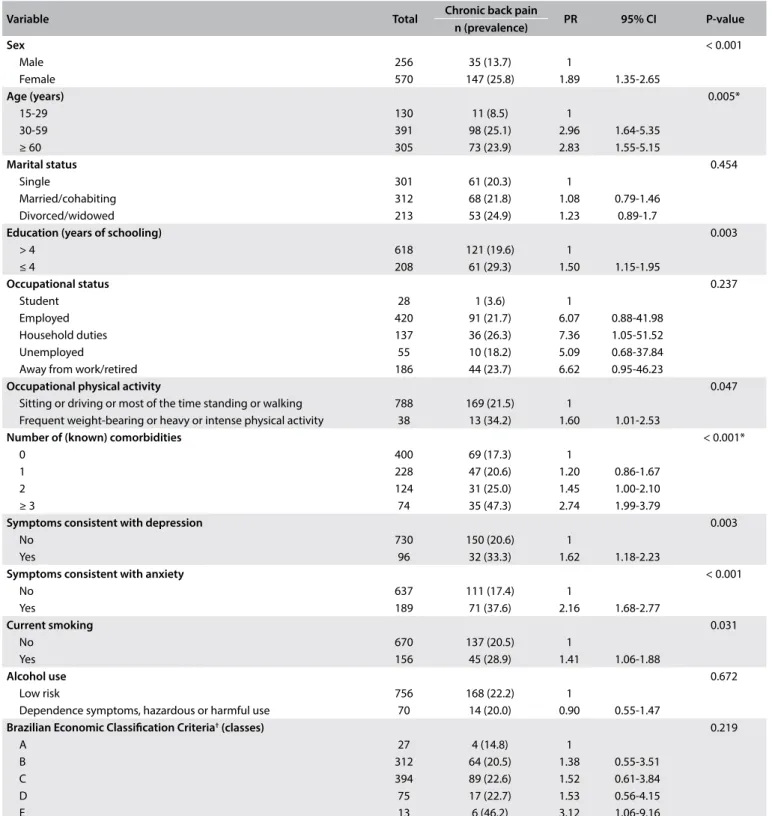
he following variables were selected for bivariate analysis: sex, number of comorbidities, symptoms consistent with anxiety, education, symptoms consistent with depression, age, smoking and occupational physical activity (Table 2).
Occupational physical activity was dichotomized in the mul-tivariate analysis to increase its statistical power. In the inal model, sex, age, education, anxiety symptoms and occupational physical activity were independently associated with CSP. he prevalence of CSP was higher among women, individuals aged 30 years or older, individuals who had low education, those who had anxiety symptoms and those who reported performing hard physical activity during the workday (Table 3).
DISCUSSION
Prevalence and characteristics of chronic back pain
his study found that the estimated prevalence of chronic spinal pain was 22.0% (95% CI: 19.3-25.0%) in a sample of the popula-tion of São Paulo, Brazil. he separate prevalence estimates for low-back pain, upper low-back pain and neck pain were 18.4, 6.8 and 5.7%, respectively. Five factors were independently associated with CSP: female sex, age ≥ 30 years, education ≤ 4 years, anxiety symptoms and regular weight-bearing or heavy or intense physical activ-ity during the workday. he prevalences of chronic regional pain (CRP) and chronic widespread pain (CWP) among individuals
Variable n %
Sex
Male 256 31.0
Female 570 69.0
Age (years)
15-29 130 15.8
30-59 391 47.3
≥ 60 305 36.9
Marital status
Single 301 36.4
Married/cohabiting 312 37.8
Divorced/widowed 213 25.8
Education (years)
0-4 208 25.2
5-8 162 19.6
9-11 298 36.1
12-14 44 5.3
≥ 15 114 13.8
Occupational status
Currently employed 420 50.8
Retired 176 21.3
Household duties 137 16.6
Unemployed 55 6.7
Student 28 3.4
Away from work 10 1.2
Occupational physical activity
Sitting or driving or most of the time standing
or walking 788 95.4
Frequent weight-bearing or heavy or intense
physical activity 38 4.6
Number of comorbidities
0 400 48.4
1 228 27.6
2 124 15.0
≥ 3 74 9.0
Symptoms consistent with depression
No 730 88.4
Yes 96 11.6
Symptoms consistent with anxiety
No 637 77.1
Yes 189 22.9
Current smoking
No 670 81.1
Yes 156 18.9
Alcohol use
Low risk 756 91.5
Dependence symptoms, hazardous or harmful use 70 8.5
Socioeconomic level*
A 27 3.3
B 312 38.0
C 394 48.0
D 75 9.1
E 13 1.6
Table 1. Characteristics of the sample
*5 individuals without data.
Low-back pain (103) 56.6%
(8) 4.4% (22) 12.1%
(19) 10.4%
Neck pain
(15) 8.2% (5) 2.7%
Upper back pain (10) 5.5%
with CSP were 16.7% and 5.3%, respectively. In addition, self-rated quality of life and health were signiicantly worse among individu-als with CSP than among individuindividu-als without CSP.
Most epidemiological studies have investigated the preva-lence of neck pain, upper back pain, or low-back pain separately,
and few studies have estimated the prevalence of chronic pain in the entire spine. Comparisons of epidemiological data on the prevalence of chronic pain in the cervical, thoracic and lumbar regions may be hindered by the lack of studies that consider the spine as a functional unit.46
Variable Total Chronic back pain PR 95% CI P-value n (prevalence)
Sex < 0.001
Male 256 35 (13.7) 1
Female 570 147 (25.8) 1.89 1.35-2.65
Age (years) 0.005*
15-29 130 11 (8.5) 1
30-59 391 98 (25.1) 2.96 1.64-5.35
≥ 60 305 73 (23.9) 2.83 1.55-5.15
Marital status 0.454
Single 301 61 (20.3) 1
Married/cohabiting 312 68 (21.8) 1.08 0.79-1.46
Divorced/widowed 213 53 (24.9) 1.23 0.89-1.7
Education (years of schooling) 0.003
> 4 618 121 (19.6) 1
≤ 4 208 61 (29.3) 1.50 1.15-1.95
Occupational status 0.237
Student 28 1 (3.6) 1
Employed 420 91 (21.7) 6.07 0.88-41.98
Household duties 137 36 (26.3) 7.36 1.05-51.52
Unemployed 55 10 (18.2) 5.09 0.68-37.84
Away from work/retired 186 44 (23.7) 6.62 0.95-46.23
Occupational physical activity 0.047
Sitting or driving or most of the time standing or walking 788 169 (21.5) 1
Frequent weight-bearing or heavy or intense physical activity 38 13 (34.2) 1.60 1.01-2.53
Number of (known) comorbidities < 0.001*
0 400 69 (17.3) 1
1 228 47 (20.6) 1.20 0.86-1.67
2 124 31 (25.0) 1.45 1.00-2.10
≥ 3 74 35 (47.3) 2.74 1.99-3.79
Symptoms consistent with depression 0.003
No 730 150 (20.6) 1
Yes 96 32 (33.3) 1.62 1.18-2.23
Symptoms consistent with anxiety < 0.001
No 637 111 (17.4) 1
Yes 189 71 (37.6) 2.16 1.68-2.77
Current smoking 0.031
No 670 137 (20.5) 1
Yes 156 45 (28.9) 1.41 1.06-1.88
Alcohol use 0.672
Low risk 756 168 (22.2) 1
Dependence symptoms, hazardous or harmful use 70 14 (20.0) 0.90 0.55-1.47
Brazilian Economic Classiication Criteria† (classes) 0.219
A 27 4 (14.8) 1
B 312 64 (20.5) 1.38 0.55-3.51
C 394 89 (22.6) 1.52 0.61-3.84
D 75 17 (22.7) 1.53 0.56-4.15
E 13 6 (46.2) 3.12 1.06-9.16
Table 2. Univariate analysis on the association between chronic spinal pain and associated factors
he estimated prevalence of CSP found in this study was similar to that reported by a recent study conducted in Brazil, which found a prevalence of 19%.17 To our knowledge, no other
Brazilian studies have examined the prevalence of chronic pain in the spine, considering the lumbar, thoracic and cervical spine as a single functional unit. he prevalence of chronic pain reported in our study for diferent spinal regions was similar to that reported in epidemiological surveys that categorized CSP into low-back pain, neck pain and upper back pain.1,11,12,16
he mean duration of pain of 6.6 ± 8.6 years was similar to the duration reported by other epidemiological surveys on the preva-lence of chronic neck pain or low-back pain, which also indicated pain of long duration.47-49 he prevalence of CWP among
individ-uals with CSP in this study (5.3%; 95% CI: 3.8-6.9%) was slightly lower than the values reported by other studies on the prevalence of chronic pain in the general population, in which the prevalence estimates for CWP have ranged from 10-13%.50,51 A recent study
on the prevalence of widespread pain among female primary healthcare patients reported that 28% of women with chronic low-back pain had CWP,52 higher than the prevalence of CWP
among individuals with CSP in the present study.
Multivariate analysis
Female sex was independently associated with CSP. his inding is consistent with several epidemiological surveys on the prevalence
of back pain and chronic pain.14,17-19,46,48,53-55 he greater
preva-lence of pain among women than among men may be related to cognitive and social factors. Moreover, the higher prevalence of pain among women may be a result of reporting bias, given that several studies have suggested that women are more likely to report pain than men.56
he prevalence of CSP was higher among individuals aged 30 years or older and was lower in the 60+ age group than in the 30 to 59-year age group. Several studies have reported that there is greater prevalence of chronic pain with increasing age.8,10-15
An increase in the prevalence of CSP with age has been attributed to several factors, including the increased number of comorbidi-ties and the presence of age-related changes in the musculoskel-etal system.57,58 Conversely, some studies have reported a slight
reduction in the prevalence of low-back and neck pain ater the seventh decade of life.18,59 he reasons for this decline of
pain remain unclear, but it is possibly related to reporting bias, because back pain may be perceived as a natural part of growing older, as other age-related diseases become apparent, thus lead-ing to underreportlead-ing of pain.60
Four years of education or less was independently associated with CSP. Conversely, we did not ind any association between socioeconomic status and CSP. Two epidemiological surveys conducted in Brazil found that chronic pain was associated with education level, but not with socioeconomic status.6,61 Several
studies have found an association of general chronic pain, and CSP in particular, with low education.8,10-15,18-20,23 On the other
hand, others have shown that less educated people are more likely to be afected by disabling back pain.62,63
Symptoms of anxiety and depression were positively asso-ciated with CSP. However, only anxiety symptoms remained independently associated with CSP in the multivariate model. he prevalence of symptoms consistent with anxiety (22.9%) or depression (11.6%) among individuals with CSP in our study was comparatively higher than estimates from other studies on chronic spinal pain. A multicenter study on mental disorders among individuals with chronic back or neck pain reported prev-alences of depression and anxiety ranging from 2.5 to 15.7% and from 0.5 to 8.7%, respectively.64 Unlike in our study, an
associ-ation between chronic pain and depression has been reported more frequently than an association between chronic pain and other emotional disorders, including anxiety.64
Intense physical activity or frequent weight-bearing during the workday were independently associated with CSP. Similar indings have been reported for low-back pain.10,18,65 Eriksen et
al.10 reported that individuals with jobs that required intense
physical efort and frequent weight-bearing activities were more likely to be afected by chronic pain than those with a sed-entary occupation (OR: 2.2; 95% CI: 1.6-3.1). Conversely, other
Variable PRcr PRadj (95% CI) P-value
Sex 0.001
Male 1 1
Female 1.89 1.79 (1.28-2.5)
Age (years) 0.03*
15-29 1 1
30-59 2.96 2.89 (1.6-5.2) ≥ 60 2.83 2.44 (1.33-4.47)
Symptoms consistent with anxiety < 0.001
No 1 1
Yes 2.16 1.99 (1.55-2.54)
Education (years of schooling) 0.039
> 4 1 1
≤ 4 1.50 1.32 (1.01-1.71)
Physical exertion level of current occupation 0.006 Sitting or driving or most
of the time, standing or walking
1 1
Frequent weight-bearing or heavy or intense physical activity
1.60 1.36 (1.09-1.69) Table 3. Prevalence ratios for variables independently associated with chronic spinal pain through the Cox
multivariate regression model with robust variance estimation
studies have suggested that mechanical factors such as liting and carrying do not play a major role in the pathophysiology of back pain.66
Study limitations
he limitations of the current study need to be noted. Firstly, the cross-sectional design cannot be used to infer a causal relation-ship between the factors studied and back pain. he sample size was estimated to calculate the prevalence of CSP and therefore it might not have been suicient to identify associated factors. Secondly, because we sampled individuals from a speciic region of São Paulo, it may not be possible to directly extrapolate our results to the entire population of the city. Additionally, the portion of female respondents (69.0%) was higher than the pro-portion of women in the source population (58.2%). A higher proportion of women than of men has oten been observed in population-based studies on chronic pain16,54,61,67,68 and back
pain,46,13,16-18 which may lead to overestimation of the prevalence
of pain. In our study, the higher proportion of women in the sam-ple can be explained by the fact that 59% of the source popula-tion consisted of women. Moreover, most households were com-posed of one or two members only, and 69% of the members of these households were women. hus, when a selected man was not interviewed, he was more likely to be replaced by a woman in a subsequent draw.
he strengths of the current study should also be noted. We used a rigorous method for participant selection. Our use of a sample from a population registered with a healthcare unit enabled us to gain access to sociodemographic information for proper planning of data collection. Telephone and letter-based interviews are the two most common types of interview used in epidemiological surveys on the prevalence of back pain, whereas home interviews are rarely used.15,18,20 Our use of home
inter-views may have improved the reliability of data collection. For each household, we were careful to make home visits at difer-ent times of the day and on diferdifer-ent days of the week, including weekends, in an attempt to meet with participants who worked. he repeated visits resulted in a relatively high response rate (74.5%) for eligible individuals. Our use of ive validated health-related quality of life instruments (depression, anxiety, alcohol use, smoking, quality of life and socioeconomic status) provided reliable data on the factors associated with CSP.
CONCLUSION
his was the irst epidemiological study to estimate the preva-lence of chronic spinal pain in the largest city in Latin America. he prevalence of CSP in our sample was 22.0%. he fac-tors independently associated with the outcome variable were female sex, age 30 years and older, low education level, anxiety
symptoms and high occupational physical activity. Our sugges-tions for future research include a more detailed investigation of subgroups of people with chronic spinal pain, in order to identify those who are more likely to develop more severe conditions or who have greater demand for healthcare services.
REFERENCES
1. Manchikanti L, Singh V, Datta S, et al. Comprehensive review of epidemiology, scope, and impact of spinal pain. Pain Physician. 2009;12(4):E35-70.
2. Cassidy JD, Carroll LJ, Côté P. The Saskatchewan health and back pain survey. The prevalence of low back pain and related disability in Saskatchewan adults. Spine (Phila Pa 1976). 1998;23(17):1860-6; discussion 1867.
3. Côté P, Cassidy JD, Carroll L. The Saskatchewan Health and Back Pain Survey. The prevalence of neck pain and related disability in Saskatchewan adults. Spine (Phila Pa 1976). 1998;23(15):1689-98. 4. Von Korf M. Studying the natural history of back pain. Spine (Phila Pa
1976). 1994;19(18 Suppl):2041S-2046S.
5. Murray CJ, Lopez AD. Measuring the global burden of disease. N Engl J Med. 2013;369(5):448-57.
6. Merskey H, Bogduk N. Introduction. In: Merskey H, Bogduk N. Classiication of chronic pain: descriptions of chronic pain syndromes and deinition of pain terms. 2nd ed. Seattle: IASP press; 1994. p. ix-xv.
7. Cruz DALM, Pimenta CAM. Avaliação do doente com dor crônica em consulta de enfermagem: proposta de instrumento segundo diagnósticos de enfermagem [Evaluation of patients with chronic pain in nursing consultations: proposal of an instrument according to nursing diagnoses]. Rev Latino-Am Enfermagem. 1999;7(3):49-62. 8. Wolfe F, Smythe HA, Yunus MB, et al. The American College of
Rheumatology 1990 criteria for the Classiication of Fibromyalgia. Report of Multicenter Criteria Committee. Arthritis Rheum. 1990;33(2):160-72.
9. Parsons S, Breen A, Foster NE, et al. Prevalence and comparative troublesomeness by age of musculoskeletal pain in diferent body locations. Fam Pract. 2007;24(4):308-16.
10. Eriksen J, Jensen MK, Sjøgren P, Ekholm O, Rasmussen NK. Epidemiology of chronic non-malignant pain in Denmark. Pain. 2003;106(3):221-8.
11. Bergman S, Herrström P, Högström K, et al. Chronic musculoskeletal pain, prevalence rates, and sociodemographic associations in a Swedish population study. J Rheumatol. 2001;28(6):1369-77. 12. Azevedo LF, Costa-Pereira A, Mendonça L, Dias CC, Castro-Lopes JM.
Epidemiology of chronic pain: a population-based nationwide study on its prevalence, characteristics and associated disability in Portugal. J Pain. 2012;13(8):773-83.
14. Jiménez-Sánchez S, Fernández-de-Las-Peñas C, Carrasco-Garrido P, et al. Prevalence of chronic head, neck and low back pain and associated factors in women residing in the Autonomous Region of Madrid (Spain). Gac Sanit. 2012;26(6):534-40.
15. Guez M, Hildingsson C, Nilsson M, Toolanen G. The prevalence of neck pain: a population-based study from northern Sweden. Acta Orthop Scand. 2002;73(4):455-9.
16. Sá K, Baptista AF, Matos MA, Lessa I. Prevalência de dor crônica e fatores associados na população de Salvador, Bahia [Prevalencia de dolor crónico y factores asociados en la población de Salvador, Bahia]. Rev Saúde Pública. 2009;43(4):622-30.
17. Ferreira GD, Silva MC, Rombaldi AJ, et al. Prevalência de dor nas costas e fatores associados em adultos do sul do Brasil: estudo de base populacional [Prevalence and associated factors of back pain in adults from southern Brazil: a population-based study]. Rev Bras Fisioter. 2011;15(1):31-6.
18. Silva MC, Fassa AG, Valle NCJ. Dor lombar crônica em uma população adulta no Sul do Brasil: prevalência e fatores associados [Chronic low back pain in a Southern Brazilian adult population: prevalence and associated factors]. Cad Saúde Pública. 2004;20(2):377-85.
19. Meucci RD, Fassa AG, Paniz VMV, Silva MC, Wegman DH. Increase of chronic low back pain prevalence in a medium-sized city of southern Brazil. BMC Musculoskeletal Disord. 2013;14:155.
20. Almeida ICGB, Sá KN, Silva M, et al. Prevalência de dor lombar crônica na população da cidade de Salvador [Chronic low back pain prevalence in the population of the city of Salvador]. Rev Bras Ortop. 2008;43(3):96-102.
21. Farrar JT, Portenoy RK, Berlin JA, Kinman JL, Strom BL. Deining the clinically important diference in pain outcome measures. Pain. 2000;88(3):287-94.
22. Burgoyne DS. Prevalence and economic implications of chronic pain. Manag Care. 2007;16(2 Suppl 3):2-4.
23. Smith BH, Elliott AM, Hannaford PC; Royal College of General Practitioners’ Oral Contraception Study. Is chronic pain a distinct diagnosis in primary care? Evidence arising from the Royal College of the General Practitioners’ Oral Contraception study. Fam Pract. 2004;21(1):66-74.
24. Picavet HS, Schouten JS. Musculoskeletal pain in the Netherlands: prevalences, consequences and risk groups, the DMC(3)-study. Pain. 2003;102(1-2):167-78.
25. Breivik H, Collett B, Ventafridda V, Cohen R, Gallacher D. Survey of chronic pain in Europe: prevalence, impact on daily life, and treatment. Eur J Pain. 2006;10(4):287-333.
26. Blyth FM, March LM, Brnabic AJ, et al. Chronic pain in Australia: a prevalence study. Pain. 2001;89(2-3):127-34.
27. Raspe A, Matthis C, Héon-Klin V, Raspe H. [Chronic back pain: more than pain in the back. Findings of a regional survey among insurees of a workers pension insurance fund]. Rehabilitation (Stuttg). 2003;42(4):195-203.
28. Carroll LJ, Cassidy JD, Côté P. Depression as a risk factor for onset of an episode of troublesome neck and low back pain. Pain. 2004;107(1-2):134-9. 29. Currie SR, Wang J. Chronic back pain and major depression in the
general Canadian population. Pain. 2004;107(1-2):54-60.
30. Deyo RA, Dworkin SF, Amtmann D, et al. Report of the NIH Task Force on research standards for chronic low back pain. J Pain. 2014;15(6):569-85.
31. Bracher ES, Pietrobon R, Eluf-Neto J. Cross-cultural adaptation and validation of a Brazilian Portuguese version of the chronic pain grade. Qual Life Res. 2010;19(6):847-52.
32. Cabral DM, Bracher ES, Depintor JD, Eluf-Neto J. Chronic pain prevalence and associated factors in a segment of the population of São Paulo city. J Pain. 2014;15(11):1081-91.
33. Kish L. Survey sampling. New York: Wiley; 1965.
34. Cleeland CS, Ryan KM. Pain assessment: global use of the Brief Pain Inventory. Ann Acad Med Singapore. 1994;23(2):129-38.
35. UK BEAM Trial Team. United Kingdom back pain exercise and manipulation (UK BEAM) randomised trial: cost efectiveness of physical treatments for back pain in primary care. BMJ. 2004;329(7479):1381.
36. Zigmond AS, Snaith RP. The hospital anxiety and depression scale. Acta Psychiatr Scand. 1983;67(6):361-70.
37. Bjelland I, Dahl AA, Haug TT, Neckelmann D. The validity of the Hospital Anxiety and Depression Scale. An updated literature review. J Psychosom Res. 2002;52(2):69-77.
38. Castro MMC, Quarantini L, Batista-Neves S, et al. Validade da escala hospitalar de ansiedade e depressão em pacientes com dor crônica [Validity of the hospital anxiety and depression scale in patients with chronic pain]. Rev Bras Anestesiol. 2006;56(5):470-7.
39. Reenen MV, Janssen B. EQ-5D-5L User Guide. Basic information on how to use the EQ-5D-5L instrument. Available from: http://www. euroqol.org/fileadmin/user_upload/Documenten/PDF/Folders_ Flyers/EQ-5D-5L_UserGuide_2015.pdf. Accessed in 2016 (Sep 12). 40. Carmo JT, Pueyo AA. A adaptação ao português do Fagerström
test for nicotine dependence (FTND) para avaliar a dependência e tolerância à nicotina em fumantes brasileiros [Adaptation into portuguese for the Fagerström test for nicotine dependence (FTND) to evaluate the dependence and tolerance for nicotine in brazilian smokers]. RBM Rev Bras Med. 2002;59(1/2):73-80.
41. Meneses-Gaya IZ, Zuardi AW, Loureiro SR, Crippa JAS. As propriedades psicométricas do Teste de Fagerström para Dependência de Nicotina [Psychometric properties of the Fagerström Test for Nicotine Dependence]. J Bras Pneumol. 2009;35(1):73-82.
42. Méndez EB. Uma versão Brasileira do AUDIT (Alcohol use Disorders Identiication Test) [dissertation]. Pelotas: Universidade Federal de Pelotas; 1999.
44. Barros AJ, Hirakata VN. Alternatives for logistic regression in cross-sectional studies: an empirical comparison of models that directly estimate the prevalence ratio. BMC Med Res Methodol. 2003.3:21. 45. Lin DY, Wei LJ. The robust inference for the Cox Proportional
Hazards Model. Journal of the American Statistical Association. 1989;84(408):1074-8.
46. Leboeuf-Yde C, Nielsen J, Kyvik KO, Fejer R, Hartvigsen J. Pain in the lumbar, thoracic or cervical regions: do age and gender matter? A population-based study of 34,902 Danish twins 20-71 years of age. BMC Musculoskeletal Disord. 2009;10:39.
47. Manchikanti L, Singh V, Kloth D, et al. Interventional techniques in the management of chronic pain: Part 2.0. Pain Physician. 2001;4(1):24-96. 48. Goode AP, Freburger J, Carey T. Prevalence, practice patterns, and
evidence for chronic neck pain. Arthritis Care Res (Hoboken). 2010;62(11):1594-601.
49. Guez, M. Chronic neck pain. An epidemiological, psychological and SPECT study with emphasis on whiplash-associated disorders. Acta Orthop Suppl. 2006;77(320):preceding 1, 3-33.
50. Croft P, Rigby AS, Boswell R, Schollum J, Silman A. The prevalence of chronic widespread pain in the general population. J Rheumatol. 1993;20(4):710-3.
51. Portenoy RK, Ugarte C, Fuller I, Haas G. Population-based survey of pain in the United States: diferences among white, African American, and Hispanic subjects. J Pain. 2004;5(6):317-28.
52. Nordeman L, Gunnarsson R, Mannerkorpi K. Prevalence and characteristics of widespread pain in female primary health care patients with chronic low back pain. Clin J Pain. 2012;28(1):65-72. 53. Fillingim RB, King CD, Ribeiro-Dasilva MC, Rahim-Williams B, Riley JL
3rd. Sex, gender, and pain: a review of recent clinical and experimental indings. J Pain. 2009;10(5):447-85.
54. DePalma MJ, Ketchum JM, Saullo TR. Multivariable analyses of the relationships between age, gender, and body mass index and the source of chronic low back pain. Pain Med. 2012;13(4):498-506. 55. Skillgate E, Magnusson C, Lundberg M, Hallgvist J. The age- and
sex-speciic occurrence of bothersome neck pain in the general population--results from the Stockholm public health cohort. BMC Musculoskelet Disord. 2012;13:185.
56. Racine M, Tousignant-Lalamme Y, Kloda LA, et al. A systematic literature review of 10 years of research on sex/gender and experimental pain perception - part 1: are there really diferences between women and men? Pain. 2012;153(3):602-18.
57. Mitchell C. Assessment and management of chronic pain in elderly people. Br J Nurs. 2001;10(5):296-304.
58. Sofaer-Bennett B, Schoield P, Cameron PA. Chronic pain in older people. Midlife and Beyond. 2012;42:13-21. Available from: http:// www.cpaqv.org/afai/bennett.pdf. Accessed in 2016 (Jul 5).
59. Skovron ML. Epidemiology of low back pain. Baillieres Clin Rheumatol. 1992:6(3):559-73.
60. Deyo RA, Tsui-Wu YJ. Descriptive epidemiology of low-back pain and its related medical care in the United States. Spine (Phila Pa 1976). 1987;12(3):264-8.
61. de Moraes Vieira EB, Garcia JB, da Silva AA, Mualem Araújo RL, Jansen RC. Prevalence, characteristics, and factors associated with chronic pain with and without neuropathic characteristics in São Luís, Brazil. J Pain Symptom Manage. 2012;44(2):239-51.
62. Dionne CE, Von Korf M, Koepsell TD, et al. Formal education and back pain: a review. J Epidemiol Community Health. 2001;55(7):455-68. 63. Frymoyer JW, Cats-Baril W. Predictors of low back pain disability. Clin
Orthop Relat Res. 1987;(221):89-98.
64. Demyttenaere K, Brufaerts R, Lee S, et al. Mental disorders among persons with chronic back or neck pain: results from the World Mental Health Surveys. Pain. 2007;129(3):332-42.
65. Lefevre-Colau MM, Fayad F, Rannou F, et al. Frequency and interrelations of risk factors for chronic low back pain in a primary care setting. PLos One. 2009;4(3):e4874.
66. Balagué F, Mannion AF, Pellisé F, Cedraschi C. Non-speciic low back pain. Lancet. 2012;379(9814):482-91.
67. Wong WS, Fielding R. Prevalence and characteristics of chronic pain in the general population of Hong Kong. J Pain. 2011;12(2):236-45. 68. Johannes CB, Le TK, Zhou X, Johnston JA, Dworkin RH. The prevalence
of chronic pain in United States adults: results of an Internet-based survey. J Pain. 2010;11(11):1230-9.
Master’s thesis submitted to the Department of Preventive Medicine, Faculdade de Medicina da Universidade de São Paulo (FMUSP) on June 2, 2015
Sources of funding: None
Conlict of interest: None
Date of irst submission: April 10, 2016
Last received: May 19, 2016
Accepted: May 31, 2016
Address for correspondence:
Eduardo Sawaya Botelho Bracher Av. Professor Fonseca Rodrigues, 755 São Paulo (SP) — Brasil