Alexandre Dias Porto Chiavegatto FilhoI,II
Sabina Léa Davidson GotliebI
Ichiro KawachiII
I Departamento de Epidemiologia. Faculdade de Saúde Pública. Universidade de São Paulo. São Paulo, SP, Brasil
II Department of Society, Human
Development and Health. Harvard School of Public Health. Harvard University. Boston, MA, United States
Correspondence:
Alexandre Dias Porto Chiavegatto Filho 401 Park Drive
Landmark Center, 4th Floor Boston, Massachusetts 02215 E-mail: [email protected] Received: 4/7/2011
Approved: 3/5/2012
Article available from: www.scielo.br/rsp
Cause-specifi c mortality and
income inequality in São Paulo,
Brazil
Mortalidade segundo causas
básicas e desigualdade de renda no
Município de São Paulo
ABSTRACT
OBJECTIVE: To analyze cause-specifi c mortality rates according to the relative income hypothesis.
METHODS: All 96 administrative areas of the city of São Paulo, southeastern Brazil, were divided into two groups based on the Gini coeffi cient of income inequality: high (≥0.25) and low (<0.25). The propensity score matching method was applied to control for confounders associated with socioeconomic differences among areas.
RESULTS: The difference between high and low income inequality areas was statistically signifi cant for homicide (8.57 per 10,000; 95%CI: 2.60;14.53); ischemic heart disease (5.47 per 10,000 [95%CI 0.76;10.17]); HIV/AIDS (3.58 per 10,000 [95%CI 0.58;6.57]); and respiratory diseases (3.56 per 10,000 [95%CI 0.18;6.94]). The ten most common causes of death accounted for 72.30% of the mortality difference. Infant mortality also had signifi cantly higher age-adjusted rates in high inequality areas (2.80 per 10,000 [95%CI 0.86;4.74]), as well as among males (27.37 per 10,000 [95%CI 6.19;48.55]) and females (15.07 per 10,000 [95%CI 3.65;26.48]).
CONCLUSIONS: The study results support the relative income hypothesis. After propensity score matching cause-specifi c mortality rates was higher in more unequal areas. Studies on income inequality in smaller areas should take proper accounting of heterogeneity of social and demographic characteristics.
The association between income and health can be assessed through two distinct mechanisms: the abso-lute income effect and the relative income effect. The absolute income effect is exemplifi ed by the well--established association between income, poverty and death and illness. Those living in poverty have lower access to health services, clean water, secure jobs, decent education, as well as are more vulnerable to violence and natural disasters.18
Conversely, the relative income hypothesis posits that an individual’s health status is additionally determined by his/her relative social position, which depends on the income level. Thus, an individual with a given income would have worse health status when living in close proximity to wealthier individuals compared to others with a similar standard of living. To paraphrase Seneca in Epistles to Lucilius, “poor in the midst of riches, which is the sorest kind of poverty.”
Among several theories to explain the relative income effect one of the most influential is Wilkinson’s (the psychosocial hypothesis):18 stress and shame produced by invidious social comparisons increase an individual’s vulnerability to illness. Additionally, lower
RESUMO
OBJETIVO: Analisar causas básicas de óbito segundo a teoria de renda relativa.
MÉTODOS. Os 96 distritos do Município de São Paulo, SP, foram divididos em dois grupos segundo desigualdade de renda, com base no índice de Gini (alta
≥ 0,25 e baixa <0,25). Foi aplicada a metodologia propensity score matching
para controlar por fatores de confusão referentes às diferenças socioeconômicas e demográfi cas entre os distritos.
RESULTADOS. A diferença entre a mortalidade de distritos desiguais e mais igualitários foi estatisticamente signifi cativa para homicídios (8,57 por 10.000 residentes [IC95% 2,60; 14,53]), doença isquêmica do coração (5,47 por 10.000 [IC95% 0,76; 10,17]), aids (3,58 por 10.000 [IC95% 0,58; 6,57]) e doenças respiratórias (3,56 por 10.000 [IC95% 0,18; 6,94]). As dez causas básicas mais frequentes foram responsáveis por 72,3% do total da diferença. A mortalidade infantil também foi estatisticamente maior para distritos mais desiguais (2,80 por 10.000 [IC95% 0,86; 4,74]), assim como mortalidade masculina (27,37 por 10.000 [IC95% 6,19; 48,55]) e feminina (15,07 por 10.000 [IC95% 3,65; 26,48]).
CONCLUSÕES. Os resultados encontrados estão de acordo com o esperado pela teoria da renda relativa. A mortalidade por todas as causas básicas analisadas foi maior em distritos mais desiguais depois do uso da metodologia do propensity score matching. Estudos sobre a desigualdade de renda realizados em regiões menores precisam levar em consideração a distribuição heterogênea das características sociais e demográfi cas.
DESCRITORES: Mortalidade. Causas de Morte. Renda. Desigualdades em Saúde. Iniquidade Social.
INTRODUCTION
relative income can materially affect life opportunities. For example, someone who has enough resources to afford a phone cannot be described as deprived (in an absolute sense) of the ability to communicate with others. Nevertheless, if everybody else owns a phone and also has access to the Internet, then that indivi-dual who can only afford the phone can be relatively deprived. The sense of relative deprivation can be experienced as loss of status and prestige, but it is also experienced because an individual who does not have access to the Internet (in a society where everybody else is connected) can miss out on information such as job opportunities.
a Instituto Brasileiro de Geografi a e Estatística. Censo Demográfi co 2000 - Resultados do Universo: Agregados de setores censitários - São Paulo, Região Metropolitana. Brasília; 2003.
b Fundação Seade, CEPID-FAPESP, Centro de Estudos da Metrópole/Cebrap. Censo escolar 2001. [cited 2010 Nov 10] Available from: http://www.centrodametropole.org.br/cd/escolas/ESC2001.rar
was associated with a 7.8% excess mortality risk (95% CI 5.9;9.8).8 However, the size of the area for which income inequality is relevantly associated with health outcome is still a matter of debate. According to an earlier review by Subramanian & Kawachi,15 the asso-ciation between income inequality and health is more robust for studies conducted in larger (in particular, U.S. states) than smaller areas (neighborhoods). This observation is inconsistent with the relative income theory which posits that social comparisons are likely to be more signifi cantly felt as the individual is proxi-mate to reference groups (i.e. when compared against one’s immediate neighbors versus other people living in the same state).13
Before refuting this theory we should note an important methodological issue of testing the relative income hypothesis in smaller areas such as neighborhoods. In societies with high income segregation such as in Brazil,11 the distribution of income within a neighborhood is more equal than that between neigh-borhoods.19 Thus, income distribution within a favela (urban slum) tend to be far more equal (i.e. everybody is equally poor) compared to the rest of the metropolitan area. Thus, relevant social comparisons may not be fully valid by focusing on the distribution of income within a neighborhood.
Another challenge to the relative income theory is the mechanism by which inequality may have an effect on health. The psychosocial theory of inequality posits that the harmful effects of inequality are mediated by stress.18 But according to a recent literature review,
fi ve out of nine studies found little or no effect of stress as a potential mediator between socioeconomic status and health.10 This inconsistency in the literature may partly be explained by the crude manner in which “stress” is often measured.5 An alternative approach is to examine the specifi c pattern of excess morbidity and mortality associated with inequality to assess whether it is consistent with a stress-related mechanism. For example, accumulated evidence at the individual level points to an association between stress and cardiovas-cular disease but there is less evidence for cancers.1,7 Wilkinson & Pickett20 analyzed seven different cause--specifi c mortality rates from 3,139 counties in the United States and found that income inequality was associated to ischemic heart disease, respiratory disease, and homicide.
The objective of the present study was to analyze cause--specifi c mortality differences according to the relative income theory using a methodological approach that takes into account local heterogeneity.
METHODS
This analysis was developed by focusing on the two aforementioned challenges. First, we applied a statis-tical method known as propensity score matching to control for potential confounders of the association between income inequality and health, as highly deprived neighborhoods can have relatively equal distribution of income (because everyone is equally poor). In such a case, it would be misleading to compare people’s health in unequal vs. equal neighborhoods regardless of absolute local characteristics. Second, we identifi ed cause-specifi c patterns of mortality associated with income inequality. Preliminary results of the main study are published elsewhere.3
São Paulo, southeastern Brazil, is a very unequal and segregated city.2,17 In the past, the city was considered to have a radial distribution of income, the farther away from the center the poorer its residents.16 As population density increased wealthier residents came to prefer more peripheral areas; and the need for construction workers, and domestic and other low-paid laborers made them move to these areas as well. Extreme income inequality between closely-adjacent areas became an important characteristic of São Paulo.2
São Paulo is currently divided into 31 administrative areas, known as subprefeituras. They are further divided into administrative areas, a proxy for neighborhood and the smallest areas for which health data is available. São Paulo has a total of 96 administrative areas (median population of 98,649 residents) covering the entire area of the city.
Bulletin (HIV/AIDS rate).c The variables are all based on offi cial municipal and federal data and were selected to control for absolute characteristics that may affect health besides income inequality. After the selection of variables, no further changes were made (i.e. no varia-bles were included or excluded during the analysis). The variable used to defi ne exposure in the propensity score model was the Gini coeffi cient, which was also calcu-lated from the 2000 Population Census. The outcome was cause-specifi c (10 most frequent causes of death) and total mortality rates, available from the municipal government,d which were subsequently adjusted for age. To minimize random annual variation within the administrative areas, we calculated mortality rates from 1998 to 2002, within the fi ve years of the 2000 Census. To avoid confusion between income inequality area and poverty area, we applied propensity score matching. A propensity score is the probability of assignment to a particular treatment or exposure given a set of observed covariates. It was fi rst introduced by Rosenbaum & Rubin.12
The probability of assignment to a “treatment”, or “expo-sure” (in this instance, a neighborhood with high income inequality) is estimated using logistic regression in which we enter possible (and observed) causes of assignment to the treatment. The propensity score reduces a large set of covariates to a single scalar summary variable but it does not make assessments about the prediction of individual variables, avoiding multicollinearity.6 The propensity approach is intended to identify administrative areas that are as alike as possible to each other with respect to the probability of being “exposed.”
The Gini coeffi cient was used to measure inequality of income distribution. It theoretically ranges from 0.0 (perfect equality, with every household earning exactly the same) to 1.0 (absolute inequality, with a single household earning a locality’s entire income). Mathematically, the Gini coefficient is equivalent to half the average absolute difference between the incomes of any two households randomly sampled for a population, and then normalized to the mean. In the present analyses, we defi ned our exposure as having relative high income inequality (Gini coeffi cient >0.25), and non-exposure as relative low income inequality (<0.25). As there is no clear cut-off for high vs. low income inequality, we set it at 0.25 as it was close to the median Gini coeffi cient of the areas studied. The overall Gini coeffi cient in our sample ranged from 0.12 (Jaguará) to 0.55 (Vila Andrade).
The propensity score ranges from 0 (high probability of low income inequality within an area) to 1 (high
probability of high income inequality). The variables selected in our model generated propensity scores considered to be “highly predictive” of the exposure14 (the area under the ROC curve, or c-statistic, was 0.907).
The administrative areas with different exposures were subsequently matched on their propensity scores using a caliper width of 0.01 —the most frequently used value in the literature. If an area was not within a caliper width of any other with an opposite exposure situation, it was excluded from the analysis. We chose to apply matching with replacement to minimize loss of areas in the analysis. Of a total of 96 administrative areasin the city of São Paulo, 27 different areas had propensity scores within a caliper width of 0.01 of another one with opposite exposure, and were included in the analysis. The “exchangeable” areas were matched based on their propensity scores according to exposure status. In other words, each high inequality area was matched with another area that resembles its counterfactual (except for high inequality). In the matching procedure, two administrative areas (Saúde and Vila Mariana) were matched four times, and one (Santana) was matched twice, resulting in a total of 17 pairs.
RESULTS
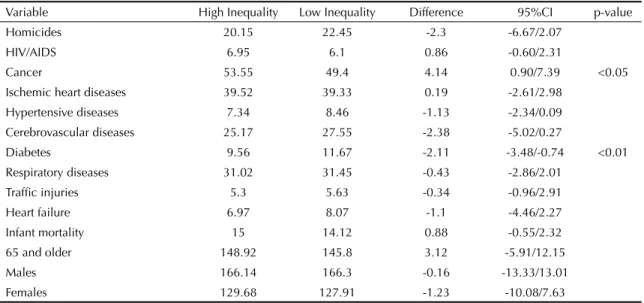
Before using propensity score matching (which included all 96 administrative areas) there was no signifi cant mortality difference between high and low income inequality areas among infants, elderly, males and females (Table 1). When we analyzed the under-lying causes of death, there was statistically signifi cant different age-adjusted mortality only from cancer (higher on high inequality areas) and diabetes (higher on low inequality areas).
After using propensity score matching four of the 10 most common underlying causes of death had signifi cantly higher mortality on high than on low inequality income areas (Table 2). The greatest difference was for homicide (8.57 per 10,000 [95%CI 2.60; 14.53]), followed by ischemic heart disease (5.47 per 10,000 [95%CI 0.76; 10.17]), HIV/AIDS (3.58 per 10,000 [95%CI 0.58; 6.57]) and respiratory diseases (3.56 per 10,000 [95%CI 0.18; 6.94]). All 10 underlying causes analyzed had higher mortality rates in high inequality areas.
Infant mortality also showed signifi cantly higher age--adjusted mortality in high inequalityareas(2.80 per 10,000 [95%CI 0.86;4.74]), as well as male mortality (27.37 per 10,000 [95%CI 6.19;48.55]) and female mortality (15.07 per 10,000 [95%CI 3.65;26.48]). Elderly mortality was also higher in high income inequality areas (8.85 per 10,000), although non--signifi cant (95%CI -0.72;18.44).
The analysis of the relative importance of each under-lying cause of death to the total mortality difference between high and low inequality areas (41.58 per 10,000) showed that homicides accounted for 20.60% of excess mortality, ischemic heart disease for 13.16% and HIV/AIDS for 8.61% (Figure). The 10 most common causes of death accounted for 72.30% of the total mortality difference.
DISCUSSION
More unequal areas had higher mortality rates from all 10 underlying causes of death analyzed. Four causes of death were statistically signifi cant (homicide, ischemic heart disease, HIV/AIDS, and respiratory diseases). Excess mortality of both males and females as well as excess infant mortality were found. Our results are consistent with those reported by Wilkinson & Pickett,20 in which income inequality was statistically
signifi cantly associated with mortality from ischemic heart disease, homicide and respiratory diseases, though not from diabetes or cancer.
The psychosocial hypothesis posits that the relative distribution of income within an area adversely affects health because of stress and shame induced by invidious social comparisons between residents. This may explain the excess mortality from ischemic heart disease, which has a well-established association with stress.9 Growing evidence suggests that stress is also linked to pulmonary function.4 Furthermore, the majority of respiratory deaths in our study are likely to be due to chronic obstructive pulmonary diseases, which are in turn primarily associated to cigarette smoking. Excess deaths from respiratory disease can be plausibly linked to higher psychosocial stress and smoking rates in the population studied.
Homicide and HIV/AIDS can similarly refl ect beha-vioral responses to people’s feelings of missed life opportunities. Youth growing up in areas with high income segregation (and consequently low mobility) feel they have no future in life, which in turn increases the probability of higher risk-taking behavior such as joining street gangs or unprotected sex.18
São Paulo is a relevant area to study the effects of relative income on health because it is a city with high income segregation.17 Even though it has a Gini coeffi cient of 0.51, the median value for its 96 administrative areas is 0.25. Living in poverty in São Paulo is not associated with living in an unequal neighborhood. On the contrary, the 14 poorest areas had a Gini coeffi cient below 0.25, i.e., poorer neighborhoods have a more equal distribution of income, i.e. their residents are equally poor.
A reason for the missing consensus on the adverse health effect of income inequality for small areas such as neigh-borhoods may be the homogeneity of income within small geographic scales.19 Our analysis showed that even for a notoriously unequal city such as São Paulo, this is still an issue. Only one area stood out as highly unequal (Vila Andrade), with a Gini coeffi cient of 0.55. The propensity score matching approach12 showed some advantages. First, it allows to explicitly check for overlap in the confounder distribution prior to the analysis –a step that is sometimes skipped when conduc-ting “black box” multivariable-adjusted regression. The exposed and unexposed groups are then matched, and comparisons are drawn only within the range of overlap in propensity scores, thereby avoiding off-support inference. Secondly, the propensity score deals with the dimensionality aspect in the multivariable analysis by reducing a large set of covariates to a single scalar variable. Lastly, this approach does not rely on any particular functional form (e.g. linearity) between the covariate and the outcome within each treatment group. 0
0.1 0.2 0.3 0.4 0.5 0.6 0.7 0.8 0.9 1
Overall mortality difference Homicide
Ischaemic Heart Disease HIV/AIDS
Respiratory Diseases Cerebrovascular Diseases Neoplasm
Cardiac Insufficiency Hypertensive Diseases Car Accidents Diabetes Others
Figure. Cause-specific mortality after using propensity
A major limitation of the propensity score approach is that it deals only with the set of observed covariates to build the model. It does not address the issue of confounding by unobserved factors, and in the worst case, the approach may even lead to increased bias. Nor can the approach deal with the endogeneity of residen-tial preferences, which is an issue in causal inference that applies to all observational studies on effects of area of residence on health. The replication of the results in other cities may also be an issue. Although São Paulo is one of the largest cities in the world, matches were found only for 27 of the 96 administrative areas. The use of binary exposure status (which is a limitation of the propensity score matching approach) may also
caused loss of information. The categorization of the level of income inequality into three levels (high, low, and medium) rather than using the median might have strengthened the associations. On the other hand, precision would have been compromised because of further reduction in the sample size of matched admi-nistrative areas.
The use of aggregate data is also an important limita-tion because it does not allow an analysis of individual biological pathways by which income inequality affects health. Another potential limitation is the use of a politically defi ned area such as administrative areas (distritos), which does not take into account spatial autocorrelation (i.e. rich areas may border slums but
Table 1. Age-adjusted mortality rates (per 10,000) before using propensity score matching for high and low income inequality
areas. São Paulo, Southeastern Brazil, 1998-2002.
Variable High Inequality Low Inequality Difference 95%CI p-value
Homicides 20.15 22.45 -2.3 -6.67/2.07
HIV/AIDS 6.95 6.1 0.86 -0.60/2.31
Cancer 53.55 49.4 4.14 0.90/7.39 <0.05
Ischemic heart diseases 39.52 39.33 0.19 -2.61/2.98
Hypertensive diseases 7.34 8.46 -1.13 -2.34/0.09
Cerebrovascular diseases 25.17 27.55 -2.38 -5.02/0.27
Diabetes 9.56 11.67 -2.11 -3.48/-0.74 <0.01
Respiratory diseases 31.02 31.45 -0.43 -2.86/2.01
Traffi c injuries 5.3 5.63 -0.34 -0.96/2.91
Heart failure 6.97 8.07 -1.1 -4.46/2.27
Infant mortality 15 14.12 0.88 -0.55/2.32
65 and older 148.92 145.8 3.12 -5.91/12.15
Males 166.14 166.3 -0.16 -13.33/13.01
Females 129.68 127.91 -1.23 -10.08/7.63
Table 2. Age-adjusted mortality rates (per 10,000) after using propensity score matching for high and low income inequality
areas. São Paulo, Southeastern Brazil, 1998-2002.
Variable High Inequality Low Inequality Difference 95%CI p-value
Homicides 19.62 11.05 8.57 2.60;14.53 <0.01
HIV/AIDS 8.62 5.04 3.58 0.58;6.57 <0.05
Cancer 55.68 53.3 2.38 -0.39;5.16
Ischemic heart diseases 41.66 36.2 5.47 0.76;10.17 <0.05
Hypertensive diseases 6.81 5.85 0.96 -0.62;2.53
Cerebrovascular diseases 25.53 22.57 2.96 -0.32;6.25
Diabetes 9.46 8.94 0.53 -1.42;2.47
Respiratory diseases 32.2 28.64 3.56 0.18;6.94 <0.05
Traffi c injuries 5.52 4.91 0.61 -0.48;1.71
Heart failure 6.37 4.49 1.44 -2.27;5.14
Infant mortality 15.42 12.61 2.8 0.86;4.74 <0.01
65 and older 153.08 144.22 8.85 -0.72;18.44
Males 172.52 145.15 27.37 6.19;48.55 <0.05
the two would be classifi ed into different administrative areas). One of the 16 variables included in the propensity score model was reported HIV/AIDS incidence rates for each administrative area. This variable was included because HIV/AIDS is a marker of deprivation and this condition affects an individual’s earning ability and hence can be a contributing factor to income inequality. In the analyses in which HIV/AIDS mortality was used as the outcome, HIV/AIDS was represented in both the left-hand and right-hand side of the regression equation. In these models, we interpreted the difference in HIV/ AIDS mortality rate as conditional on the area-level differences in HIV/AIDS rates.
The multivariable approach was required due to the characteristically high heterogeneity in São Paulo. There is no identifiable pattern of distribution of resources and population that makes one part of the city easily comparable to another one. This is also true for many other metropolitan areas situated in highly unequal countries (such as the United States and most of the developing world). We argue that the null fi ndings linking income inequality and health can benefi t from the application of a methodology such as the propensity score matching that takes into account the confounding effects of variables other than income inequality that could affect health.
1. Bergelt C, Prescott E, Grønbæk M, Koch U, Johansen
C. Stressful life events and cancer risk. Br J Cancer.
2006;95(11):1579-81. DOI:10.1038/sj.bjc.6603471
2. Caldeira TPR. Cidade de muros: crime, segregação e cidadania em São Paulo. São Paulo: Editora 34; 2008.
3. Chiavegatto Filho ADP, Kawachi I, Gotlieb SLD. Propensity score matching approach to test the association of income inequality and mortality in Sao
Paulo, Brazil. J Epidemiol Community Health.
2012;66(1):14-7. DOI:10.1136/jech.2010.108852
4. Clougherty JE, Kubzansky LD. A framework for examining social stress and susceptibility to air
pollution in respiratory health. Environ Health
Perspect. 2009;117(9):1351-8. DOI:10.1289/ehp.0900612
5. Cohen S, Kessler RC, Gordon LU. Measuring stress: a guide for health and social scientists. New York: Orford University Press; 1997.
6. Conniffe D, Gash V, O’Connell PJ. Evaluating state programmes: “natural experiments” and propensity
scores. Econ Soc Rev. 2000;31(4):283-308.
7. Greenwood DC, Muir KR, Packham CJ, Madeley RJ. Coronary heart disease: a review of the role of
psychosocial stress and social support. J Public Health
Med. 1996;18(2):221-31.
8. Kondo N, Sembajwe G, Kawachi I, van Dam RM, Subramanian SV, Yamagata Z. Income inequality, mortality and self rated health: meta-analysis of
multilevel studies. BMJ. 2009;339:b4471.
DOI:10.1136/bmj.b4471
9. Kubzansky L, Kawachi I. Affective states and health. In: Berkman LF, Kawachi I, editors. Social epidemiology. New York: Oxford University Press; 2000. p.213-41.
10. Matthews KA, Gallo LC, Taylor SE. Are psychological factors mediators of socioeconomic status and health
connections? Ann N Y Acad Sci. 2010;1186:146-73.
DOI:10.1111/j.1749-6632.2009.05332.x
11. Ribeiro LCQ, Lago LC. O espaço social das grandes
metrópoles brasileiras. Rev Bras Estud Urban Reg.
2000;3:111-29.
12. Rubin DB. Estimating causal effects from large data sets
using propensity scores. Ann Intern Med.
1997;127(8 Pt 2):757-63.
13. Runciman WG. Relative deprivation and social justice: attitudes to social inequality in 20th century England. London: Routledge; 1966.
14. Stürmer T, Joshi M, Glynn RJ, Avorn J, Rothman KJ, Schneeweiss S. A review of the application of propensity score methods yielded increasing use, advantages in specifi c settings, but not substantially different estimates compared with conventional
multivariable methods. JClin Epidemiol.
2006;59(5):437-47.
DOI:10.1016/j.jclinepi.2005.07.004
15. Subramanian SV, Kawachi I. Income inequality and
health: what have we learned so far? Epidemiol Rev.
2004;26:78-91. DOI:10.1093/epirev/mxh003
16. Torres HG, Marques E, Ferreira MP, Bitar S. Pobreza e
espaço: padrões de segregação em São Paulo. Estud
Av. 2003;17(47):97-128.
DOI:10.1590/S0103-40142003000100006
17. Villaça F. São Paulo: segregação urbana e
desigualdade. Estud Av. 2011;25(71):37-58.
DOI:10.1590/S0103-40142011000100004.
18. Wilkinson RG. The impact of inequality: how to make sick societies healthier. New York: The New Press; 2005.
19. Wilkinson RG, Pickett KE. Income inequality and population health: a review and explanation of the
evidence. Soc Sci Med. 2006;62(7):1768-84.
DOI:10.1016/j.socscimed.2005.08.036
20. Wilkinson RG, Pickett KE. Income inequality and
socioeconomic gradients in mortality. Am J Public
Health. 2008;98(4):699-704. DOI:10.2105/AJPH.2007.109637
REFERENCES