ESTIMATING THE ROLE OF AGRICULTURAL TECHNOLOGIES IN IMPROVING RURAL HOUSEHOLD WELFARE: A CASE OF MASVINGO
Simon Munongo, Chitungo K. Shallone, Lecturers Great Zimbabwe University, Zimbabwe
E-mail: [email protected], [email protected] Phone: +263776180106
ABSTRACT
To the majority of Zimbabweans, agriculture is a strong option for spurring growth, overcoming poverty, and enhancing food security. More than 90% of Zimbabwe’s rural populace depend on agriculture for their livelihoods. Improving the productivity, profitability and sustainability of smallholder farming is therefore the main pathway out of poverty in using agriculture for development (WDR, 2008). The adoption of new technologies by the rural communities’ world over has been found to increase rural livelihoods and food quality. In rural Masvingo many technologies have been adopted in agricultural production, but the major question has remained, has this improved the households’ welfare or it has been inadequately utilized and wrongly applied to an extent that no gain in welfare has been recorded? To estimate the impact of technological adoption on household welfare in Masvingo cross-sectional data of 2010 in 560 randomly selected households who responded to the questionnaire was utilised. Using propensity score matching (PSM) we found out that households that adopted new technologies had high consumption expenditures and agricultural income hence technology improves household welfare in Masvingo province.
KEY WORDS
Household; Productivity; Technology; Welfare; Income; Propensity Score Matching.
To the majority of Zimbabweans, agriculture is a strong option for spurring growth, overcoming poverty, and enhancing food security. Escaping poverty traps in many developing countries like Zimbabwe depends on the growth and development of the agricultural sector (World Bank Report 2008). Improving the productivity, profitability and sustainability of smallholder farming is therefore the main pathway out of poverty in using agriculture for development (World Development Report 2008). Agricultural growth and development is not possible without yield-enhancing technological options because merely increasing the number of individuals on the area under cultivation through land reform to meet the increasing food needs of growing populations is not sufficient.
Agricultural technologies can help reduce poverty and improve household welfare through direct and indirect effects (Moyo et al. 2007). The direct effects of technology on poverty reduction include productivity gains and lower per unit costs of production, which can raise incomes of producers that adopt technology. There are also a number of indirect benefits from technology adoption: depending on the elasticity of demand, outward shifts in supply can lower food prices; and increased productivity may stimulate the demand for labour (Asfaw 2010). The question for Masvingo province remains, however, that, has technological adoption improved the households’ welfare or it has been inadequately utilized and wrongly applied to an extent that no gain in welfare has been recorded. Therefore, there has been a longstanding interest in evaluating the impact of improved technologies on food security, poverty and welfare of rural communities of Masvingo.
This paper aims to contribute to the literature by providing a micro perspective on the impact of agricultural technology in rural Masvingo households. Assessing the impact of household technology adoption can assist with setting priorities, providing feedback to the government mechanisation programs, guiding government policy makers and those involved in technology transfer to have a better understanding how technological adoption help in reducing poverty in rural farming communities.
province. The characteristics of Masvingo Communal Areas are similar to those of most communal areas of Zimbabwe. Its characteristics include poor soils, which cannot sustain reasonable crop returns without application of fertilizer or manure hence improved technology have a great potential to increase yield. Drought has been occurring frequently in the past decade; almost in three years out of every five thus irrigational technology is very useful in the area to increase output.
The land pressure in Masvingo is high and accompanied by a high population growth rate (Murwira 1995). Most of the agricultural production relies on rain, with extremely low use of external inputs, particularly among the poorest households, who also depend more on agricultural income. Thus agriculture in Masvingo is mainly intensive farming thus the success of it relies on maximum land utilisation which requires improved seed varieties, fertilizers and mechanisation.
Grazing facilities are poor, leading to low numbers of cattle, most of which are in poor condition. The direct impact is scarcity of draft power, with less than 60% of the households interviewed owning cattle. The net result is low food production, and existence of high levels of malnourishment. Subsistence agriculture is the mainstay of the household economy in the province. Other activities are trading in clothing and food, selling of agricultural surpluses, crafts, pottery production and panning for gold. A significant portion of households in Masvingo also rely on cash remittances from family members in urban areas and abroad thus increased agricultural production will go a long way in improving household incomes.
Agricultural technological adoption is mistakenly perceived as tractor mechanization. Agricultural mechanization is defined as the use of any mechanical technology and increased power to agriculture. This includes the use of tractors, animal-powered and human-powered implements and tools such as jab planters, as well as irrigation systems, food processing and related technologies, equipment and new seed varieties.
Information on the economic impact of improved agricultural technologies is needed to target interventions efficiently and equitably, and to justify investment in such technologies. This paper assesses the impact of improved agricultural technologies by constructing a counterfactual comparison group. In this setting, a comparison of the outcome variable (total household income) is made between farmers who adopted technology (henceforth treated farmers) and their counterparts with similar observable covariates (henceforth untreated farmers).
ECONOMETRIC METHODOLOGY
Estimation of the welfare gain of adoption of agricultural technologies based on non experimental observations is not trivial because of the need of finding on counterfactual of intervention. We cannot observe the welfare outcome for those farmers who adopted improved technology had they not had adopted it. However, improved technology is not randomly distributed to the two groups of the households (adopters and non-adopters), but rather the households themselves deciding to adopt or not to adopt based on the information they have. Therefore, adopters and non-adopters may be systematically different.
Following the leads of Asfaw (2010) two proxies are used to measure household welfare outcome in this paper, namely crop income and household consumption expenditure. Thus we estimate two welfare outcome functions for adopters and another for non-adopters. The study will employ non-parametric techniques, namely propensity score matching (PSM), to overcome the econometric problems and assess therobustness of our results.
Browyn and Moffioli (2005) noted that this provides a rigorous strategy of identifying statistically robust control groups of non-participants. Though the ideal evaluation of a program necessitates the creation of a treatment or control group it cannot be applied before the introduction of the program.
counterfactual in a given set of observational data just like in any scientific experiment where the same sample can be used to assess the impact on the outcome if the treatment was not administered.
The effect of treatment evaluation on policy formulations is direct because if an intervention is successful it can be linked to desirable social programs or improvements in existing programs through review. The aim of adopting such a process is to enable policy makers attain the objective or goal of intervention. According to Kassie et al (2010) the standard problem of treatment evaluation involves the inference of a causal connection between treatment and the intended outcome. Thus given a program we observe that:
N
i
D
X
Y
i,
i,
i)
1
,...
(
=
...(1),where the dependent variable or outcome of interest is
Y
i,X
iis a vector of independentvariables and
D
iis a binary variable indicating whether the individual household is a technology adopter or not.The binary variable takes the form:
{
10ifthehouseotherwiseholdadoptedtechnologyi
D
==
=
...(2)It is the impact of a hypothetical change of
D
ionY
i, holding the vectorX
iconstant, that is ofinterest. In this case the outcome
Y
iis compared to the treatment and non-treatment states. Since no individual household is simultaneously observed in both states we cannot use the ones who did not receive the treatment in the sample as counterfactuals. The situation becomes that of missing data set. The method of causal inference can be tackled by creating a counterfactual. Therefore the question we tackle when applying PSM is to assess how the outcome of an average untreated individual household would change if such a household did not adopt new technology.The idea of measuring the effects of adoption or treatment requires constructing a measure that compares the average incomes of the treated and non-treated groups. Rosebaum and Rubin (1983) define a propensity score as a condition probability of receiving a treatment given pre-treatment characteristics. They show that if the exposure to treatment or adoption of technology is random within the cells defined by the values of the propensity score. Therefore given a population or sample of units the propensity score or the conditional probability of receiving a treatment given
X
iis:( )
x
[
D
x
]
E
[
D
x
]
p
=
Pr
=
1
/
=
/
...(3)Once propensity scores are known we then can calculate the average effect of treatment on the treated (ATT) as follows:
[
1−
0/
=
1
]
=
E
Y
iY
iD
iAAT
( )
[
]
(
E
Y
Y
D
p
x
)
E
1i−
0i/
i=
1
,
=
( )
[
]
( )
( )
(
1/
=
1
,
−
0/
=
0
,
/
=
1
)
...(
4
)
=
E
E
Y
iD
ip
x
E
Y
D
ip
x
D
iThe first assumption states that conditional on
X
i the outcomes are independent of treatment. In other words, participation in the adoption of technology does not depend on the outcome.Mathematically the representation states that the intervention outcomes are orthogonal of treatment conditional on the covariates given as follows:
) 5 .( ... /
, 1 ,
0 Y D X
Y ⊥
The unconfoundedness assumption, which in some cases is referred to as balancing condition is necessary if we are to identify some population measures of impact (Rosenbaum and Rubin 1983), given the overlap or matching assumption in 3 the assumption in 5 ensures that for each of the vector
X
i, there exist both treated and non-treated cases.The propensity score measure can be computed given the data
(
D
i,
X
i)
through a logistic regression.Our
X
i shows the selection criteria: Educational background of household head; Income; Closeness to the chief’s compound; Gender and age of household head; Total area of land utilised; Whether the land is under irrigation. Thus for the unconfoundedness assumption it states that given the propensity score:( )
...
...(
6
)
/
p
x
X
D
⊥
Equation 6 states that for individuals with the same propensity score, the adoption of technology is orthogonal or random, thus with the balancing condition, the conditional independence assumption given X implies conditional independence given
p
( )
x
:( )
x
p
D
Y
Y
X
D
Y
Y
0,
1⊥
/
0,
1⊥
/
Based on the above set of assumptions the PSM technique employs predicted probability of group membership that is treatment versus non-treatment group based on observed predictors usually obtained from a logistic regression to create a counterfactual group.
Using calculated propensity scores as defined in 3 is not enough to estimate average treatment effects of an intervention (Dehejia et al 2002). The reason is that the propensity score is usually a continuous variable and the probability of observing two units with the same propensity score is in principle not possible.
The propensity score allows the identification of farmers of similar covariates. The main purpose of propensity score is, given a treated farmer, to find an untreated farmer with similar characteristics. Accordingly, the difference in the outcome variable will be attributed to the treatment, and is denoted the average treatment effect. There are obviously some contentious issues, mainly the overlap and the unconfoundedness assumptions.
SURVEY DESIGN, DATA AND DESCRIPTIVE STATISTICS
The data used for this study is from a primary data collection in five districts of Masvingo. These districts are Chiredzi, Zaka, Masvingo rural, Chivi and Gutu which have similar weather conditions. During this survey, discussions were held with different stakeholders including farmers, traders and extension staff working directly with farmers. We did a random sampling of 100-150 farm households from each district and 560 families responded to the questionnaire.
production, yield data for different crop types, indicators of access to infrastructure and irrigation facilities, household market participation, household income sources and major consumption expenses.
Table 1 below shows descriptive statistics of the respondents, the data shows that 53% of the households adopted new technology where adoption in the study is defined as use of new seed varieties, new machinery and fertilizers during the farming season 2010-2011.
From table 1 the survey also showed that those who adopted new technology on average had better educational background, were closer to the market and had agricultural extension services close to their farming plots.
Table 1. Description, units, and statistics for variables included in the study
Variable Adopters (N=301)
Non-adopters (N=259) Average net crop income (in USD) 987 327 Total household income (in USD) 297087 84693 Average distance to village market (in km) 2.3 4.7 Distance to extension services (in km) 3.8 5.9 Average household head age (in years) 45 61 Average household head education (in years of schooling) 11 6 Average income from off-farm activities (in USD) 870 976
Access to irrigation 30 0
The technological adopters we also found to have on average less income from non-farming activities than the non-adopters. This finding is because those who are educated have better knowledge on the importance of adopting new technologies. Farmers close to the extension services get full encouragement to adopt new technologies from the experts hence the finding that those close to extension services adopted new technology better than those who lived far from the services.
RESULTS AND DISCUSSION
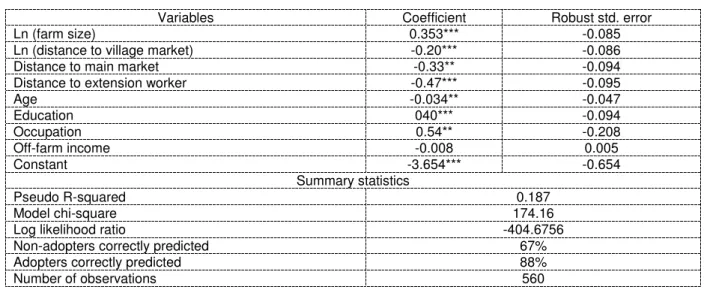
The logit estimates of the adoption propensity equation are presented in table 2. The logit model has a McFadden pseudo
R
2 value of 0.187 and correctly predicts 88 percent ofadopters and 67 percent of non-adopters. Most of the variables are statistically significantly associated with adoption of improved agricultural technology. Farm size, occupation, and education are positively associated with adoption.
Table 2. Logit estimates of the propensity to adopt agricultural technology
Variables Coefficient Robust std. error
Ln (farm size) 0.353*** -0.085
Ln (distance to village market) -0.20*** -0.086 Distance to main market -0.33** -0.094 Distance to extension worker -0.47*** -0.095
Age -0.034** -0.047
Education 040*** -0.094
Occupation 0.54** -0.208
Off-farm income -0.008 0.005
Constant -3.654*** -0.654
Summary statistics
Pseudo R-squared 0.187
Model chi-square 174.16
Log likelihood ratio -404.6756 Non-adopters correctly predicted 67% Adopters correctly predicted 88%
After estimating the propensity scores for the adopters and non-adopter group we check the common support condition. We find that there is considerable overlap in common support. Based on Table 2, among adopters, the predicted propensity score ranges from 0.234 to 0.9988, with a mean of 0.576, while among non-adopters, it ranges from 0.0139 to 0.8978, with a mean of 0.6755. Thus, the common support assumption is satisfied in the region of [0.0139, 0.9988], with only a loss of 16 (0.2 percent) observations from adopters. The pseudo-
R
2 is 18, 7%. This low pseudo-R
2 suggests that the proposed specification ofthe propensity score is fairly successful in terms of balancing the distribution of covariates between the two groups.
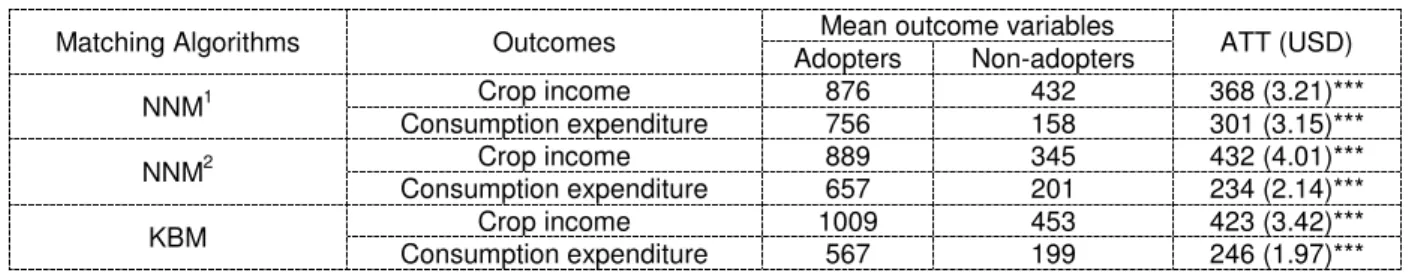
Table 3. Impact of adoption on crop income and consumption expenditure and Rosenbaum sensitivity analysis results
NNM1 = single nearest neighbour matching with replacement, common support, and calliper (0.06). NNM2 = five nearest neighbour matching with replacement, common support, and calliper (0.06). KBM= kernel based matching with band width 0.06, common support, and calliper (0.06). Note: ***, **, * is significant at 1%, 5%, and 10%, respectively.
Table 3 reports the estimates of the average adoption effects estimated by NNM and KBM methods. As a sensitivity analysis, the table reports estimates based on the single and five nearest neighbours, and kernel estimator with one bandwidths. All the analyses were based on implementation of common support and calliper, so that the distributions of adopters and non-adopters were located in the same domain. As suggested by Rosenbaum and Rubin (1985), we used a calliper size of one-quarter of the standard deviation of the propensity scores.
The outcome variables are the net value of crop income per hectare and consumption expenditure. Although the two matching algorithms based on the logit model produced different quantitative results, the qualitative findings are similar. The results indicate that adoption of improved agricultural technologies have a positive and significant effect on crop income and consumption expenditure.
The increase in crop income ranges from USD 243 to USD 432 per hectare. This is the average difference in crop income of similar pairs of households that belong to different technological status (adopters and non-adopters). The increase in crop income helps adopters to increase their consumption expenditure and thus improve welfare.
Adoption has also impact on increasing the consumption expenditure with both matching algorithms techniques showing that adopters have higher average consumption expenditures. The results show that adoption of technology increases income and consumption expenditure to households thus increasing welfare and reducing poverty. These conclusions are consistent with recent findings by other authors (Kassie et al 2010, Asfaw et al 2010 and Cunguara 2010).
REFERENCES
[1] David, C.C. & Otsuka, K. (1994). Modern rice technology and income distribution in Asia, Lynne Riener Publishers, Boulder, CO, USA.
[2] De Janvry, A. & Sadoulet, E. (2001). World poverty and the role of agricultural technology: direct and indirect effects. Journal of Development Studies, 38 (4), pp,
1-Matching Algorithms Outcomes Mean outcome variables ATT (USD) Adopters Non-adopters
NNM1 Crop income 876 432 368 (3.21)*** Consumption expenditure 756 158 301 (3.15)***
NNM2 Crop income 889 345 432 (4.01)*** Consumption expenditure 657 201 234 (2.14)***
[3] Moyo, S., Norton, G.W., Alwang, J., Rhinehart, I., & Demo, M.C.(2007). Peanut research and poverty reduction: Impacts of variety improvement to control peanut viruses in Uganda. American Journal of Agricultural Economics 89 (2), pp, 448–60. [4] Rosenbaum P.R. & Rubin, D.B. (1983). The central role of the propensity score in
observational studies for causal effects, Biometrika 70 (1), pp, 41-55.
[5] World Bank (2008). World development report 2008: Agriculture for development, World Bank, Washington, DC.
[6] Solomon Asfaw. (2010), Estimating Welfare Effect of Modern Agricultural Technologies: A Micro-Perspective from Tanzania and Ethiopia International Crops Research Institute for the Semi-Arid Tropics (ICRISAT), Nairobi, Kenya.
[7] Alene, A. and Manyong, V.M. (2007). The effect of education on agricultural productivity under traditional and improved technology in northern Nigeria: an endogenous switching regression analysis. Empirical Economics 32: 141-159.
[8] Dehejia, H.R., and Wahba, S. (2002). Propensity score matching methods for non-experimental causal studies. The Review of Economics Statistics 84(1): 151-161. [9] Freeman, H.A., van der Merwe, P.J.A, Subrahmanyam, P, Chiyembekeza, A.J, and
Kaguongo, W. (2001). Assessing the adoption potential of new groundnut varieties in Malawi. Working Paper 11, ICRISAT, Patancheru, India.
[10] Kassie, M., Shiferaw, B. and Geoffrey, M. (2011) Agricultural Technology, Crop Income, and Poverty Alleviation in Uganda. World Development.
[11] Becerril, J. & Abdulai, A. (2009). The impact of improved maize varieties on poverty in Mexico: A propensity score marching approach. World Development, 38 (7), pp. 1024-1035.
[12] Murwira, K(1995)”Freedom to Change-the Chivi experience,” Waterlines, April 1995, Vol.13, No 4.