1
Article based on the master’s thesis of RAM MOREIRA intitled “Aplicação do modelo transteórico para consumo de óleos e gorduras e sua relação com consumo alimentar e estado nutricional em um serviço de promoção de saúde ”. Universidade Federal de Minas Gerais; 2010.
2
Universidade Federal do Tocantins, Curso de Nutrição. Palmas, TO, Brasil.
3
Universidade Federal de Minas Gerais, Escola de Enfermagem, Departamento Nutrição. Av. Alfredo Balena, 190, 4º andar, Sala 316, Santa Efigênia, 30130-100, Belo Horizonte, MG, Brasil. Correspondência para/Correspondence to: ACS LOPES. E-mail: <[email protected]>.
4
Universidade Federal de Minas Gerais, Escola de Enfermagem, Programa de Pós-Graduação em Enfermagem. Belo Horizonte, MG, Brasil.
Sponsor: Fundação de Apoio à Pesquisa do Estado de Minas Gerais, under Protocol number CDS APQ-0376-4.08/07.
Eating behavior toward oil and
fat consumption
versus
dietary fat intake
1Comportamento alimentar para consumo
de óleos e gorduras versus consumo
alimentar de lipídeos da dieta
Renata Andrade de Medeiros MOREIRA2
Luana Caroline dos SANTOS3
Mariana Carvalho de MENEZES4
Aline Cristine Souza LOPES3
A B S T R A C T
Objective
To analyze whether the stages of change of the Transtheoretical Model are in accordance with the fat consumption of members of the Academia da Cidade of Belo Horizonte, Minas Gerais.
Methods
This cross-sectional study included a simple random sample of users aged ≥20 years frequenting an Academia da Cidade. Eating behavior toward oil and fat consumption was evaluated by the transtheoretical model and compared with fat intake adequacy, obtained through mean fat intake was investigated by three 24-hour recalls. Anthropometric and sociodemographic data were also collected. Additionally, the stages of change were verified, after reclassification the stages of change agreed with the consumption of fatty foods, fats, and fractions. Results
fatty acids, and cholesterol (16.0%) in excess. The stages of eating behavior were significantly different after reclassification. The number of women in action and maintenance decreased in a way that in the end, 4.6% were in precontemplation, 19.8% were in contemplation, 26.0% were in preparation, 28.2% were in action, and 21.4% were in maintenance. The consumption of chicken skin; fatty salad dressing; bread, doughnuts or cake with butter/margarine; and fats, saturated fatty acids, and monounsaturated fatty acids was lower in the final stages of the transtheoretical model.
Conclusion
After reclassification the algorithm is in agreement with the ingestion of high-fat foods, which denotes its applicability for the evaluation of eating behavior and for providing data to food and nutrition education actions.
Indexing terms: Feeding behavior. Food consumption. Lipids. Models, theoretical.
R E S U M O
Objetivo
Analisar se os estágios de mudança, segundo o Modelo Transteórico, estão de acordo com o consumo de gorduras por parte de usuárias da Academia da Cidade de Belo Horizonte, Minas Gerais.
Métodos
Estudo seccional com amostra aleatória simples de usuárias (≥20 anos) da Academia da Cidade. Avaliou-se o comportamento alimentar para consumo de óleos e gorduras pelo Modelo Transteórico; posteriormente, confrontou-se tal comportamento com a adequação da ingestão de lipídeos, obtida pela média de três recordatórios 24 horas, e coletaram-se dados antropométricos e sociodemográficos. Adicionalmente, verificou--se se os estágios de mudança, após reclassificação, estavam em consonância com o consumo de alimentos gordurosos, lipídeos e frações.
Resultados
Avaliaram-se 131 mulheres com média de idade de 53,9±12,1 anos, apresentando consumo mediano de óleo de 556,0 mL; ingestão excessiva de alimentos ricos em gorduras, lipídeos (20,6%), ácidos graxos saturados (31,3%) e poli-insaturados (38,2%) e colesterol (16,0%). Os estágios de comportamento alimentar foram significativamente diferentes após reclassificação, com redução de mulheres em ação e manutenção; ao final, 4,6% das mulheres estavam em pré-contemplação, 19,8% em contemplação, 26,0% em decisão, 28,2% em ação e 21,4% em manutenção. O consumo de pele de frango, de molho com gordura para salada, de pães, rosquinhas ou bolos com manteiga/margarina, de lipídeos, de ácidos graxos saturados e monoinsaturados foi inferior nos estágios finais do Modelo Transteórico.
Conclusão
O algoritmo, após reclassificação, apresenta-se em consonância com a ingestão de alimentos ricos em lipídeos, o que denota sua aplicabilidade para avaliar o comportamento alimentar e subsidiar ações de educação alimentar e nutricional.
Termos de Indexação: Comportamento Alimentar. Consumo de alimentos. Lipídeos. Modelos teóricos.
I N T R O D U C T I O N
Nutrition transition is characterized by higher consumption of sugars and fats, mainly from animal origin; lower consumption of grains, legumes, fruits, and vegetables; and more away-from-home meals. These changes lead to an unfavorable health landscape that promotes Chronic Non-communicable Diseases (NCD), such
as obesity, high blood pressure, and diabetes Mellitus1.
In this sense, it is crucial to evaluate the characteristics of people’s dietary habits, especially
the quantity and quality of the fats consumed2,
to promote healthier dietary practices.
However, interventions aimed at changing
the understanding of social, cultural, economic, physiological, and hedonistic determinants,
among others3. Hence, different theories have
been developed, with an emphasis on the
transtheoretical model4 proposed by Prochaska
et al.5,6. This model suggests that individuals perform behavioral changes in stages denominated precontemplation, contemplation, preparation,
action, and maintenance5. During these stages
the individual ponders upon his behavior and considers what kind of attitude to take and the
moment to act6.
Results of studies that used the transtheoretical model to phase the consumption of oils and fats showed the importance of differentiating individuals within stages of dietary behavioral changes to increase intervention effectiveness. It is then possible to determine and implement the most effective actions, improving
the results of the proposed behavior changes7-10.
After nutrition interventions based on the stages of change, individuals reported a lower
intake of calories7-9, fats, and fatty foods7-9, mainly
in the stages of action and maintenance; and a
higher intake of fiber, fruits, and vegetables9. Such
changes improved participants’ serum lipid levels
and blood pressure10. Additionally, participants
advanced in stages, such that most individuals were in the action and maintenance stages at the
end of the study7. Notwithstanding, strategies
that prevent relapses and promote stage advancement, mainly to the stages of preparation,
action, and maintenance, need to be implemented7-9.
To do so, a fundamental part of this process is to use a specific algorithm to identify individuals’ current stages of change. Different algorithms regarding the consumption of oils and fats have been proposed, and in some of them, classification is based on questions that consider only the intention of lowering oil and fat intakes. Thus, the classification of the stage of change will depend on an individual’s ability to perceive his diet correctly11.
Therefore, incorrect perception of oil and fat consumption might lead to an incorrect
classification of the stage of change, compromising
intervention selection12. Thus, it is critical to use
an algorithm that agrees with individuals’ fat consumption and allows reclassifying their stages of change according to their dietary intake and perceptions.
Given the above, this study analyzed whether the transtheoretical model’s stages of change are in accordance with the fat consumption of Belo Horizonte (MG) Academia da Cidade (City Gym) users.
M E T H O D S
This is a cross-sectional study with users of a health-promoting service, the City Gym of Belo Horizonte (MG), which is part of the Sistema Único de Saúde (Unified Health Care System). It aims to promote regular physical activity and a healthy diet. The study City Gym was founded in 2006 and is located in the Eastern Sanitary District of Belo Horizonte, one of the city’s regions with the highest level of Social Vulnerability
(SVI=0.77)13. This establishment has a capacity of
400 individuals. Users join spontaneously or are referred by the Family Health Groups of the nearby Primary Health Care Units.
The present study is part of the first phase
of a major project called “Desenvolvimento de
Intervenções Nutricionais realizadas nas Academias da Cidade pertencentes ao Projeto BH Saúde - Belo Horizonte - MG” (Development of Nutrition Interventions at the City Gyms of the
Project BH Health - Belo Horizonte - MG), which
consists of three phases: phase 1) identification of the baseline stage of change of eating behavior toward fat and oil consumption; phase 2) planning and development of interventions according to the stages of change of eating behavior toward fat and oil consumption and their implementation in workshops; and phase 3) re-administration of the stages of change algorithms to evaluate stage progression and intervention effectiveness.
following parameters: significance level of 5%; power of explaining the effectiveness of the interventions by switching stages of eating behavior toward fat and oil consumption of 80%; difference of stage changing on the eating behavior after development of nutrition intervention of 15%; and a 53% dropout rate during the 14 months of development of the project due to the attrition rate of users of the City Gym.
Sample size calculation was based on all eligible individuals aged 20 years or more who joined the City Gym between October 2007 and November 2008, totaling 336 individuals. Application of the sample parameters resulted in a sample of 168 individuals randomly divided into two groups of physical activity, Group 1 (Mondays, Wednesdays, and Fridays); and Group 2 (Tuesdays, Thursdays, and Saturdays).
The study inclusion criteria were: being female, since most City Gym users are women; not having participated in nutrition interventions related to oils and fats; and having undergone physical and nutritional assessment.
The following data were collected: sociodemographic data; oil consumption; and anthropometric data. The following instruments were used: the Portuguese version of the algorithm for fat and oil consumption proposed
by Greene & Rossi7 whose use has been
authorized in Brazil14; and the 24-Hour dietary
Recall (24 HR).
The algorithm was administered in stages. In the first part, the participant reported her perception regarding the consumption of oils and high-fat foods; whether she avoided high-fat foods and if so, since when; or for how long did she intend not to reduce his oil and fat intake. She was then classified into one of the five stages of change of eating behavior. In the second part, the women classified as being in the action and maintenance stages were quantitatively evaluated to compare their mean consumption of total fats, given by three consecutive 24 HR, with the stages of change and determine whether they needed
to be reclassified. The individuals with appropriate fat consumption, that is, less than 30% of the total dietary energy coming from fats, were classified into action or maintenance, according to the first part. The third part consisted of reclassifying the remainder (those with more than 30% of the total calorie intake coming from fats) into the stages of precontemplation, contemplation, and preparation based on four questions related to the consumption of high-fat foods and one question related to the consumption of fruits and
vegetables together with hig-fat-foods7,14.
The 24-hour dietary recall assessed food consumption. This method was chosen for its higher accuracy and applicability to individuals of low education levels. The three 24 HR were administered every other day, including one weekend day, to cover inter-day food intake
variability15. To optimize portion size estimates,
the 24 HR used household measures.
The foods listed in the 24 HR were converted into grams and milliliters using a specific food composition table. The amounts were then transformed into nutrients using the program
DietWin Software de Nutrição© (version 2006,
DietWin Inc, Porto Alegre, RS) with added food
composition tables and commercial food preparations and labels when needed. Evaluation of calorie and macronutrient followed the Institute
of Medicine16 (IOM) criteria; and of fatty acids
and cholesterol, the World Health Organization17
(WHO) criteria.
The monthly per capita oil consumption was given by taking the number of oil bottles used in the household monthly, converting the total volume to mL, and dividing by the number of persons consuming them. The reference values of 1 to 2 portions were used to determine oil intake adequacy, as proposed by the Food Pyramid
for the Brazilian Population18, that is, a minimum
of 240 mL and a maximum of 480 mL.
Weight, height, and Waist (WC) and Hip (HC) Circumferences were measured as
recommended by the WHO19. Body Mass Index
the square of the height and Waist-To-Hip ratio (WHR), by dividing the WC by the HC.
Adult body mass index was classified as
recommended by the WHO20 and older adult BMI,
as recommended by the Nutrition Screening
Initiative21. Metabolic risk was assessed by WC19 and
the risk of developing cardiovascular diseases, by
the WHR19.
The data were treated by the software Statistical Package for the Social Sciences (SPSS) for Windows (version 17.0).
After descriptive analysis, the Kolmogorov-Smirnov test assessed variable distribution. The
variables with normal distribution are expressed as Means ± Standard Deviations (SD) and the others, as medians and 95% Confidence Intervals (95%CI).
The Fisher’s exact test verified associations between variables. For the variables with normal and non-normal distributions, one-way Analysis of Variance (Anova) and the Kruskal-Wallis test, respectively, measured the differences between the stages of change on dietary behavior and fat consumption and its fractions. The Mann-Whitney test identified the stage(s) of change associated with the significant differences. The significance level was set at 5% for all tests.
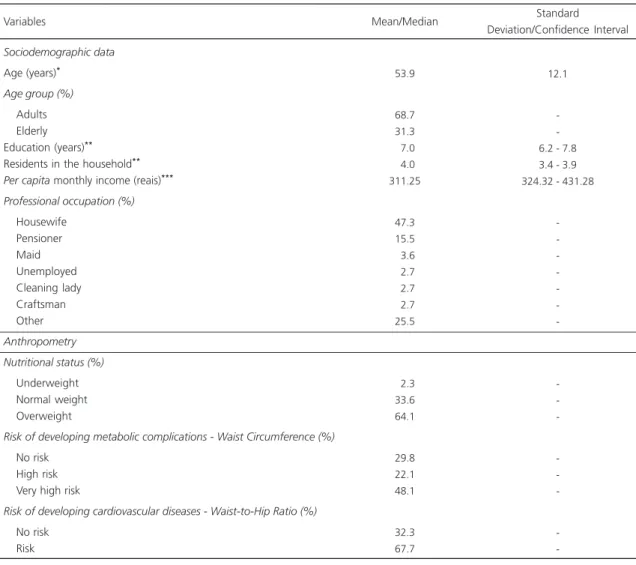
Table 1. Characterization of the sample with regard to sociodemographic characteristics and nutritional status. Belo Horizonte (MG), Brazil, 2009.
Sociodemographic data
Age (years)*
Age group (%)
Adults Elderly Education (years)** Residents in the household**
Per capita monthly income (reais)***
Professional occupation (%)
Housewife Pensioner Maid Unemployed Cleaning lady Craftsman Other
Anthropometry Nutritional status (%)
Underweight Normal weight Overweight
Risk of developing metabolic complications - Waist Circumference (%)
No risk High risk Very high risk
Risk of developing cardiovascular diseases - Waist-to-Hip Ratio (%)
No risk Risk Variables
53.9
68.7 31.3
07.0
04.0 311.25
47.3 15.5
03.6
02.7
02.7
02.7 25.5
02.3 33.6 64.1
29.8 22.1 48.1
32.3 67.7
Mean/Median Standard
Deviation/Confidence Interval
12.1
-6.2 - 7.8 3.4 - 3.9 324.32 - 431.28
The study was approved by the Research
Ethics Committees of Universidade Federal de
Minas Gerais (COEP nº ETIC 103/07) and of the
City Hall of Belo Horizonte (COEPSMSA/PBH
-Protocol nº 087/2007). All participants signed an Informed Consent Form.
R E S U L T S
Thirteen percent of the 168 users were lost because of refusal to participate (n=18) or not filling out all three 24 HR (n=5). Additionally, male subjects were excluded (n=16) to homogenize the sample, so 131 women were assessed. Table 1 describes the sociodemographic variables and nutritional status of the participants. Most subjects were overweight adults with low income and education level and at risk of developing metabolic complications and cardiovascular diseases.
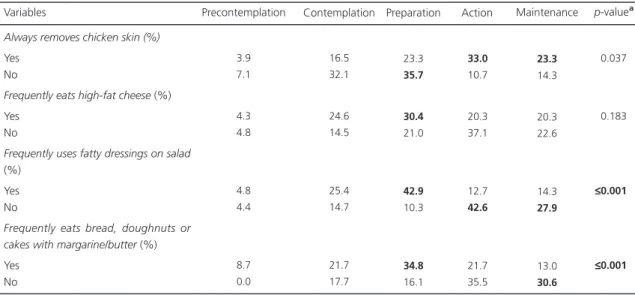
The monthly per capita oil ingestion was 556.0 mL (95%CI=557.5 mL - 686.2 mL); monthly oil intake was appropriate in 34.1% (240 to 480 mL); and excessive in 56.1% (>480 mL). The prevalence of poor eating habits associated with the intake of high-fat foods, such as chicken skin (21.4%), high-fat cheese (52.7%), bread, doughnuts, or cakes containing butter/margarine (52.7%), and fatty dressings on salads (48.1%), was high.
The mean intakes were: 31.9±5.7% kcal of fats, 8.4±2.0% kcal of Monounsaturated Fatty Acids (MUFA), 9.4±2.5% kcal of Polyunsaturated Fatty Acids (PUFA), and 1,689.1±493.4 kcal of calories; and the median intake of Saturated Fatty Acids (SFA) was of 8.7% kcal (95%CI=8.8%-9.8%) and of cholesterol, 163.7 mg (95%CI=178.0 mg-222.4 mg). Calorie intake was inadequate in 67.9% of the users. Additionally, many women consumed fats (20.6%), SFA (31.3%), PUFA (38.2%), and cholesterol (16.0%) in excess.
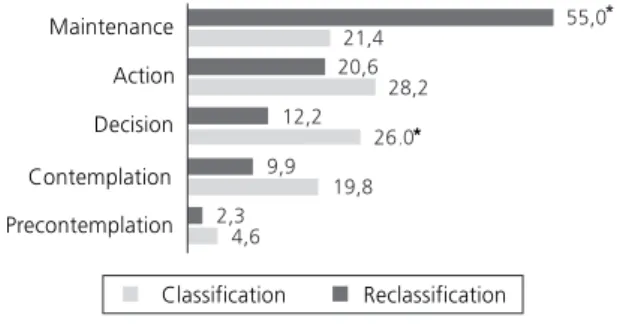
The classification of perception of oil and fat consumption and the intention to change dietary behavior according to the transtheoretical
model showed that 75.6% of the women were either in action (n=25) or maintenance (n=69). However, when evaluated on fat consumption (<30.0%), only 49.6% of the women were in these stages; of the ones in action (n=27), 63.0% (n=17) were really in this stage; of the ones in maintenance, only 38.9% (n=28) had appropriate fat consumption. Thus, the number of women in contemplation and preparation increased by 9.9% and 13.8%, respectively, and the number of women in maintenance decreased by 33.6%, a
significant difference (p<0.001) (Figure 1).
All stages of change had similar mean total
fat consumption (p=0.395). However, after
reclassification, fat intake was lower in the stages
of action (Classification: 31.6±6.1% kcal vs
Reclassification: 31.0% kcal; 95%CI=30.3-33.9% kcal) and maintenance (Classification: 31.5±5.7%
kcal vs Reclassification: 27.4% kcal; 95%CI=
24.9-27.5% kcal) (p<0.001) (Table 2).
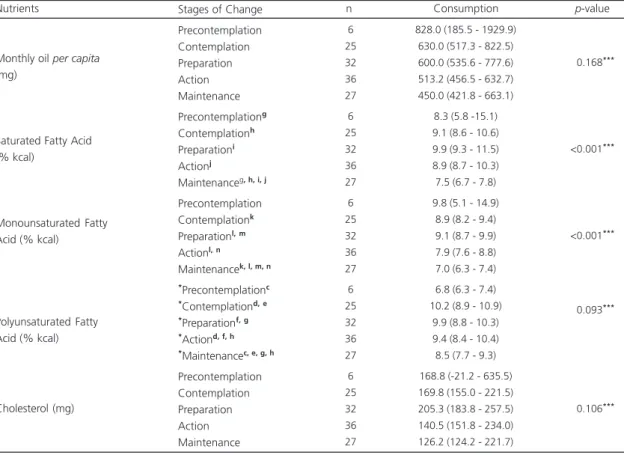
Additionally, subjects in action and maintenance had lower intake of high-fat foods than those in other stages: chicken skin (56.3%
action and maintenance, p=0.037); fatty salad
dressing (70.5% action and maintenance,
p<0.001); bread, doughnuts or cakes with butter
or margarine (66.1% action and maintenance,
p<0.001); SFA (action: 8.9% kcal; 95%CI=
8.7-10.3% kcal and maintenance: 7.5% kcal;
Figure 1. Stages of behavioral change toward consumption of oils and fats according to classification and reclassification of the participants’ perception. Belo Horizonte (MG), Brazil, 2009.
Note: *Significant difference between classification and reclassification
95%CI=6.7-7.8% kcal, p<0.001); and MUFA (action: 7.9% kcal; 95%CI=7.6-8.8% kcal and
maintenance: 7.0% kcal; 95%CI=6.3-7.4% kcal,
p<0.001) (Tables 3 and 4).
Table 2. Lipid intake of the participants according to classification and reclassification of the stages of change of eating behavior toward oil and fat consumption. Belo Horizonte (MG), Brazil, 2009.
Lipids (% kcal) Nutrient Reclassification Precontemplation Contemplation Preparation Action Maintenance
*Precontemplationa *Contemplationb, c *Preparationd, e *Actionb, d, f *Maintenancea, c, d, e, f
3 13 16 25 69 6 25 32 36 27
29.0 ± 6.7
33.0 ± 3.6
34.0 ± 5.7
31.6 ± 6.1
31.5 ± 5.7
32.9 (24.6 - 43.9) 33.4 (32.3 - 35.8) 34.2 (32.8 - 36.1) 31.0 (30.3 - 33.9) 27.4 (24.9 - 27.5)
<0.395***
<0.001***
Note: *Same letters correspond to statistically significant differences: p<0.05 (Mann Whitney test); **Analysis of Variance (mean and standard
deviation);***Kruskal-Wallis Test (median and 95% confidence interval). Evaluation of stages Stages of change n
Classification
Consumption p-value
Table 3. Monthly per capita lipid intake according to reclassification of the stages of change of the eating behavior toward oil and fat consumption. Belo Horizonte (MG), Brazil, 2009.
Monthly oil per capita
(mg)
Saturated Fatty Acid (% kcal)
Monounsaturated Fatty Acid (% kcal)
Polyunsaturated Fatty Acid (% kcal)
Cholesterol (mg) Precontemplation Contemplation Preparation Action Maintenance Precontemplationg Contemplationh Preparationi Actionj
Maintenanceg, h, i, j Precontemplation Contemplationk Preparationl, m Actionl, n
Maintenancek, l, m, n *Precontemplationc *Contemplationd, e *Preparationf, g *Actiond, f, h *Maintenancec, e, g, h
Precontemplation Contemplation Preparation Action Maintenance 6 25 32 36 27 6 25 32 36 27 6 25 32 36 27 6 25 32 36 27 6 25 32 36 27
828.0 (185.5 - 1929.9) 630.0 (517.3 - 822.5) 600.0 (535.6 - 777.6) 513.2 (456.5 - 632.7) 450.0 (421.8 - 663.1)
8.3 (5.8 -15.1) 9.1 (8.6 - 10.6) 9.9 (9.3 - 11.5) 8.9 (8.7 - 10.3) 7.5 (6.7 - 7.8) 9.8 (5.1 - 14.9)
8.9 (8.2 - 9.4) 9.1 (8.7 - 9.9) 7.9 (7.6 - 8.8) 7.0 (6.3 - 7.4) 6.8 (6.3 - 7.4) 10.2 (8.9 - 10.9)
9.9 (8.8 - 10.3) 9.4 (8.4 - 10.4) 8.5 (7.7 - 9.3) 168.8 (-21.2 - 635.5) 169.8 (155.0 - 221.5) 205.3 (183.8 - 257.5) 140.5 (151.8 - 234.0) 126.2 (124.2 - 221.7)
<0.168***
<0.001***
<0.001***
<0.093***
<0.106***
Nutrients Stages of Change n Consumption p-value
Note: *Same letters correspond to statistically significant differences: p<0.05 (Mann Whitney test); ***Kruskal-Wallis Test (median and 95% confidence
D I S C U S S I O N
When the classified and reclassified stages of change were compared, a considerable proportion of women in the stages of action and maintenance were displaced to the stages of precontemplation, contemplation, and preparation, corroborating the high prevalences of overweight and excessive consumption of oils and fats. Furthermore, after reclassification significant associations were observed between the consumption of greasy foods, fats, SFA, and MUFA and the stages of dietary behavior toward fat and oil consumption, denoting the possibility of using this model to help to create more customized interventions that aim to reduce the intake of high-fat foods.
Initially, more subjects were classified in the action and maintenance stages of change, corroborating the literature, which provides added prevalences for these two stages in excess of
30%22,23. However, such findings can be due to
an unrealistic perception of oil and fat
consumption11,12,23,24, which might underestimate
dietary fat intake. In the present study, this erroneous perception was evidenced by the participants’ high intake of fats and high-fat
foods. Moreover, the difficulty of evaluating
dietary intake should be mentioned11,23,24 given
the participants’ unfamiliarity with diet and nutritional terms and their lack of critical-reflexive sense for comparing their diet with a healthy
diet7,12. Nonetheless, underreporting-related
issues are influenced by the complexity of food intake25.
A study in Rhode Island with adults in a nutrition intervention program found an average consumption of total fats higher than that found
herein7. However, the lipid, SFA, and PUFA intakes
of adults with hyperlipidemia reported by Nasser et al.26 were similar to the present intakes, but their MUFA intake was higher.
The study results denote the need of reclassification to include subjects that were classified in action and maintenance but still had a high fat intake. To reinforce this finding, the associations found between the consumption of high-fat foods, lipids, SFA, and MUFA and the stages of change on the consumption of oils and fats were emphasized after reclassification. These figures corroborate some studies that found that fat consumption decreased as the stages
advanced23,27,28. However, despite the fact that
fat consumption is higher in the first three stages,
Table 4. High-fat food intake according to stages of change in the participants’ eating behavior. Belo Horizonte (MG), Brazil, 2009.
Always removes chicken skin (%)
Yes No
Frequently eats high-fat cheese (%) Yes
No
Frequently uses fatty dressings on salad
(%) Yes No
Frequently eats bread, doughnuts or cakes with margarine/butter (%) Yes No Variables 3.9 7.1 4.3 4.8 4.8 4.4 8.7 0.0 16.5 32.1 24.6 14.5 25.4 14.7 21.7 17.7 23.3 35.7 30.4 21.0 42.9 10.3 34.8 16.1 33.0 10.7 20.3 37.1 12.7 42.6 21.7 35.5
Precontemplation Contemplation Preparation Action
23.3 14.3 20.3 22.6 14.3 27.9 13.0 30.6 ≤0.037 ≤0.183 ≤ ≤≤ ≤ ≤0.001 ≤ ≤≤ ≤ ≤0.001 Maintenance p-valueª
subjects in action presented a high ingestion of this nutrient, emphasizing that they still need to
implement changes in their dietary behavior5,8,
which is a consequence of stage dynamism4,5,9,
with habits that require modification and rethinking.
Lower consumption of fat and its fractions as the stages of change advance shows, in turn, the importance of promoting interventions that also reduce the consumption of these nutrients by the subjects in precontemplation, contemplation, and preparation. Considering the benefits that a good dietary lipid profile can have on health, such
as lower risk of obesity and other NCD7,26, the
importance of interventions that focus on these nutrients is justified.
Participant reclassification by stage made it possible to consider risk groups based on dietary inappropriateness, not only on recognizing
intake29. Thus, we hope to contribute to the
design of better customized interventions that consider subjects’ self-perception regarding food ingestion and that contribute to broaden their view of dietary intake, helping to improve their autonomy and consequently, their motivation to
make changes12.
Moreover, the development of interventions on fat and oil consumption mentioned in the transtheoretical model is important because it enables determining the most effective activities
for the proposed behavioral changes7,8. Thus, we
hope to contribute to the control and/or prevention
of NCD and their complications4 and to promote
healthy habits, such as low consumption of high-fat foods.
This study presents some limitations, such as the scarcity of studies that use the transtheoretical model to assess oil and fat intake and its relationship with the consumption of specific nutrients. Furthermore, the existing studies were conducted in other countries with populations of distinct socioeconomic and education levels, which impair comparisons. To such degree, the use of an algorithm to classify the stages of change on oil and fat consumption is still restricted to specific populations.
Moreover, different algorithms have been
used28,30, and there is no golden standard, that is,
a widely used algorithm that best identifies participants’ dietary behavior, and this makes it
difficult to compare different studies30. Such
aspect strengthens the importance of using algorithms validated in distinct populations, as performed in this study.
The study results denote that the use of the transtheoretical model on fat and oil consumption as an instrument that helps the understanding of the behavioral changes associated with the ingestion of total lipids and their fractions is useful and important. This is possible because it enables a more specific analysis of the quality of ingested fats in each stage of change, favoring interventions that are actually individualized and therefore, more effective.
C O N C L U S I O N
The use of the transtheoretical model on the consumption of oils and fats proved to be important because it enables investigating perceived dietary consumption, intention of changing behavior, and women’s dietary habits. However, the algorithm results were more reliable after reclassification, enabling the evaluation of the stages of change according to the participants’ consumption of foods and nutrients related to oils and fats. Hence, its applicability for assessing dietary behavior is denoted, as is its use for supporting dietary and nutrition education actions that consider individuals’ diverse promptness to change their fat consumption. The design of interventions that help participants to understand their actions and behaviors is therefore expected, providing greater autonomy for the subjects to critically reflect and make decisions regarding their fat intake.
A C K N O W L E D G E M E N T S
This study was sponsored by Fundação de
Coordenação de Aperfeiçoamento de Pessoal de Nível Superior for the master’s scholarship. The cooperation of the group of research and service. We thank Danielle Alves Ibraim and Thiago Soares for the cooperation with research in the service.
C O N T R I B U T O R S
RAM MOREIRA helped to conceive the study; collect, supervise collection, analyze, and interpret data; and review the article. LC SANTOS helped to analyze and interpret data; and to review the article. MC MENE-ZES helped to review the article. ACS LOPES helped to obtain a grant; coordinate the project; conceive and design the study; analyze and interpret the data; and write and review the article.
R E F E R E N C E S
1. Instituto Brasileiro de Geografia e Estatística. Pesquisa de orçamentos familiares 2008-2009: aquisição alimentar domiciliar per capita Brasil e grandes regiões. Brasília: IBGE; 2010.
2. World Health Organization. Nutrition: Controlling the global obesity epidemic. Report of a WHO Consultation on Nutrition. Geneva: WHO; 2002. 3. Brasil. Ministério da Saúde. Secretaria de Atenção à Saúde. Guia alimentar para a população brasileira: promovendo a alimentação saudável. Brasília: Mi-nistério da Saúde; 2006.
4. Toral N, Slater B. Abordagem do Modelo Trans-teórico no Comportamento Alimentar. Ciênc Saúde Colet. 2007; 12(6):1641-50.
5. Prochaska JO, Di Clemente CC, Norcross JC. In search of how people change: Applications to addictive behaviors. Am Psychologist. 1992; 47(9): 1102-14.
6. Prochaska JO, Redding CA, Evers KE. The Transtheoretical Model and stages of change. In: Glanz K, Lewis FM, Rimer BK, editors. Health behavior and health education: Theory, research, and practice. 2nd. California: Jossey-Bass; 1996.
7. Greene GW, Rossi SR. Stages of change reducing dietary fat intake over 18 months. J Am Diet Assoc. 1998; 18(5):529-34.
8. Kristal AR, Glanz BC, Shuhui Li N. Mediating factors in dietary change: Understanding the impact of a worksite nutrition intervention. Health Educ Behav 2000; 27(1):112-25 [cited 2008 may 24]. Available
from: <http://heb.sagepub.com/cgi/content/ abstract/27/1/112>.
9. Frenn M, Malin S, Bansal NK. Stage-based interventions for low-fat diet with middle school students. J Pediatr Nurs. 2003; 18(1):36-45. 10. Logue E, Sutton K, Jarioura D, Smucker W,
Baughman K, Capers C. Transtheoretical model-chronic disease care for obesity in primary care: A randomized trial. Obesity Res. 2005; 13(5):917-27. 11. Plotnikoff RC, Lippke S, Johnson ST, Hotz SB, Birkett NJ, Rossi SR. Applying the stages of change to multiple low-fat dietary behavioral contexts. An examination of stage occupation and discontinuity. Appetite. 2009; 53(3):345-53.
12. Toral N, Slater B. Perception of eating practices and stages of change among Brazilian adolescents. Prev Med. 2009; 48(3):279-83.
13. Nahas MIP. O índice de vulnerabilidade social de Belo Horizonte: um instrumento de gestão muni-cipal da qualidade de vida urbana. Belo Horizonte: Fundação João Pinheiro Escola de Governo; 2001 [acesso 2008 out 3]. Disponível em: <http://www. eg.fjp.mg.gov.br/gestaourbana/arquivos/modulo 08/IVSFJP-2001.ppt>.
14. Moreira RAM. Aplicação do modelo transteórico para consumo de óleos e gorduras e sua relação com o consumo alimentar e estado nutricional em um Serviço de Promoção da Saúde [mestrado]. Belo Horizonte: Universidade Federal de Minas Gerais; 2010.
15. Willett W. Nutritional epidemiology. 2nd ed. New
York: Oxford University Press; 1998.
16. Institute of Medicine. Dietary reference intakes for energy, carbohydrate, fiber, fat, fatty acids, cholesterol, protein, and amino acids (macronutrients). Washington (DC): National Academies Press; 2005 [cited 2008 Set 20]. Available from: <http://www. nal.usda.gov/fnic/DRI//DRI_Energy/energy_full_ report.pdf>.
17. World Health Organization. Diet, nutrition and the prevention of chronic diseases. Report of a joint FAO/WHO/UNU Expert Consultation. Geneva: WHO; 2003. Technical Report Series, nº 916. 18. Phillipi ST, Laterza AR, Cruz ATR, Ribeiro LC.
Pirâmide alimentar adaptada: guia para escolha dos alimentos. Rev Nutr. 1999; 12(1):65-80. doi: 10.15 90/S1415-52731999000100006
19. World Health Organization. Obesity: Preventing managing the global epidemic. Report of a WHO consultation on Obesity. Geneva: WHO; 1998. 20. World Health Organization. Physical status: The use
21. Nutrition interventions manual for professionals caring for older Americans. (DC): Nutrition Screening Initiative; 1992.
22. Greene GW, Rossi SR, Rossi JS, Velicer WF, Fava JL, Prochaska JO. Dietary applications of the stages of change model. J Am Diet Assoc. 1999; 99(6): 673-78.
23. Hargreaves MK, Schlundt DG, Buchowski MS, Hardy RE, Rossi SR, Rossi JS. Stages of change and the intake of dietary fat in African-American women: Improving stage assignment using the Eating Styles Questionnaire. J Am Diet Assoc. 1999; 99(11):1392-99.
24. Worsley A. Nutrition knowledge and food consumption: Can nutrition knowledge change food behavior? Asia Pac J Clin Nutr. 2002; 11(Suppl.): S579-85.
25. Scagliusi FB, Ferriolli E, Pfrimer K, Laureano C, Cunha CS, Gualano B, et al. Characteristics of women who frequently under report their energy intake: A doubly labelled water study. Eur J Clin Nutr. 2009; 63(10):1192-9.
26. Nasser R, Cook SL, Dorsch KD, Haennel RG.
Comparison of two nutrition education approaches
to reduce dietary fat intake and serum lipids reveals registered dietitians are effective at disseminating information regardless of the educational approach. J Am Diet Assoc. 2006; 106(6):850-9.
27. Astrup Arn. Dietary fat and obesity: Still an important issue. Scand J Nutr. 2003; 47(2):50-7. 28. Greene GW, Rossi SR, Reed GR, Willey C, Prochaska
JO. Stages of change for dietary fat reduction to 30% of calories or less.J Am Diet Assoc. 1994; 94(10):1105-10.
29. Kristal AR, Glanz K, Curry SJ, Patterson RE. How can stages of change be best used in dietary interventions? J Am Diet Assoc. 1999; 99(6):679-84. 30. Verheijden MW, Van der Veen JE, Bakx JC, Akkermans RP, Van den Hoogen HJ, Van Staveren WA, et al. Stage-matched nutrition guidance: Stages of change and fat consumption in Dutch patients at elevated cardiovascular risk. J Nutr Educ Behav. 2004; 36(5):228-37.