Consumption of ultra-processed
foods and their impact on the
diet of young adults
Consumo de alimentos
ultraprocessados e impacto na dieta
de adultos jovens
I Programa de Pós-Graduação em
Epidemiologia. Universidade Federal de Pelotas. Pelotas, RS, Brasil
II Universidade Federal da Fronteira Sul. Passo
Fundo, RS, Brasil
III Programa de Pós-Graduação em Saúde e
Comportamento. Universidade Católica de Pelotas. Pelotas, RS, Brasil
Correspondence: Renata Moraes Bielemann Programa de Pós-Graduação em Epidemiologia
Rua Marechal Deodoro, 1160 3º andar 96020-220 Pelotas, RS, Brasil E-mail: [email protected] Received: 5/12/2014
Approved: 9/30/2014
Article available from: www.scielo.br/rsp
ABSTRACT
OBJECTIVE: To evaluate the consumption of ultra-processed foods, its
associated factors, and its inluence on nutrient intake in young adults.
METHODS: In 2004-2005, the individuals belonging to the Pelotas birth cohort of 1982 were identiied for a home interview. A total of
4,297 individuals were interviewed and 4,202 individuals were included in
the study (follow-up rate of 77.4%). Diet was assessed using a questionnaire on dietary intake and the percentage of daily caloric intake attributed to ultra-processed foods as well as the intake of macro- and micronutrients were estimated. The association between cohort characteristics and the consumption of ultra-processed foods was assessed using linear regression. Analysis of variance and Pearson’s Chi-square test were used to evaluate the association between the quintiles of the consumption of ultra-processed food, nutrient intake and adequacy of nutrient intake, respectively.
RESULTS: The consumption of ultra-processed foods corresponded to 51.2% of the total caloric intake. The consumption of ultra-processed foods was higher among women, individuals with higher education, and individuals who were never poor and eutrophic. The increased consumption of ultra-processed foods was positively correlated with the consumption of fat, cholesterol, sodium, iron, calcium, and calories (p < 0.001) and was negatively correlated with the consumption of carbohydrates, protein, and dietary iber (p < 0.001).
CONCLUSIONS: The high consumption of ultra-processed foods and its positive correlation with the intake of sodium, cholesterol, and fats underscores the need to perform interventions aimed at decreasing the intake of this food group.
DESCRIPTORS: Young Adult. Food Consumption. Industrialized Foods. Prepared Foods. Fast Foods. Socioeconomic Factors. Cohort Studies.
Renata M BielemannI,II
Janaína V Santos MottaIII
Gicele C MintenI
Bernardo L HortaI
In Brazil, according to a report issued by the 2008-2009
Pesquisa de Orçamentos Familiares (POF – Family
Budget Survey), the prevalence of obesity has doubled in the last 30 years, reaching 50.0% in men and 48.0% in women.a Unhealthy diets and physical inactivity were
found to be the main risk factors for obesity.11 With
respect to diet, the current recommendations and guide
-lines while providing guidance on the consumption of foods tend to focus on nutrient intake, with a certain disregard for the factors that favor food choice.14 The
Global Strategy on Diet, Physical Activity and Health, created by the World Health Organization, emphasizes the need to reduce the consumption of foods containing high amounts of energy, sodium, saturated fats, trans fats, reined carbohydrates, and those that are low in
RESUMO
OBJETIVO: Avaliar o consumo de alimentos ultraprocessados, os fatores associados e a sua inluência na ingestão de nutrientes em adultos jovens.
MÉTODOS: Em 2004-2005, os participantes da Coorte de Nascimentos de Pelotas de 1982 foram identificados para entrevista domiciliar. Foram entrevistados 4.297 indivíduos (taxa de acompanhamento de 77,4%) e incluídos no estudo 4.202. O consumo alimentar foi avaliado por meio de questionário de frequência alimentar e estimada a proporção da ingestão calórica diária atribuída aos alimentos ultraprocessados, bem como a ingestão de macro e micronutrientes. A associação entre características dos indivíduos e consumo de alimentos ultraprocessados foi avaliada utilizando-se regressão linear. A análise de variância e o teste Qui-quadrado de Pearson foram utilizados na associação entre quintis de consumo de alimentos ultraprocessados, ingestão e na adequação da ingestão de nutrientes, respectivamente.
RESULTADOS: O consumo de alimentos ultraprocessados contribuiu com 51,2% das calorias totais ingeridas. A ingestão de alimentos ultraprocessados foi maior entre indivíduos: do sexo feminino; de maior escolaridade; que nunca foram pobres e eutróicos. Maior consumo de alimentos ultraprocessados foi positivamente associado ao consumo de gorduras, colesterol, sódio, ferro, cálcio e calorias (p < 0,001) e negativamente associado ao consumo de carboidratos, proteínas e ibras alimentares (p < 0,001).
CONCLUSÕES: O elevado consumo de alimentos ultraprocessados e sua relação positiva com a ingestão de sódio, colesterol e gorduras chama a atenção para a realização de intervenções visando a redução da ingestão desse grupo de alimentos.
DESCRITORES: Adulto Jovem. Consumo de Alimentos. Alimentos Industrializados. Alimentos Preparados. Fast Foods. Fatores Socioeconômicos. Estudos de Coortes.
INTRODUCTION
nutrients.b The new version of the Guia Alimentar Para a População Brasileira (Food Guide for the Brazilian
Population)c gives guidance on meals and aspects
related to eating behavior, including cultural, social, economic, and environmental factors.
We should consider that individuals consume food and/or preparations in which the nutrients themselves
are not the main factors in determining the choice, a fact that is well-known and exploited by the food industry, which increasingly offers practical, palatable, durable, and more attractive food choices for the population.14
Processed foods have become increasingly acces
-sible to all age groups and are sold pre-prepared or ready-to-eat.15 The increased consumption of processed
a Instituto Brasileiro de Geografia e Estatística. Pesquisa de Orçamentos Familiares 2008-2009. Rio de Janeiro (RJ); 2010.
b World Health Organization, Department of Chronic Diseases and Health Promotions. Global strategy on diet, physical activity and health.
Geneva; 2003.
c Ministério da Saúde, Secretaria de Atenção à Saúde, Departamento de Atenção Básica, Coordenação Geral de Alimentação e Nutrição. Guia
food and beverages has been considered as one of the factors contributing to the increased prevalence of obesity and chronic diseases.25
According to the classiication proposed by Monteiro
et al,15 foods and/or cooking ingredients that acquire and retain some or all of the above characteristics
during the production process are designated as ultra-processed foods. A few studies have shown that the domestic acquisition of this food group has increased in recent decades.12,18 To date, studies on the individual
consumption of this food group are limited; however, the availability of this food group in homes has been
associated with an increased income16 and the risk of
obesity in the Brazilian population.6
The objective of this study was to evaluate the consump -tion of ultra-processed foods, its associated factors, and
its inluence on nutrient intake in young adults.
METHODS
The individuals belonging to the cohort study conducted in 1982 in Pelotas, RS, Southern Brazil were identiied.23 The methodology used to evaluate
the 1,982 cohort has been detailed elsewhere.9,23 In
2004-2005, the cohort participants, with a mean age of 22.8 years (21.9-23.7), were interviewed in approxi
-mately 98,000 households.
The interviews were conducted in the participants’ homes and were administered by trained examiners using a previously tested and structured question
-naire (pre-pilot and pilot), which addressed several sociodemographic and health-related aspects, including dietary habits. To evaluate food consumption, the food frequency questionnaire (FFQ) was used. The FFQ, adapted from a tool developed and validated by Sichieri,20 contained 85 food items which were divided
into two components: quantitative, with evaluation of domestic food portions and consisting of 70 food items and preparations; and qualitative, assessing only the frequency with which foods are consumed. The percentage of daily caloric intake of ultra-processed foods was calculated using the food items listed in the quantitative component of the FFQ. The caloric intake of these foods was estimated by converting the frequency of consumption reported for each item into the annual consumption. The reported daily intake was multiplied by 365.24 days of the year, the weekly intake was multiplied by 52.18 weeks in a year, the monthly consumption was multiplied by 12 months, and a value of one was used for the annual consumption.
The intake of household portions of the food items was converted to grams using the Tabela para Avaliação do Consumo Alimentar em Medidas Caseiras (Table
for Evaluation of Food Consumption in Household Measures) – 5th edition.19 The food intake in grams was converted into the amount of macro- and
micro-nutrients using the Tabela Brasileira de Composição de Alimentos (TACO – Brazilian Table of Food
Composition)d or the USDA Nutrient Database for
Standard Referencee when the TACO was unavail
-able. The evaluated nutrients included carbohydrates, proteins, fats, cholesterol, iber, sodium, iron, and calcium. The energy intake of each food item was esti
-mated by multiplying the amount of carbohydrates and proteins by 4 kcal and the amount of lipids by 9 kcal, and the annual caloric intake of each food item was obtained after totaling the calories derived from each macronutrient. To calculate the daily energy intake of each food item, the annual caloric intake was divided by 365.24. The total daily energy intake was evalu
-ated by totaling the calories consumed in each of the 70 food items.
The consumption of ultra-processed foods was
eval-uated according to the classification proposed by Monteiro,15 i.e., according to the degree of processing,
as follows: unprocessed or minimally processed foods (group 1), processed foods used as ingredients in cooking preparations by the food industry (group 2), and ultra-processed foods or food products (group 3). In this classiication, ultra-processed foods were consid
-ered as products that originate from the processing of a mixture of foods from groups 1 and 2, which were developed with the aim of creating pre-prepared or ready-to-eat meals that are long-lasting, accessible, convenient, and palatable. The production processes generally characterize these foods as salted, cured, sweetened, baked, fried, smoked, or pickled, and they
can also insert preservative or cosmetic additives,
synthetic vitamins and minerals, and use sophisticated types of packaging.15,16 Alcoholic beverages were not
included in this study.
In the quantitative FFQ, 21 food items were classiied as ultra-processed and were placed into the following groups: breads; cookies; sweets; soft drinks; salted, cured, and smoked meats and sausages; sauces; snacks; pizzas; salted and fried foods; and sweetened dairy beverages. Based on this classiication, the percentage of daily caloric intake was calculated from each group of ultra-processed foods.
The independent variables studied were as follows: gender, marital status, current education (years of
d Universidade Estadual de Campinas, Núcleo de Estudos e Pesquisas em Alimentação - NEPA. Tabela brasileira de composição de alimentos -
TACO. 2 ed. Campinas (SP): UNICAMP; 2006.
e USDA National Nutrient Database for Standard Reference [Internet]. Beltsville: Human Nutrition Research Center, Nutrient Data Laboratory;
schooling), change of income from birth to 23 years of age, and nutritional status. For the construction of changes in income, the variable family income, which was collected in a categorical form, in minimum wages in 1982 (< 1; 1.1-3.0; 3.1-6.0; 6.1-10.0, and > 10.0, with frequencies of 21.9%, 47.4%, 18.5%, 6.5%, and 5.7%, respectively) was estimated based on household and family characteristics, with a principal component analysis of four variables (health security in childbirth delivery care, education, height, and the mother’s ethnicity). Because of the unequal frequencies between categories, subjects were classiied into tertiles to allow the evaluation of changes in income levels since child
-hood. Therefore, the score generated by the irst vari
-able of the principal component analysis helped to identify cutoff points that allowed the differentiation of individuals of the second category of family income (47.4%) to a lower or intermediate tertile. The cohort participants answered questions about the income of each family member obtained through work, pension,
social benefits, retirement, and rented properties,
among others. Based on the tertiles of family income in 1982 and 2004-2005, the following classiication was used: always poor (those in the lowest tertile of family income in 1982 and 2004-2005), poor → not poor (those
in the lowest tertile in 1982 who climbed to the middle
or upper tertile in 2004-2005), not poor → poor (those in
the middle or upper tertile in 1982 who moved down to
the lowest tertile in 2004-2005), and never poor (those in the middle or upper tertile in 1982 and 2004-2005). The nutritional status of the cohort was classiied as recommended by WHO for the body mass index (BMI) categories.f To obtain the BMI, the subject’s weight
was measured using an electronic scale by subtracting the weight of the clothes. The weight of the clothes is based on a table created by the research team, which shows the weights of various items of clothing. Height was measured using a stadiometer, with the participants barefoot and the head positioned in the Frankfurt plane. Analysis of variance and linear regression were used in the crude and adjusted associations between the consump
-tion of ultra-processed foods (percentage of caloric intake) and sociodemographic variables. The percentage of caloric intake from carbohydrates, proteins, and fats and the average consumption of iber (g), cholesterol (mg), sodium (mg), iron (mg), and calcium (mg) were evalu
-ated according to the quintiles of the consumption of ultra-processed foods using the Student’s t-test, analysis of variance, or a corresponding non-parametric test when non-compliance with any of the premises was found. The association between the percentages of cohort participants
who met the current recommendations for nutrient intake established by the Guia Alimentar para a População Brasileirag and Dietary Reference Intakes (DRI)h and the
quintiles of the consumption of ultra-processed foods was evaluated using Pearson’s Chi-square test. In all analyses, a 5% signiicance level was considered.
The study was approved by the Research Ethics Committee of the Faculdade de Medicina of the Universidade Federal de Pelotas (Protocol 020/2003). All participants signed a free informed consent form.
RESULTS
A total of 4,297 individuals belonging to the 1982 cohort were interviewed, corresponding to a follow-up rate of 77.4% after considering the identiication of 282 deaths. Ninety-five individuals were excluded from the study: 52 because of implausible answers to the FFQ, including the reporting of high daily intake of all foods or the excessive daily intake of foods from the same food group (consumption of beans and lentils ive times a day); and 43 because they reported a daily caloric intake above three standard deviations of the mean. Thus, the inal study sample included 4,202 young adults, representing 97.8% of respondents in 2004-2005. Table 1 shows that most of the partici
-pants were men (51.4%), 61.4% partici-pants reported not living with a partner, 64.0% had inished high school education, and 52.0% had never been poor.
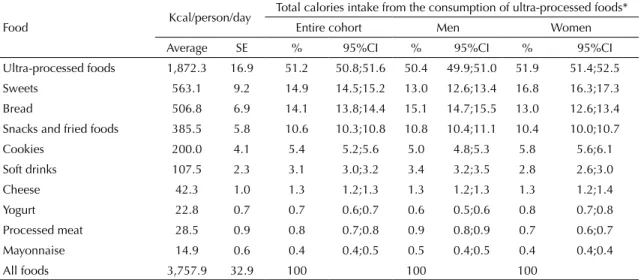
The average daily caloric intake was 3,758 calories, of which > 50.0% was attributed to the consumption of ultra-processed foods (Table 2). The analysis of consumption by food group indicates that bread repre
-sented 15.1% of the daily calorie intake among men, followed by sweets with 13.0%. For women, sweets were the main contributors to the daily caloric intake (16.8%), followed by bread (13.0%). Snacks were the third group of ultra-processed foods consumed by both genders (men: 10.8%; women: 10.4%). The percentage of caloric intake attributed to the consump
-tion of sweets, cookies, and yoghurts was higher among women, whereas the intake of bread, soft drinks, and
processed meats was higher among men. The consump
-tion of ultra-processed foods was more frequent among women living without a partner, individuals with higher
education, those who had never been poor, and those
who were not overweight (Table 3). After adjusting for other sociodemographic variables, education remained positively associated with the percentage of caloric intake attributed to the consumption of
f World Health Organization. Obesity: preventing and managing the global epidemic: report of a WHO Consultation; Geneva; 1997 June 3-5.
Geneva; 2000. (WHO Technical Report Series, 894).
g Ministério da Saúde, Secretaria de Atenção à Saúde, Coordenação Geral da Política de Alimentação e Nutrição. Guia alimentar para a
população brasileira. Brasília (DF); 2005. (Série A. Normas e Manuais Técnicos).
h Institute of Medicine, Food and Nutrition Board. Dietary reference Intakes: a risk assessment model for establishing upper intake levels for
ultra-processed foods. Therefore, cohort participants
with ≥ 12 years of education reported an additional
4.8% caloric intake attributed to the consumption of
these foods compared with participants with ≤ 4 years
of education (95%CI 2.9;6.7). Individuals who had never been poor reported a higher consumption of
ultra-processed foods compared with those who had
always been poor (regression coeficient [β] = 5.3, 95%CI 4.0;6.6). Overweight individuals reported a lower consumption of ultra-processed foods (β = -1.0, 95%CI -1.9;0.0), whereas obese individuals presented a lower caloric intake derived from these foods (β = -2.0, 95%CI -3.4;0.5).
Table 4 shows the tendency for daily protein intake to
decrease with the increase in the consumption of
ultra-processed foods p < 0.001). The same tendency was observed in relation to carbohydrate intake (p < 0.001), and cohort participants in the lower and upper quintile
of the consumption of ultra-processed foods presented
an average carbohydrate consumption of 65.6% and 54.7% of their total caloric intake, respectively. In contrast, the percentage of total caloric intake attrib
-uted to the consumption of fats ranged from 19.5% in the upper quintile to 33.6% in the lower quintile (p < 0.001). Moreover, individuals from the upper quintile of the consumption of ultra-processed foods had an average of 8.2% and 0.4% of total calories intake assigned to saturated and trans fats, respectively, whereas those in the lower quintile had an average of 6.0% and 0.2%, respectively.
With respect to cholesterol intake (Table 4), individ
-uals in the lower three quintiles of the consumption of
ultra-processed foods showed a similar consumption
of cholesterol, whereas those in the upper two quin
-tiles had a higher intake (p < 0.001). A progressive decrease in the consumption of dietary iber occurred with an increasing consumption of ultra-processed
Table 1. Demographic and socioeconomic characteristics of the 1982 cohort from Pelotas, RS, Southern Brazil, who were followed up in 2004-2005.
Variable n %
Sex
Masculine 2,161 51.4
Feminine 2,041 48.6
Marital status
Single/Divorced/Widowed 2,580 61.4
Married/With partner 1,622 38.6
Education (years)
≤ 4 341 8.1
5 to 8 1,154 27.5
9 to 11 2,043 48.6
≥ 12 664 15.8
Income change (1982→ 2004-2005)
Always poor 683 16.3
Not poor → Poor 698 16.6
Poor → Not poor 644 15.3
Never poor 2,177 51.8
BMI (kg/m2)
< 24.9 2,969 70.8
25.0-29.9 872 20.8
≥ 30.0 353 8.4
BMI: body mass index
Table 2. Caloric contribution of the consumption of ultra-processed foods to the total energy intake of individuals of the 1982 cohort from Pelotas, who were followed up in 2004-2005.
Food Kcal/person/day
Total calories intake from the consumption of ultra-processed foods*
Entire cohort Men Women
Average SE % 95%CI % 95%CI % 95%CI
Ultra-processed foods 1,872.3 16.9 51.2 50.8;51.6 50.4 49.9;51.0 51.9 51.4;52.5
Sweets 563.1 9.2 14.9 14.5;15.2 13.0 12.6;13.4 16.8 16.3;17.3
Bread 506.8 6.9 14.1 13.8;14.4 15.1 14.7;15.5 13.0 12.6;13.4
Snacks and fried foods 385.5 5.8 10.6 10.3;10.8 10.8 10.4;11.1 10.4 10.0;10.7
Cookies 200.0 4.1 5.4 5.2;5.6 5.0 4.8;5.3 5.8 5.6;6.1
Soft drinks 107.5 2.3 3.1 3.0;3.2 3.4 3.2;3.5 2.8 2.6;3.0
Cheese 42.3 1.0 1.3 1.2;1.3 1.3 1.2;1.3 1.3 1.2;1.4
Yogurt 22.8 0.7 0.7 0.6;0.7 0.6 0.5;0.6 0.8 0.7;0.8
Processed meat 28.5 0.9 0.8 0.7;0.8 0.9 0.8;0.9 0.7 0.6;0.7
Mayonnaise 14.9 0.6 0.4 0.4;0.5 0.5 0.4;0.5 0.4 0.4;0.4
All foods 3,757.9 32.9 100 100 100
SE: standard error
foods (p < 0.001); therefore, the individuals in the lower quintile reported an additional average intake of 15 g of iber compared with those in the upper quintile. In addition, individuals in the upper quintile reported an additional average daily sodium intake of 1,400 mg compared with those in the lower quintile (p < 0.001). The daily intake of iron and calcium was also positively
correlated with the consumption of ultra-processed
foods (p < 0.001). Individuals with a higher consump
-tion of ultra-processed foods reported a higher daily caloric intake; this value was 1,000 kcal/day higher among those in the upper quintile compared with those in the lower quintile (p < 0.001).
The consumption of ultra-processed foods and
the adequacy of nutrient intake were correlated (Table 5). The cohort participants in the lower quintile had the lowest percentage of adequate protein intake (p < 0.001). Although no trend was observed, a smaller percentage of individuals in the upper two quintiles showed an intake of carbohydrates and fats within the
recommended ranges, and only 47.4% and 33.8% of the cohort in the upper quintile reported an adequate consumption of carbohydrates (p < 0.001) and fats (p < 0.001), respectively. Most of the cohort met the recommendations for the intake of trans fats. However, the percentage of individuals with an adequate intake of trans fats varied between 92.3% and 99.2% from the upper to the lower quintile of the consumption of ultra-processed foods. More than 90.0% of the cohort participants in the lower quintile reached the recom
-mendation intake of < 10.0% daily calories from satu
-rated fats, whereas this percentage decreased to 78.3% among those in the upper quintile.
With respect to the intake of cholesterol, dietary iber, and sodium, the percentage of individuals with an adequate intake of these nutrients in the lower quin
-tile was 15, 12, and 49 percentage points higher than the percentage of subjects in the upper quintile. The opposite was observed in relation to the adequacy of intake of iron and calcium, with a gradual increase in
Table 3. Crude and adjusted analyses between energy contribution (%) of the consumption of ultra-processed foods and sociodemographic characteristics and nutritional status of the 1982 cohort from Pelotas, who were followed up in 2004-2005.
Variable
Consumption of ultra-processed foods (% kcal/day)a
Crude analysis Adjusted analysis
% p β 95%CI
Sex < 0.001
Masculine 50.4 Ref.
Feminine 51.9 1.4 0.6;2.2
Marital status 0.001b
Single/Divorced/Widowed 51.8 Ref.
Married/With partner 50.1 -0.3 -1.1;0.6
Education (years) < 0.001c
≤ 4 46.1 Ref.
5 to 8 49.4 2.1 0.4;3.7
9 to 11 51.9 3.3 1.7;4.9
≥ 12 54.5 4.8 2.9;6.7
Income change (1982 → 2004-2005) < 0.001d
Always poor 46.4 Ref.
Not poor → Poor 50.7 3.7 2.3;5.1
Poor → Not poor 49.7 2.7 1.3;4.2
Never poor 53.2 5.3 4.0;6.6
BMI (kg/m2) 0.003c
< 24.9 51.6 Ref.
25.0-29.9 50.5 -1.0 -1.9;0.0
≥ 30.0 49.3 -1.9 -3.4;-0.5
BMI: body mass index; Ref: reference
a Alcoholic beverages were not considered.
b Wilcoxon test.
c Linear trend test.
the percentage of participants with an adequate intake of these nutrients as the intake of ultra-processed foods increased (p < 0.001) (Table 5).
DISCUSSION
In this study, approximately 50.0% of the daily caloric intake among the cohort participants at 23 years of age
was attributed to the consumption of ultra-processed
foods, and there was a signiicant inluence of socio
-economic characteristics in this consumption. The
positive association between the consumption of
ultra-processed foods and intake of total and saturated fats,
cholesterol, sodium, iron, calcium, and the total caloric
intake indicates the negative effect of the consumption
of processed foods on health and the need for
imple-menting intervention strategies in this population. Previous studies following the same classiication for ultra-processed foods, using data from FBS in Brazil and from the Food Expenditure Survey in Canada, found that the percentage of the total household avail
-ability of foods attributed to ultra-processed foods was 28.0% and 61.7%, respectively.16,17 Furthermore,
the same Brazilian study showed a 9.0% increase in the availability of ultra-processed foods in a 15-year period. Considering that approximately 28.0% of food expenditure was spent on food for consumption
outside the home, most of the household consumption
by family members can probably be attributed to ultra-processed foods.16
In Brazil, public policies on the transmission of
informa-tion through the media and the packaging of food prod
-ucts remain limited. However, a major advancement, whose impact on food intake by the population could be assessed in future, is that food processing is now
discussed in the new version of the Guia Alimentar para a População Brasileira (Food Guide for the Brazilian
Population).c This version introduces the concept of
ultra-processed foods, thereby enabling them to be iden
-tiied by the population. The guide also covers important
issues that interfere in the consumption of these foods,
including supply, cost, time, and advertising.
The abovementioned guide addresses the role of adver
-tising in food choices because of the high levels of media exposure promoting the use of ultra-processed
foods14 and the beneits of fortiied foods, thereby
leading consumers to believe that processed fortiied foods must be healthier.15 This may be one explanation
for the association between higher education and higher
consumption of ultra-processed foods in the cohort,
considering that education and access to information are interrelated factors. Another factor may be the increased purchasing power of this population group.
In the present study, it was observed that ultra-processed foods were consumed, regardless of social mobility. However, in other studies that evaluated the association between social mobility and lifestyle, the prevalence of the behavior investigated (in this case smoking and physical inactivity) was in line with the new socioeco
-nomic status of the groups that presented changes in
Table 4. Consumption of nutrients considering the contribution of each quintile of the consumption of ultra-processed foods to the daily energy consumption at 23 years of age of the 1982 cohort from Pelotas, who were followed up in 2004-2005.
Nutrient
Contribution of each quintile of the consumption of ultra-processed foods to daily energy consumptiona
1 2 3 4 5
p
Average SE Average SE Average SE Average SE Average SE
% of energy from
Proteins 14.9 0.2 14.3 0.1 13.5 0.1 13.0 0.1 11.7 0.1 < 0.001b
Carbohydrates 65.6 0.3 62.2 0.3 60.2 0.2 57.7 0.3 54.7 0.3 < 0.001b
Total fat 19.5 0.2 23.5 0.2 26.3 0.2 29.3 0.2 33.6 0.3 < 0.001b
Saturated fats 6.0 0.1 7.0 0.1 7.5 0.1 7.9 0.1 8.2 0.1 < 0.001c
Trans fats 0.2 0.0 0.3 0.0 0.3 0.0 0.3 0.0 0.4 0.0 < 0.001c
Cholesterol (mg) 340.0 10.4 338.9 7.6 340.0 7.1 356.6 7.2 355.6 6.5 < 0.001c
Dietary fiber (g) 53.9 1.1 49.5 1.1 45.6 0.9 40.7 0.8 38.7 0.7 < 0.001b
Sodium (mg) 1802.2 47.0 2303.3 45.7 2508.3 46.5 2806.9 51.3 3213.9 59.0 < 0.001b
Iron (mg) 22.9 0.8 27.3 0.9 29.4 0.9 29.7 0.9 36.6 1.6 < 0.001b
Calcium (mg) 425.8 7.7 509.6 8.9 550.8 9.2 612.3 10.5 693.7 13.0 < 0.001b
Total energy (kcal)a 3049.8 47.8 3359.5 51.5 3487.7 50.3 3703.1 55.6 4192.0 60.4 < 0.001b
SE: standard error
a Alcoholic beverages were not considered for calculation of the consumption of total calories and ultra-processed foods.
b Linear trend test.
family income.2,13 In contrast, the positive association between the consumption of ultra-processed foods
and income found in this study was in keeping with
the positive correlation between consumption and the
household availability of this food group in Brazil.15
With respect to the inluence of the consumption of ultra-processed foods on the intake of certain nutri
-ents, a study conducted in Canada17 showed that the
percentage of protein in the diet was inversely corre
-lated with the household availability of ultra-processed foods and that the increased intake of ultra-processed
foods resulted in an increased consumption of fat and
sodium and a lower intake of dietary iber. However, this study found no association with the percentage of carbohydrates in the total diet.17
The amount of energy consumed is a cause for concern because of the possibility of positive energy balance in these individuals, which could lead to weight gain, although this hypothesis has not been addressed because of the transverse nature of the analysis. With respect to the nutrients mentioned in the previous paragraph, although a controversy exists,21 the association between
fat and sodium intake and the risk of cardiovascular is a cause for concern.8 It is speculated that some studies
may not ind any association between the intake of saturated fats and the risk of cardiovascular disease when these are replaced with carbohydrates, whereas their replacement with polyunsaturated fats could be beneicial to cardiovascular health.10,22,24 Monitoring the consumption of ultra-processed foods and the
health condition of these individuals may help eluci
-date this association, considering that the consump
-tion of carbohydrates was inversely correlated with the consumption of saturated fats in this study population (r = -0.52). With respect to trans fats, current reviews found an association between this type of fat, unfa
-vorable changes in lipid proile and risk for cardiovas
-cular disease.3,4,24 The consumption of trans fats was
low in the study population. However, the adequacy
to the tolerated limit of the consumption of trans fats of ≤ 1.0% of the total caloric intake decreased with the
increased consumption of ultra-processed foods. The percentage of individuals with an adequate intake of iron and calcium was higher among the cohort partic
-ipants who consumed more ultra-processed foods. This fact may indicate some beneits of consuming these products. The consumption of cheese, yogurt, and some sweets containing milk in its composition must have contributed to the higher calcium intake in participants with a higher consumption of ultra-processed foods, although the intake of cheese and yogurt contributed to only 2.0% of the total daily calories consumed. In addition, the proportion of subjects who achieved the recommended daily intake of calcium was very low, even in the upper quintile of the consumption of ultra-processed foods (16.4%).
In Brazil, DRC 344 of December 13, 2002 made the fortiication of wheat and maize lour with iron manda
-tory. This could explain the higher iron intake in indi
-viduals with a higher consumption of ultra-processed
Table 5. Adequate intake of nutrients and energy according to the contribution of each quintile of consumption of ultra-processed foods to the daily energy intake of the 1982 cohort from Pelotas, who were followed up in 2004-2005.
Percentage of subjects with adequate intake of nutrients
Contribution of each quintile of the consumption of ultra-processed foods to the daily
energy consumptiona
1 2 3 4 5
p
% SE % SE % SE % SE % SE
Percentage of energy from
Proteins (10.0%-15.0%) 50.8 1.7 59.2 1.7 64.4 1.7 67.7 1.6 62.6 1.7 < 0.001b
Carbohydrates (55.0%-75.0%) 77.3 1.4 81.9 1.3 75.0 1.5 64.3 1.7 47.4 1.7 < 0.001b
Total fat (15.0%-30.0%) 75.5 1.5 82.5 1.3 71.7 1.6 54.6 1.7 33.8 1.6 < 0.001b
Saturated fats (< 10.0%) 93.8 0.8 90.5 1.0 88.5 1.1 83.1 1.3 78.0 1.4 < 0.001c
Trans fats (< 1.0%) 99.2 0.3 98.9 0.4 97.0 0.6 97.1 0.6 92.3 0.9 < 0.001b
Cholesterol (≤ 300 mg) 60.0 1.7 53.1 1.7 52.6 1.7 48.2 1.7 45.1 1.7 < 0.001c
Dietary fiber (≥ 25 g) 85.5 1.2 81.4 1.3 80.2 1.4 74.3 1.5 73.3 1.5 < 0.001c
Sodium (≤ 2,000 mg/day) 70.3 1.6 50.0 1.7 43.0 1.7 34.0 1.6 21.5 1.4 < 0.001c
Iron (women: ≥ 18 mg/day;
men: ≥ 8 mg/day)
72.2 1.5 76.4 1.5 77.6 1.4 76.9 1.5 82.9 1.3 < 0.001b
Calcium (≥ 1,000 mg/day) 3.0 0.5 4.8 0.7 6.1 0.8 10.2 1.0 16.4 1.3 < 0.001c
SE: standard error
a Alcoholic beverages were not considered for calculation of the consumption of total calories and ultra-processed foods.
b Pearson’s Chi-square test.
foods. However, a recent study using data from four population-based surveys conducted with children < 6 years of age from Pelotas found that mandatory fortiication of lour and corn did not show any improve
-ment in the prevalence of anemia. The same study indicates that although an adequate intake of iron was observed in > 80.0% of the study group, the bioavail
-ability of iron added to lour was low (5.0%) because of the reduced use of iron by at least 50.0% of the mills in Brazil.1 Therefore, the increased iron intake through
the consumption of ultra-processed foods may not add any health beneits, which corroborates with the result of a recent study in which approximately 70.0% of the adult population of Pelotas reported the consumption of food products with voluntary fortiication of food items with vitamins and minerals.7
The use of a new classiication system that discrim
-inates food items based on industrial processing is considered positive.15 Previous studies using this recent classification were conducted based on household
food availability.16,18 Other advantages of the present
study relate to the methodological approach used to exclude outliers in the reporting of the FFQ, thereby decreasing the possibility of information bias. In addi
-tion, conducing the FFQ in a representative cohort with a high follow-up rate enables the the consequences of
the consumption of ultra-processed foods in the short
and long terms to be investigated.
The possibility of overestimating food consumption using the FFQ has been recognized.5 Furthermore, the
FFQ used in the 1982 cohort was not validated with an internal population. However, the questionnaire was derived from an instrument previously submitted
to validation20 and modiied only to meet regional food
habits (e.g., by including the consumption of herbal mate tea). Another limitation relates to the analysis
of the association between the consumption of
ultra-processed foods and nutritional status, which may have been affected by reverse causality.
A large proportion of the daily food intake in the 1982
cohort was attributed to the consumption of
ultra-processed foods. The consumption of this food group was higher among individuals with higher educa
-tion and income throughout life, possibly indicating a greater outreach for this food group, and is associ -ated with an improved economic condition and the
increased search for ready-to-eat meals by this group.
The effect of the consumption of ultra-processed foods
on the increased intake of certain nutrients including fat, sodium, and cholesterol was also observed. Therefore, the results of this study underscore the importance of monitoring the consumption of
ultra-processed foods and the influence these products
may have on consumers’ health and nutritional status, whether by current or future observation.
1. Assunção MC, Santos IS, Barros AJ, Gigante DP, Victora CG. Flour fortification with iron has no impact on anaemia in urban Brazilian children. Public Health Nutr. 2012;15(10):1796-801. DOI:10.1017/S1368980012003047
2. Azevedo MR, Horta BL, Gigante DP, Victora CG, Barros FC. Fatores associados ao sedentarismo no lazer de adultos na coorte de nascimentos de 1982, Pelotas, RS. Rev Saude Publica. 2008;42(Supl 2):70-7. DOI:10.1590/S0034-89102008000900010
3. Booker CS, Mann JI. Trans fatty acids and cardiovascular health: translation of the evidence base. Nutr Metab Cardiovasc Dis. 2008;18(6):448-56. DOI:10.1016/j.numecd.2008.02
4. Brouwer IA, Wanders AJ, Katan MB. Effect of animal and industrial trans fatty acids on HDL and LDL cholesterol levels in humans: a quantitative review. PLoS One. 2010;5(3):e9434. DOI:10.1371/journal.pone.0009434
5. Cade J, Thompson R, Burley V, Warm D. Development, validation and utilisation of food-frequency
questionnaires: a review. Public Health Nutr. 2002;5(4):567-87. DOI:10.1079/PHN2001318
6. Canella DS, Levy RB, Martins AP, Claro RM, Moubarac JC, Baraldi LG, et al. Ultra-processed food products and obesity in Brazilian households
(2008-2009). PLoS One. 2014;9(3):e92752. DOI:10.1371/journal.pone.0092752
7. Cirino AC, Vargas Zanini R, Gigante DP. Consumption of foods with voluntary fortification of micronutrients in southern Brazil: prevalence and associated factors. Public Health Nutr. 2014;17(7):1555-64. DOI:10.1017/S1368980013001857
8. Clarke R, Frost C, Collins R, Appleby P, Peto R. Dietary lipids and blood cholesterol: quantitative meta-analysis of metabolic ward studies. BMJ. 1997;314(7074):112-7. DOI:10.1136/bmj.314.7074.112
9. Halpern R, Barros AJD, Matijasevich A, Santos IS, Victora CG, Barros FC. Estado de desenvolvimento aos 12 meses de idade de acordo com peso ao nascer e renda familiar: uma comparação de duas coortes de nascimentos no Brasil. Cad Saud Publica. 2008;24(Supl 3):S444-50. DOI:10.1590/S0102-311X2008001500010
10. Kuipers RS, Graaf DJ, Luxwolda MF, Muskiet MH, Dijck-Brower DA, Muskiet FA. Saturated fat, carbohydrates and cardiovascular disease. Neth J Med. 2011;69(9):372-8.
11. Malik VS, Willett WC, Hu FB. Global obesity: trends, risk factors and policy implications. Nat Rev Endocrinol. 2013;9(1):13-27. DOI:10.1038/nrendo.2012.199
12. Martins APB, Levy RB, Claro RM, Moubarac JC, Monteiro CA. Increased contribution of ultra-processed food products in the Brazilian diet (1987-2009). Rev Saude Publica. 2013;47(4):656-65. DOI:10.1590/s0034-8910.2013047004968
13. Menezes AM, Minten GC, Hallal PC, Victora CG, Horta BL, Gigante DP, et al. Smoking prevalence in the 1982 birth cohort: from adolescence to adult life, Pelotas, Southern Brazil. Rev Saude Publica. 2008;42(Supl 2):78-85. DOI:10.1590/S0034-89102008000900011
14. Monteiro CA. Nutrition and health. The issue is not food, nor nutrients, so much as processing. Public Health Nutr. 2009;12(5):729-31. DOI:10.1017/S1368980009005291
15. Monteiro CA, Levy RB, Claro RM, Castro IRR, Cannon G. A new classification of foods based on the extent and purpose of their processing. Cad Saude Publica. 2010;26(11):2039-49. DOI:10.1590/S0102-311X2010001100005
16. Monteiro CA, Levy RB, Claro RM, Castro IR, Cannon G. Increasing consumption of ultra-processed foods and likely impact on human health: evidence from Brazil. Public Health Nutr. 2011;14(1):5-13. DOI:10.1017/S1368980010003241
17. Moubarac JC, Martins AP, Claro RM, Levy RB, Cannon G, Monteiro CA. Consumption of ultra-processed foods and likely impact on human health. Evidence from Canada. Public Health Nutr. 2013;16(12):2240-8. DOI:10.1017/S1368980012005009
18. Moubarac JC, Batal M, Martins AP, Claro R, Levy RB, Cannon G, et al. Processed and ultra-processed food products: consumption trends in Canada from 1938
to 2011. Can J Diet Pract Res. 2014;75(1):15-21. DOI:10.3148/75.1.2014.15
19. Pinheiro ABV, Lacerda EMA, Benzecry EH, Gomes MCS, Costa VM. Tabela de avaliação de consumo alimentar em medidas caseiras. 5.ed. Rio de Janeiro: Atheneu; 2005.
20. Sichieri R, Everhart JE. Validity of a Brazilian food frequency questionnaire against dietary recalls and estimated energy intake. Nutr Res. 1998;18(10):1649-59. DOI:10.1016/S0271-5317(98)00151-1
21. Siri-Tarino PW, Sun Q, Hu FB, Krauss RM.
Meta-analysis of prospective cohort studies evaluating the association of saturated fat with cardiovascular disease. Am J Clin Nutr. 2010;91(3):535-46. DOI:10.3945/ajcn.2009.27725
22. Siri-Tarino PW, Sun Q, Hu FB, Krauss RM. Saturated fatty acids and risk of coronary heart disease: modulation by replacement nutrients. Curr Atheroscler Rep. 2010;12(6):384-90. DOI:10.1007/s11883-010-0131-6
23. Victora CG, Barros FC. Cohort profile: the 1982 Pelotas (Brazil) birth cohort study. Int J Epidemiol. 2006;35(2):237-42. DOI:10.1093/ije/dyi290
24. Willett WC. Dietary fats and coronary heart disease. J Intern Med. 2012;272(1):13-24. DOI:10.1111/j.1365-2796.2012.02553.x
25. World Health Organization. Diet, nutrition and the prevention of chronic diseases: Report of a Joint WHO/ FAO Expert Consultation. Geneva; 2003. (WHO Technical Report Series, 916).
These results were part of the study titled: “Coorte de Nascimentos de Pelotas, 1982”, which was funded by the International Development Research Centre (IDRC) under process 87-0232-03; the World Health Organization, under case C6/370/17A; the Overseas Development Administration, the European Union, the Programa de Apoio a Núcleos de Excelência (PRONEX), the Conselho Nacional de Desenvolvimento Científico e Tecnológico (CNPq – under process 66.1279/1996-2); the Brazilian Ministry of Health and the Wellcome Trust under case 086974/Z/08/Z.