Márcia de Jesus Rocha Pereira BastosI
Jacira dos Anjos PereiraI Dorian Chim SmarzaroI Everaldo Francisco CostaII Regina Célia Lobo BossanelIII Durvalina Maria Sesari OliosaIV Joseanny Gomes Poltronieri PereiraV
Hideko Nagatani FeitosaV Marcilene Favarato da CostaV Fabiano José Pereira de OliveiraI Juliana Lopes FáveroVI
Ethel Leonor Noia MacielVI
I Secretaria Municipal de Saúde. Prefeitura Municipal de Vitória. Vitória, ES, Brasil II Secretaria de Cidadania e Direitos
Humanos. Prefeitura Municipal de Vitória. Vitória, ES, Brasil
III Secretaria de Transportes e Infra-estrutura Urbana. Prefeitura Municipal de Vitória. Vitória, ES, Brasil
IV Secretaria de Segurança Urbana. Prefeitura Municipal de Vitória. Vitória, ES, Brasil V Secretaria da Fazenda. Prefeitura Municipal
Vitória. Vitória, ES, Brasil
VI Programa de Pós-Graduação em Saúde Coletiva. Centro de Ciências da Saúde. Universidade Federal do Espírito Santo. Vitória, ES, Brasil
Correspondence: Ethel Leonor Noia Maciel
Programa de Pós-Graduação em Saúde Coletiva
Centro de Ciências da Saúde-UFES Av. Marechal Campos, 1.468 Maruípe 29040-090 Vitória, ES, Brasil E-mail: [email protected] Received: 5/20/2008 Approved: 7/11/2008
Ecological analysis of accidents
and lethal violence in Vitória,
Southeastern Brazil
ABSTRACT
OBJECTIVE: To analyze the socioeconomic background and its relationship with spatial distribution of mortality due to violence.
METHODS: Ecological study conducted to explore the space distribution of mortality due to violence in the city of Vitória, Southeastern Brazil, between 2000 and 2003, based on population and socioeconomic information. Mortality data were correlated with information on victim’s place of residence, type of violence, gender, and skin color. Data were analyzed using space average, odds ratio, and cluster analysis.
RESULTS: There were reported 828 deaths due to violence during the study period, accounting for 17% of all deaths in the city. Of these, 72% were homicides, 21.8% traffi c accidents, and 6% suicides. Violence victims were mostly young black males, living in poorer areas of the city. In contrast, as for suicide and traffi c accidents, the victims were older white females living in the wealthiest area of the city.
CONCLUSIONS: The study showed that violence is a phenomenon occurring in all socioeconomic levels but black people at the lowest level are more likely to die from homicides while white well-off people are more likely to die from suicide and traffi c accidents.
DESCRIPTORS: Accidents, mortality. Violence, mortality. External Causes. Mortality. Socioeconomic Factors. Ecological Studies.
INTRODUCTION
Accidents and violence constitute a set of health events that may lead to death. They can be classifi ed as accidental – due to traffi c, occupation, falls, poisoning, drowning and other types of accidents – or intentional causes (assaults and self-infl icted injuries). All these events are included in the International Classifi cation of Diseases (ICD) underexternal causes of morbidity and mortality.15,16
In Brazil, external causes accounted for 9.3% of all deaths in 198014 and 14.6% in 2003, ranking third among leading mortality indicators nationwide, in the Southeast region od Brazil (13.3%) and in the city of Vitória, state of Espírito Santo (17.3).a
Homicides, suicides, and traffi c accidents are the leading external causes of death in the state of Espírito Santo. Damages, injuries, traumas and deaths due to transport accidents and violence are associated to high emotional and social cost and lead to great utilization of the public security, health, and
likely to be targeted in state-run interventions through actions such as law proposals for crime reduction and control or the implementation of traffi c engineering and control measures.
Effective monitoring and control of accidents and le-thal violence in the city of Vitória has been considered maximum prerogative and technology has been applied for digital mapping with a system of capture, storage, management, analysis, and presentation of spatial data. The geographical information system (GIS) has contributed for more effective policy formulation for multisectoral intervention through analyses of spatial data in health.17,18,23
Thus, the objective of the present study was to analyze the socioeconomic background and its relationship with spatial distribution of mortality due to homicide, suicide and traffi c accident.
METHODS
The study area was the city of Vitória. Vitória has a territorial area of 93,381 km² comprising an island – the city’s cradle –, and a continental section, of recent development. The city is divided into seven administra-tive areas (area I – Downtown; area II – Santo Antônio; area III – Bento Ferreira; area IV – Maruípe; area V – Praia do Canto; area VI – continental Vitória and area VII – São Pedro). Despite its more recent develop-ment, area VI (continental Vitória) is the most densely populated part of the city. Between 1980 and 2004, the city’s population doubled: from 207,515 inhabitants in 1980, 253,758 in 1990, to 305,898 in 2004 of which 144,349 men and 161,549 women.
An ecological study was conducted. Population and socioeconomic information were obtained from the lo-cal Department of Treasury (SEMFA) and the Brazilian Institute of Geography and Statistics (IBGE) based on the 2000 Population Census, projected or not for the study period. Mortality data were obtained from the Mortality Information System (SIM) and the Municipal Health Department of Vitória (SEMUS) provided data on specifi c and total mortality. Since the year 2000, SEMUS has been monitoring all accidents and violence and investigating all deaths occurring in the city.
External causes of deaths included transport accidents, homicides and suicides occurring in the city between 2000 and 2003. Transport accidents were classifi ed ac-cording to the International Classifi cation of Diseases, 10th revision (ICD-10) under codes V01 to V89 and subgrouped as follows, based on the victim’s means of transportation: pedestrian (V01 to V09), cyclist (V10 to V19), motorcycle rider (V20 to V29), occupant of three-wheeled motor vehicle (V30 to V39), car occu-pant (V40 to V49), occuoccu-pant of pick-up truck or van
(V50 to V59), occupant of heavy transport vehicle (V60 to V69), bus occupant (V70 to V79) and others (V80 to V89). For the analysis, they were grouped as pedestrian, motorcycle rider, and vehicle occupant accident which included all accidents with occupants of car, bus, pick-up truck, and heavy transport vehicle but excluding cyclist, three-wheeled motor vehicle and other accidents. Subgrouping was carried out due to specifi c interventions required for these three categories of accidents.
Information on homicide and suicide were classifi ed under the ICD-10 Chapter XX, V01 to Y98, and death due to assault (homicide) under codes X85 to Y09. Data on events of undetermined intent (Y10 to Y34) obtained from SIM were reassessed through review of medical examiner and police reports and newspaper headlines. They were reclassifi ed according to the fi ndings of the local monitoring agency.
Data analysis included a consistency analysis fol-lowed by an early exploratory descriptive analysis by administrative area. Deaths due to transport accidents and homicides were correlated with the victim’s infor-mation: place of residence (district, microregion), age, gender, race/skin color.
Georeferencing of information and spatial analysis were carried out based on the city’s digital network divided into administrative areas. Spatial average was estimated using latitude/longitude coordinates of district points, and simple and weighted averages were estimated based on the occurrence of the follo-wing events: homicide, transport accident, suicide and the variable race/skin color to assess distribution differences.
To estimate the spatial average variables of point co-ordinates were created using the functions GetX and GetY in the calculator of ArcView program and through a routine in an electronic chart for estimating averages based on the following formulas:
Simple average:
(xmc,ymc) = (∑ni=1 xi/n, ∑ni=1 yi/n), where:
xmc,ymc are coordinates of center average;
xi,yi are coordinates at the i point, and n is the number of points.
Weighted average:
(xwmc,ywmc) = (∑ni=1 wi *xi/∑ni=1 wi, ∑ni=1 wi *yi/∑ni=1 wi), where:
A text format fi le was created with coordinates of weighted and non-weighted averages and average mapping for the island and continental areas of the city of Vitória.
For georeferencing of information ArcView 9.2 was used. After data formatting in the charts, the application ArcMap was used to create thematic maps showing the distribution of georeferenced cases in the city.
Socioeconomic data was analyzed through clusters according to the Urban Quality of Life Indexa (UQLI) available, calculated by the local administration. UQLI is a compound, quantitative, descriptive indicator resulting from other combined single indicators. It consists of four dimensions:
Education dimension: refers to the level of scho-•
oling: proportion (%) of illiterate people over 15 years of age; proportion (%) of household heads with less than four years of schooling; proportion (%) of household heads with 15 years or more of schooling.
Income dimension: refers to income concentration •
and inequality: mean income of household heads in monthly minimum wages (MMWs); proportion (%) of household heads with income less than 2 MMWs; proportion (%) of household heads with income over 10 monthly minimum wages.
Housing dimension: measures the level of comfort: •
mean number of persons per household; mean number of bathrooms per household.
Environmental dimension: refl ects infrastructure •
of urban services: proportion (%) of households with adequate water supply linked to the main water system; proportion (%) of households with adequate sewage system linked to the main or rain water system; proportion (%) of households with adequate garbage collection – collected by the city collection service or placed in large containers for collection.
UQLI classifi cation scores ranges from 0 to 1 with increasing quality of life and better life conditions close to 1.
RESULTS
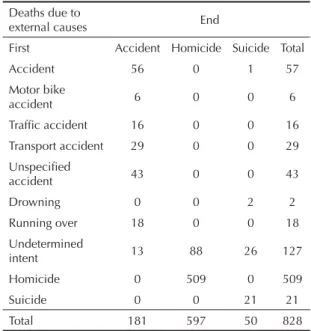
Between 2000 and 2003, there were 828 deaths due to accidents and violence accounting for 17% of all deaths in the city. Of these, 72% were homicides, 21.8% transport accidents and 6% suicides. These deaths were reclassifi ed which allowed to identifying all causes of deaths previously categorized as undeter-mined (Table 1).
The comparison of event occurrences in the admin-istrative areas showed homicide as the main cause of death, accounting for most deaths in six out of seven administrative areas. As for traffi c accidents, the high-est rates were found in Praia do Canto, Downtown and continental Vitória. São Pedro was the most violent area, accounting for 19% of all deaths due to violence in the city, of which 92.5% were homicides. In Praia do Canto running overs and suicides occurred more frequently than homicides. Of all deaths, the area of occurrence was not identifi ed in 35 events (4.22%) (Table 2). Figure 1 shows the spatial distribution of homicides and suicides in the city’s administrative areas. Of 597 homicides, 62% were clustered in three administrative areas: São Pedro, Maruípe, and Bento Ferreira. Suicides had a different distribution compared to homicides, with higher number of cases in Praia do Canto, Santo Antônio, and Continental Vitória.
A distinct pattern is seen in the spatial distribution of deaths due to homicide and transport accident (Figure 2). Homicides were more clustered in the north of the island and traffi c accidents in the south. In continental Vitória, there is no major difference in the spatial dis-tribution of these deaths.
The distribution of events by age showed that median age of vehicle occupants involved in accidents was 35 years. Accidents with motorcycle occupants
pre-a Municipal Administration of Vitória. Urban Quality of Life Index (UQLI) of Vitória districts – 1991 and 2000. [cited 2008 Nov 24]. Available at: http://www.vitoria.es.gov.br/secretarias/estrategica/iqu1991a2000.htm
Table 1. Distribution of deaths due to fi rst and end external causes after death review. Vitória, Southeastern Brazil, 2000–2003.
Deaths due to
external causes End
First Accident Homicide Suicide Total
Accident 56 0 1 57
Motor bike
accident 6 0 0 6
Traffi c accident 16 0 0 16
Transport accident 29 0 0 29
Unspecifi ed
accident 43 0 0 43
Drowning 0 0 2 2
Running over 18 0 0 18
Undetermined
intent 13 88 26 127
Homicide 0 509 0 509
Suicide 0 0 21 21
Total 181 597 50 828
dominantly occurred in young people of productive age (median age of 25 years). Median age of running over victims was 37; 25% were 60 years or more and 25% were less than 23 years. Median age of homicide victims was 24 years, and 75% of them were less than 35 years. Mean age of suicide victims was 37 years.
In the cluster analysis administrative areas were clas-sifi ed according to UQLI. Inequality was found in the island of Vitória; there were areas of high UQLI very close to those with low UQLI, such as Praia do Canto and Bento Ferreira, situated south to the island. The northern area of the island had low UQLI with areas
Figure 1. Distribution of homicides and suicides by administrative areas of the city of Vitória. Vitória, Southeastern Brazil, 2000–2003.
Source: Municipal Health Department of Vitória
Vila Velha
Vitória Cariacica
Serra
Type of deaths
Homicide
N
Suicide 4 Bento Ferreira/ Jucutucara
5 Centro 1 Continental
3 Maruípe 2 Praia do Canto
6 Santo Antônio 7 São Pedro
City limit
Administrative area
1
2
3
4
7
6
5
Table 2. Distribution of deaths by administrative areas and cause. Vitória, Southeastern Brazil, 2000–2003.
Administrative area Motor bike accidents Traffi c accidents Running over Homicide Suicide Total
n % n % n % n % n % n %
Centro 4 3.92 11 10.78 23 22.55 60 58.82 4 3.92 102 12.31
Santo Antônio 1 0.91 2 1.82 8 7.27 89 80.91 10 9.09 110 13.28
Bento Ferreira 2 1.59 3 2.38 12 9.52 107 84.92 2 1.59 126 15.21
Maruípe 3 2.17 4 2.9 10 7.25 119 86.23 2 1.45 138 16.7
Praia do Canto 4 7.27 7 12.73 15 27.27 14 25.54 15 27.27 55 6.64
Continental Vitória 5 4.95 17 16.83 19 18.81 51 50.5 9 8.91 101 12.19
São Pedro 0 0 4 2.48 3 1.86 149 92.55 5 3.1 161 19.45
Area of occurrence
5 14.28 7 20 12 34.28 8 22.85 3 8.57 35 4.22
Unidentifi ed
Total 24 2.9 55 6.65 102 12.31 597 72.1 50 6.03 828 100
of very low quality of life such as São Pedro and part of Santo Antônio. Continental Vitória showed a more homogeneous pattern, predominantly with intermedi-ate to high UQLI.
The distribution of men and women by administrative area was similar to the city’s general distribution, 52% women and 48% men. The analysis of violent death distribution by gender showed that 87.8% of the victims were men and 12.2% were women. Figure 3A illustrates the predominant disparity between men and women in areas with the lowest UQLI.
Homicide deaths were found in all areas but more fre-quently in those with lower UQLI and they decreased with increasing UQLI. The highest death rates were seen in São Pedro, where 92.5% of deaths were due to homicides, followed by Maruípe (86.2%) and Bento Ferreira (84.9%). São Pedro area showed the lowest UQLI while Maruípe and Bento Ferreira areas had a heterogeneous pattern with high, intermediate and low UQLI. Figure 3B shows the spatial distribution of homicide deaths by UQLI and race/skin color. It shows a different pattern from that seen for deaths
due to traffi c accident and suicide. Overall, victims of homicide and other violent deaths were mostly black people (77%), who were also the victims in 84% of homicides and 69% of running overs, and these deaths occurred in the northern area of the island in districts with the lowest UQLI. In contrast, suicide and trans-port accidents occurred more frequently among white people and in high UQLI areas in the southern part of the island. Compared to white, black people were 3.7-fold (95% CI: 2.5;5.5) more likely to die due to homicide in Vitória. In continental Vitória, no statis-tically signifi cant difference was found in the spatial distribution although a similar pattern of deaths by race/skin color was seen.
DISCUSSION
The ecological approach applied in the present study allowed to analyzing homicide, suicide and traffi c ac-cidents in clusters of districts; however, this approach has intrinsic limitations. Ecological studies are based on population rather than individuals, and the relation-ship between these events and clusters of districts does not necessarily refl ect the individual status. This design
Figure 2. Spatial distribution of homicides and land transport accidents in the island and continent. Vitória, Southeastern Brazil, 2000–2003
Source: Municipal Health Department of Vitória
Vila Velha Serra
Cariacica
Vitória
may also produce the so-called ecological fallacy (inappropriate generalization of the characteristics of a cluster, such as a district, to its constituent elements such as inhabitants, neighborhoods or health units). In addition, the study of administrative areas may have led to varied results because of specifi c characteristics of each district. However, this choice is justifi ed by the fact that the implementation of public policies is based on administrative areas.
Life conditions in the city improved between 1991 and 2000 with increased mean UQLI. However, a study conducted in 200620 in all Brazilian municipali-ties showed that Vitória is a capital city with one of
the highest rates of homicide and injuries. The high death rate seen in the city is comparable to that found nationwide, where 14% of all deaths are due to exter-nal causes,a ranking third among mortality indicators nationwide.
Several studies support the fi ndings of our study and reported a growing trend of these events and pointed homicides as the leading cause of death due to ex-ternal causes.6,11 According to Moraes et al,14 traffi c accidents were the leading cause of death in Brazil until 1990s when they were surpassed by homicides, which reportedly were the leading external cause of death in the year 2000.4
Fonte: Secretaria Municipal de Saúde de Vitória
Figure 3A. Distribution of deaths according to the urban quality of life index in the administrative areas by gender. Vitória, Southeastern Brazil, 2000–2003.
N Serra
Cariacica
Vila Velha
Vitória
City limit No information Mean UQLI
Male Female Gender 0.2 - 0.34
0.34 - 0.47 0.47 - 0.59 0.59 - 0.71 0.71 - 0.84 Districts
Administrative area
Several authors have described a strong relationship between urban decay and its impacts on life condi-tions, supporting the assumption that violence is not only brought about by poverty but rather by a set of related factors.2,13,18,21 They claim there is a correlation between the magnitude of homicides seen in macrore-gions with the lowest UQLI and poor socioeconomic conditions.2,3
According to Minayo,13 (1990) the process of urban-ization in Brazil has brought about migration fl ows into the cities encouraged by false promising ideals of consumption. These migrants have settled in the city’s outskirts and slums, areas where basic infrastructure is almost inexistent in violation of fundamental human rights, making residents of these areas more vulnerable to violence as verifi ed in our study.
A similar background was described in the city of Recife, northeastern Brazil,6 where mortality rates due to homicides are higher among those with poorer life conditions and traffi c accidents and suicides are more frequent among those better off. Lima & Ximenes6 claim that most traffi c accidents occur in better off ar-eas probably due to greater fl ow of cars and people. Some authors4,6 have reported male excess mortality. Barata et al2 suggest that life conditions at the place of residence have greater impact on male deaths and that mortality rates decrease as life conditions improve. Lau-renti et al5 also noted that higher male mortality cannot be explained by gender (biological variable) but rather by social and behavioral factors (gender variable).
Nationwide, male adolescents and young adults are the most vulnerable to these deaths, especially those with Serra
Cariacica
Vila Velha
Vitória
N p
City limit No information Mean UQLI
Black White Yellow Ethnicity 0.2 - 0.34
0.34 - 0.47 0.47 - 0.59 0.59 - 0.71 0.71 - 0.84 Districts
Administrative area
Source: Municipal Health Department of Vitória
lower socioeconomic condition living in urban areas, a trend that has also been described in various studies of mortality due to violent causes.1,8,9,a In the city of São Paulo (southeastern Brazil), over a 35-year period (1960–1995), homicide rates among male adolescents aged 15–19 increased from 9.6 to 186.7 per 100,000 inhabitants, i.e., by 1.800%.11 These victims are characteristically unskilled young people with lower income and no perspectives of entering the formal labor market. Deaths due to homicide are a major cause of years of potential life lost.6,19
In Vitória, the proportion of deaths of vehicle occupants in traffi c accidents was similar to that reported in the city of Belém, northern Brazil,10 where in 1979, male victims aged between 20 and 49 accounted for more than 50% of all deaths. The characteristics of running over victims were similar to those described in Recife (northeastern Brazil), where elderly people were the main victims, especially elderly women over 60.6 As for motorcycle accidents, a similar trend to that of other Brazilian cities is seen Vitória where most victims are young adults.22 In regard to suicides, corroborating the
fi ndings of the present study7, other studies showed higher rates among adults aged 35–54.
Most importantly, the present study found that ethnicity is an important marker of social inequality. Compared to White people, the Black population was nearly 4-fold more likely to die. This fi nding corroborates Minayo fi ndings13 reporting that non-White young
people are the most vulnerable to violence refl ecting the state of social inequality of those living in areas with low urban quality of life and experiencing vio-lence in their daily life. It also points out the hidden violence of these social environments.
Besides investigating lethal violence in Vitória, the pres-ent study established a single database of georeferenced data integrating four different municipal departments: health, transportation, public security and citizen’s rights. It also provided input to redirect public policies with the implementation of “Vitória da Paz” (victory of peace),an intervention program for traffi c accident pre-vention in high-risk areas, to reinforce municipal police actions at school areas in São Pedro area and to reassign police force in the city. These actions call for ongoing efforts because violence is not an isolated phenomenon and has social roots that are changing and adjusting to the machinery of the state administration.
It is essential to increase violence surveillance and to call the attention of public authorities for the need of improving coordination of the different sectors for an effective, competent response to these events. The best public effort would be to focus on prevention of these deaths and promotion of integrated multisectoral actions because the problems experienced in these areas due to poverty, social inequality and exclusion – including daily violation of basic human rights – seem to be fundamentally arising from equity and social justice issues.
1. Assis S. Crescer sem violência: um desafi o para educadores. Brasília: Ser: Superando a violência; 1997.
2. Barata RB, Ribeiro MCSA, Moraes JC. Desigualdades sociais e homicídios em adolescentes e adultos jovens na cidade de São Paulo em 1995. Rev Bras Epidemiol. 1999;2(1/2):50-9. DOI: 10.1590/S1415-790X1999000100005
3. Beato Filho CC, Assunção RM, Silva BFA, Marinho FC, Reis IA, Almeida MCM. Conglomerados de homicídios e o tráfi co de drogas em Belo Horizonte, Minas Gerais, Brasil, de 1995 a 1999. Cad Saude Publica. 2001;17(5):1163-171. DOI: 10.1590/S0102-311X2001000500017
4. Gawryszewski VP, Koizumi MS, Mello-Jorge MHP. As causas externas no Brasil no ano 2000: comparando a mortalidade e a morbidade. Cad Saude Publica.
2004;20(4):995-1003. DOI: 10.1590/S0102-311X2004000400014
5. Laurenti R, Mello-Jorge MHP, Gotlieb SLD. Perfi l epidemiológico da morbi-mortalidade masculina.
Cienc Saude Coletiva. 2005;10(1):35-46. DOI: 10.1590/S1413-81232005000100010
6. Lima MLC, Ximenes R. Violência e morte: diferenciais da mortalidade por causas externas no espaço urbano de Recife, 1991. Cad Saude Publica. 1998;14(4):829-40. DOI: 10.1590/S0102-311X1998000400025
7. Marin-León L, Barros MBA. Mortes por suicídio: diferenças de gênero e nível sócio-econômico. Rev Saude Publica. 2003;37(3):357-63. DOI: 10.1590/ S0034-89102003000300015
8. Mello Jorge MHP. Mortalidade por causas violentas no município de São Paulo. Mortes intencionais. Rev Saude Publica. 1981;15(2):165-93. DOI: 10.1590/ S0034-89101981000200003
9. Mello Jorge MHP. Mortes violentas em menores de 15 anos no Brasil. Bol Of Sanit Panam. 1986;100(6);590-606. 10. Mello Jorge MHP, Latorre MR. Acidentes de trânsito
no Brasil: dados e tendências. Cad Saude Publica.
1994;10(Supl1):S19-44. DOI: 10.1590/S0102-311X1994000500003
11. Mello Jorge MHP. Os adolescentes e jovens como vítimas da violência fatal em São Paulo. In: Pinheiro OS, organizador. São Paulo sem medo: um diagnóstico da violência urbana. Garamond; 1997, p.97-120.
12. Mello Jorge MHP, Gawryszewski VP, Latorre MRDO. I – Análise dos Dados de Mortalidade. Rev Saude Publica. 1997;31(4):5-25. DOI: 10.1590/S0034-89101997000500002
13. Minayo MCS. A violência na adolescência: Um problema de Saúde Pública. Cad Saude Publica. 1990;6(3):278-92. DOI: 10.1590/S0102-311X1990000300005
14. Moraes JR, Silva AAM, Lamy Filho F, Silva RA. Tendências da mortalidade por causas externas, em São Luis, MA, de 1980 a 1999. Rev Bras Epidemiol. 2003;6(3):245-54. DOI: 10.1590/S1415-790X2003000300008
15. Organização Mundial de Saúde. Manual de classifi cação estatística internacional de doenças, lesões e causa de óbito – Nona conferência de revisão. São Paulo: Centro Brasileiro de classifi cação de doenças em português; 1985.
16. Organización Mundial de La Salud. La salud de los adolescentes y los jóvenes em ias américas: Escrebiendo el futuro. Washington; 1995. [Cominicación para la salud, 6].
17. Ruzany MH, Andrade CLT, Esteves MAP, Pina MF, Szwarcwald CL. Avaliação das condições de atendimento do Programa de Saúde do Adolescente no Município do Rio de Janeiro. Cad Saude Publica. 2002;18(3):639-49. DOI: 10.1590/S0102-311X2002000300013
18. Santos SM, Barcellos C, Carvalho MS, Flôres R. Detecção de aglomerados espaciais de óbitos por causas violentas em Porto Alegre, Rio Grande do Sul, Brasil, 1996. Cad Saude Publica. 2001;17(5):1141-51. DOI: 10.1590/S0102-311X2001000500015
19. Souza ER. Homicides in Brazil: the major villain for public health in the 1980s. Cad Saude Publica.
1994;10(Supl 1):45-60. DOI: 10.1590/S0102-311X1994000500004
20. Souza ER, Lima MLC. The panorama of urban violence in Brazil and its capitals. Cienc Saude Coletiva. 2006;11(2):363-73. DOI: 10.1590/S1413-81232006000200014
21. Spagnol AS. Jovens delinqüentes paulistanos. Tempo Soc. 2005;17(2):275-99. DOI: 10.1590/S0103-20702005000200012
22. Veronese AM, Oliveira DLLC. Os riscos dos acidentes de trânsito na perspectiva dos motoboys: subsídios para promoção de saúde. Cad Saude Publica. 2006;22(12):2717-21. DOI: 10.1590/S0102-311X2006001200021
23. Waiselfi sz JJ. Mapa da violência IV: os jovens do Brasil (síntese) Brasília: UNESCO; 2004.
REFERENCES