A
SSESSMENT OF THE
G
REEN
I
NFRASTRUCTURE OF
B
UCHAREST USING
CORINE
AND
U
RBAN
A
TLAS DATA
Alexandru-Ionuţ PETRIŞOR “Ion Mincu” University of Architecture and Urban Planning, Bucharest, Romania & National Institute for Research and Development in Constructions, Urban Planning and Sustainable Spatial Development URBAN-INCERC, e-mail: [email protected]
Abstract. Urban ecology provides the theoretical foundation for assessing the interaction between man and nature in cities. Nature seems to be reduced and malfunctioning, resulting into a decrease in the ecosystem services provided to humans. The new method, based on assessing the green infrastructure, is designed to replace monetary and carbon footprint assessments and be particularly relevant for the urban areas, which grow and change fast and are the main drivers of environmental changes. This study uses 2005-2007 CORINE and Urban Atlas data to look at Bucharest. The results show that, despite of the method, the area occupied by the green infrastructure represents about 1/3 of the total area, corresponding to 50 m2/person, although the green spaces only account for 6.5 m2/person, which is far below the European average (26 m2/person).
Key words: urban ecology, ecosystem services, footprint, fragmentation.
1. Introduction In time, urban ecology research focused on three directions: (1) ecology in the city (differences from natural systems), (2) ecology of the city (city as an ecological system), and (3) sustainability of cities (Wu, 2014). The importance of these studies is justified by the fact that more than 50% of current population is urban (Wu, 2014). In the cities, several species exist in addition to humans; ecologists
identify hemerophilous, especially
synanthropic species, but also ubiquitous, opportunistic and, sometimes, random ones; humans also favor the alochtonous ones, including invasive ones, and domestic ones; most species are present
in the green areas (Noblet, 1994, 2005; Petrişor, 2008a, 2010, 2013). The city nature has been classified as: (1) remains of natural systems (urban forests, parks representing former forests), (2) extension of natural systems (agriculture, forests), (3) landscaped areas (green spaces), and (4) spontaneous, invasive or ruderal species (Qureshi and Breuste, 2010;
Breuste et al., 2013).
amounts exceeding the contribution of primary producers (Petrişor and Sârbu, 2010). The low diversity results into a
decreased stability, understood as
ability to mitigate the destabilizing
fluctuations; from a succession
standpoint, the final consequence is
ecological immaturity of
man-dominated systems (Petrişor, 2013).
A complementary perspective is
introduced by ecosystem services,
representing the benefits provided by ecosystems to human society, and classified as: (1) supply (food, water), (2) regulation (flood and disease control), (3) cultural (spiritual, recreational, and cultural benefits), and (4) support (nutrient cycling) (Zakri and Watson, 2003; Watson and Zakri, 2005). This perspective is correlated with the functional one, since the biological yields
turns in a normally functioning
ecological system into goods and services, offered to the human society
(Ianoş et al., 2009).
Ecosystem services can be assessed using at least three approaches.
(1) Classical/ monetary: goods and services receive a market value, through substitution or hypothetical markets or indirect methods (Negrei, 1996).
(2) Carbon footprint measures human pressure by estimating the terrestrial or marine area with biological yield that should be regenerated due to the exhaustion of resources and generation of
waste (Peptenatu et al., 2010; Stan et al.,
2013), or the natural area required to support a human population with the same lifestyle (Petrişor, 2008b).
(3) Presence of the green infrastructure, representing a strategically planned network of natural and semi-natural quality areas and other environmental features, designed and managed such
that it could provide ecosystem services
and preserve urban and rural
biodiversity (European Commission, 2013). The green infrastructure consists of (1) ecological corridors (trees, green areas, water courses, bicycle and pedestrian paths), (2) urban areas (boulevards, markets, greed facades and roofs), (3) industrial parks, (4) suburban areas (relaxation and healthy lifestyle, encouraging interaction, events and
agriculture), (5) sustainable drain
systems (ponds, planted canals and wetlands), and (6) coastal areas (Benedict
and McMahon, 2002; Gill et al., 2007;
Tzoulas et al., 2007; ASOP Romania,
2014).
In order to assess long term changes, CORINE data have been used extensively for large scale analyses, with the caveat of questioning the results due to changes in methodology and resolution during the three periods covered (Jansen, 2007;
Pelorosso et al., 2009; Verburg et al., 2011;
Petrişor et al., 2010, 2014). Recently, the
European Union released a new set of data, the Urban Atlas, covering urban areas at a better resolution (Hagenauer and Helbig, 2012).
The aim of this study is to analyze the case study of Bucharest in order to assess its green infrastructure using the two available datasets, CORINE (2006) and Urban Atlas (2005-2007).
2. Data and methods CORINE and Urban Atlas data are provided free of charge by the European Environment Agency in a
shape file format, usable by
of Bucharest (data owned by NIRD URBAN-INCERC).
Since the classification scheme is different for the two data sets, a common classification was generated through a iterative process in two stages: (1) joining classes if one of the datasets provided a more detailed classification scheme, (2) merging similar classes if one of them was not found in one of the data sets. The total area of each class was computed with the X-Tools extension of ArcView 3.X, and classes were ‘exploded’ into separate polygons using the Edit Tools (ET) extension of ArcView 3.X in order to assess their fragmentation.
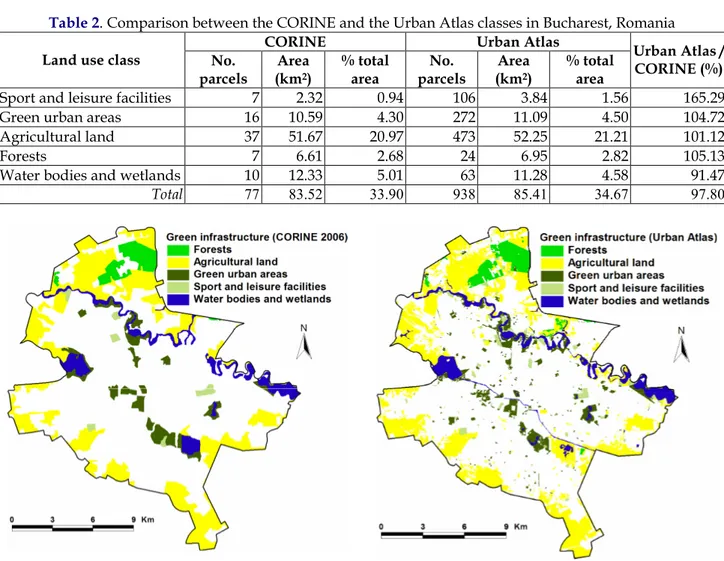
3. Results and discussion The comparison of green infrastructure in Bucharest using CORINE and Urban Atlas data for Bucharest makes sense although the two datasets use different classification schemes, because they cover almost the same period (2006 for CORINE and 2005-2007 for the Urban Atlas). The results are presented in Table 1 and Fig. 1 for the entire city and in Fig. 2 for a sample area. Table 1 has three columns; the first two correspond to CORINE and Urban Atlas classification schemes, and the third column presents a joint classification, used by the next analyses. The table shows that the Urban Atlas provides in-depth description of
urban features (e.g., urban fabric by
density and transportation networks), while CORINE provides an in-depth classification of agricultural features. This could be a shortcoming of the Urban Atlas, especially due to the importance of urban agriculture in European policies
(Deelstra et al, 2001; Buhociu et al., 2013;
Popa and Hărmănescu, 2013).
Table 2 shows the results of applying the joint classification scheme to the two
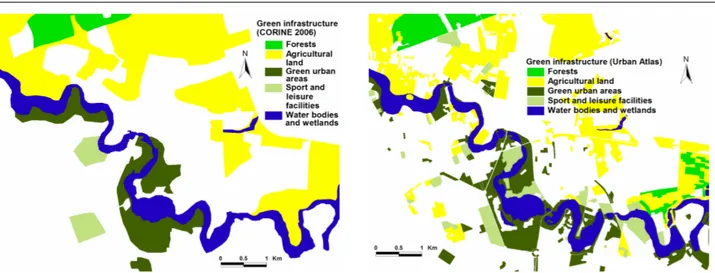
datasets. For each of them the table includes the number of parcels for each class, the total area, and share of the total area from the total area of Bucharest. Surprisingly, the differences occur only among the urban classes, while the totals are very similar. This is visible through the differences between Fig. 1, displaying the green infrastructure of Bucharest, and Fig. 2, analyzing a sample area; while Fig. 1 does not show obvious differences between the two datasets, they are visible in Fig. 2, where small features are lost and large features enlarged. This shows that the Urban Atlas excels in pinpointing the fragmentation of land in urban areas
(Herold et al., 2002; Nagendra et al., 2004;
Irwin and Bockstael, 2007).
4. Conclusions Using the results above, the green infrastructure represents about 1/3 of the
total area, corresponding to 50 m2/person
(49.78 for the Urban Atlas and 50.90 for CORINE), although the green spaces only
account for 6.5 m2/person (6.46 for the
Urban Atlas and 6.61 for CORINE), which is far below the European average
(26 m2/person).
REFERENCES
ASOP Romania (2014), Ecological Infrastructures. Categories, Public space #2. [Eco]logical Infrastructure conference, Timişoara, Romania 19-21 September 2014.
Benedict M. A., McMahon E. T. (2002), Green Infrastructure: Smart Conservation for the 21st Century, Renewable Resources Journal 20(3):12-17.
Breuste J., Qureshi S., Li J. (2013), Scaling down the ecosystem services at local level for urban parks of three megacities, Hercynia N. F. 46:1-20. Buhociu D. H., Rahoveanu A. T., Florescu T. C.,
Crăciun C., Popa A (2013), Rural waterfronts, green areas and natural landscape at the Danube, Journal of Food, Agriculture and Environment 11(3-4): 1692-1696. Deelstra T., Boyd D., van den Biggelaar M. (2001),
promoting urban agriculture in Europe, Urban Agriculture Magazine 4:33-35. European Commission (2013), Building a Green
Infrastructure for Europe, Luxembourg: Publications Office of the European Union, Bruxelles, Belgium, 24 pp.
Gill S. E., Handley J. F., Ennos A. R., Pauleit S. (2007), Adapting Cities for Climate Change: The Role of the Green Infrastructure, Built Environment 33(1):115-133.
Hagenauer J., Helbich M. (2012), Mining urban land-use patterns from volunteered geographic information by means of genetic algorithms and artificial neural networks, International Journal of Geographical Information Science 26(6):963-982.
Ianoş I., Peptenatu D., Zamfir D. (2009), Respect for environment and sustainable development, Carpathian Journal of Earth and Environmental Sciences 4(1): 81-93. Irwin E. G., Bockstael N. E. (2007), The evolution of
urban sprawl: Evidence of spatial heterogeneity and increasing land fragmentation, Proceedings of the National Academy of Science 104(52):20672–20677. Jansen L. J. M. (2007), Harmonization of land use
class sets to facilitate compatibility and comparability of data across space and time, Journal of Land Use Science 1:127-156. Nagendra H., Munroe D. K., Southworth J. (2004),
From pattern to process: landscape fragmentation and the analysis of land use/land cover change, Agriculture, Ecosystems and Environment 101:111-115. Negrei C. C. (1996), Foundations of Environmental Economy, Editura Didactică şi Pedagogică R. A., Bucharest, Romania, 169 pp.
Noblet J.-F. (1994), The nest house. Humans and beasts: how to cohabitate [in French], Terre vivante, Paris, France, 128 pp.
Noblet J.-F. (2005), The nature under your roof. Humans and beasts: how to cohabitate [in French], Delachaux et Niestlé, Paris, France, 173 pp.
Pelorosso R., Della Chiesa S., Tappeiner U., Leone A., Rocchini D. (2011), Stability analysis for defining management strategies in abandoned mountain landscapes of the Mediterranean basin, Landscape and Urban Planning
103:335-346.
Peptenatu D., Pintilii R. D., Draghici C., Stoian D. (2010), Environmental pollution in functionally restructured urban areas: case study - the city of Bucharest, Journal of Environmental Health Science and Engineering 7(1): 87-96.
Petrişor A.-I, Grigorovschi M., Meiţă V., Simion-Melinte C. P. (2014), Long-term environmental changes analysis using CORINE data, Environmental Engineering and Management Journal 13(4):847-860. Petrişor A.-I, Ianoş I., Tălângă C. (2010), Land cover
and use changes focused on the urbanization processes in Romania, Environmental Engineering and Management Journal
9(6):765-771.
Petrişor A.-I. (2008a), Urban ecology, sustainable spatial development and legislation [in Romanian], Fundaţia România de mâine Press, Bucharest, Romania, 272 pp. Petrişor A.-I. (2008b), Levels of biological diversity: a
spatial approach to assessment methods, Romanian Review of Regional Studies
4(1):41-62.
Petrişor A.-I. (2010), Urban environment: an ecological approach, Urbanistique, http://www.urbanistique.ro/mediul- urban-o-abordare-ecologica-dr-alexandru-ionut-petrisor/#more-127
Petrişor A.-I. (2013), Are human settlements ecological systems?, Oltenia. Studii şi comunicări. Ştiinţele Naturii 29(1):227-232.
Petrişor A.-I., Sârbu C. N. (2010), Dynamics of geodiversity and eco-diversity in territorial systems, Journal of Urban and Regional Analysis 2(1):61-70.
Popa A., Hărmănescu M. (2013), European Policy Challenges in the Productive Landscape Economy, in: Sandu A., Caras A. (Eds.), International Scientific Conference Tradition and Reform Social Reconstruction of Europe, November 7-8, 2013 - Bucharest (Romania), Medimond International Proceedings, Bologna, Italy, pp. 277-280
Qureshi S., Breuste J. H. (2010), Prospects of Biodiversity in the Mega-City of Karachi, Pakistan: Potentials, Constraints and Implications, in: Müller N., Werner P., Kelcey J. G. (Eds.), Urban Biodiversity and Design, 1st edition, Blackwell, Chichister, UK, pp. 497-517.
Stan M.-I., Ţenea D., Vintilă D. (2013), Urban regeneration in Protected Areas – Solution for Sustainable Development of Cities in Romania, Analele Universităţii Ovidius Constanţa Seria Construcţii 15: 189-194. Tzoulas K., Korpela K., Venn S., Ylipelkonen V.,
Verburg P. H., Neumann K., Noll L. (2011), Challenges in using land use and land cover data for global change studies, Global Change Biology 17: 974-989.
Watson R., Zakri A. H. (2005), Ecosystems and Human Well-being. Synthesis, Island Press, Washington, DC, US, 137 pp.
Wu J. (2014), Urban ecology and sustainability: The state-of-the-science and future directions, Landscape and Urban Planning 125:209-221.
Zakri A. H., Watson R. (2003), Ecosystems and Human Well-being. A Framework for Assessment, Island Press, Washington, DC, US, 212 pp.
Table 1. Harmonization of the classification schemes used by CORINE and the Urban Atlas
CORINE Urban Atlas Final Class
Sport and leisure facilities Sport and leisure facilities Sport and leisure facilities
Green urban areas Green urban areas Green urban areas
Complex cultivation patterns Agricultural land
Pastures Agricultural land
Fruit trees and berry plantations Agricultural land
Non-irrigated arable land Agricultural land
Land principally occupied by agriculture, with significant areas of natural vegetation
Agricultural + Semi-natural
areas + Wetlands Agricultural land Land without current use Agricultural land
Broad-leaved forest Forests Forests
Water bodies Water bodies Water bodies and wetlands
Inland marshes Water bodies and wetlands
Table 2. Comparison between the CORINE and the Urban Atlas classes in Bucharest, Romania
CORINE Urban Atlas
Land use class No. parcels
Area (km2)
% total area
No. parcels
Area (km2)
% total area
Urban Atlas / CORINE (%)
Sport and leisure facilities 7 2.32 0.94 106 3.84 1.56 165.29
Green urban areas 16 10.59 4.30 272 11.09 4.50 104.72
Agricultural land 37 51.67 20.97 473 52.25 21.21 101.12
Forests 7 6.61 2.68 24 6.95 2.82 105.13
Water bodies and wetlands 10 12.33 5.01 63 11.28 4.58 91.47
Total 77 83.52 33.90 938 85.41 34.67 97.80
Fig. 2. View of the green infrastructure in a sample area from Bucharest, Romania using CORINE (left) and the Urban Atlas (right)
Received: 2 February 2015 • Accepted: 8 February 2015