Converging Work-Talk Patterns in Online
Task-Oriented Communities
Qi Xuan1,2*, Premkumar Devanbu2, Vladimir Filkov2
1Department of Automation, Zhejiang University of Technology, Hangzhou, China,2Department of Computer Science, University of California Davis, Davis, CA, United States of America
Abstract
Much of what we do is accomplished by working collaboratively with others, and a large por-tion of our lives are spent working and talking; the patterns embodied in the alternapor-tion of working and talking can provide much useful insight into task-oriented social behaviors. The available electronic traces of the different kinds of human activities in online communities are an empirical goldmine that can enable the holistic study and understanding of these social systems. Open Source Software (OSS) projects are prototypical examples of collabo-rative, task-oriented communities, depending on volunteers for high-quality work. Here, we use sequence analysis methods to identify the work-talk patterns of software developers in online communities of Open Source Software projects. We find that software developers prefer to persist in same kinds of activities, i.e., a string of work activities followed by a string of talk activities and so forth, rather than switch them frequently; this tendency strengthens with time, suggesting that developers become more efficient, and can work longer with fewer interruptions. This process is accompanied by the formation of community culture: developers’patterns in the same communities get closer with time while different communi-ties get relatively more different. The emergence of community culture is apparently driven by both“talk”and“work”. Finally, we also find that workers with good balance between “work”and“talk”tend to produce just as much work as those that focus strongly on“work”; however, the former appear to be more likely to continue to be active contributors in the communities.
Introduction
A great deal of adult life is spent working. We work to create materials that fulfill human needs, to develop advanced technologies, to govern, heal, and teach each other, etc. Our work is often collaborative, and often involves repeated activities: i.e., we commute, work, collaborate with others, etc. Collaborations involve bothtalkingandworking. We get some work done, talk with our colleagues to socialize, learn, or further co-ordinate tasks, and then work some more. The recurrent practices constitute patterns of activities that can be used to characterize individ-uals, cluster them, and then predict their future behaviors; this has potential applications in
a11111
OPEN ACCESS
Citation:Xuan Q, Devanbu P, Filkov V (2016) Converging Work-Talk Patterns in Online Task-Oriented Communities. PLoS ONE 11(5): e0154324. doi:10.1371/journal.pone.0154324
Editor:Cheng-Yi Xia, Tianjin University of Technology, CHINA
Received:December 28, 2015
Accepted:April 12, 2016
Published:May 3, 2016
Copyright:© 2016 Xuan et al. This is an open access article distributed under the terms of the
Creative Commons Attribution License, which permits unrestricted use, distribution, and reproduction in any medium, provided the original author and source are credited.
Data Availability Statement:All relevant data are available via Figshare (https://dx.doi.org/10.6084/m9. figshare.3181555).
Funding:This work was supported by the National Natural Science Foundation of China (Grant Nos. 61572439, 61273212). The funders had no role in study design, data collection and analysis, decision to publish, or preparation of the manuscript.
various areas including crime control [1,2], traffic forecasting [3,4], and marketing [5,6]. In this paper, we will focus on the two most basic activities, i.e., work and talk. Talking, or com-munication, plays a key role in the coordination between co-operating individuals. As a result, communication traces are commonly used to infer the social networks as the discrete spaces to study the dynamics of many other activities [7–9].
Sequence analysis, which has long history of being useful in molecular biology [10], has been, as of recently, also used in social science [11,12], where researchers investigate life courses [13], and career trajectories [14]. Whereas DNA sequences are curled up in three-dimensional space, social events are arranged according to their time of occurrence. Due to our interest in social phenomena mostly local in time, the positions of social events in a sequence refer to relative, rather than absolute, time points. In bioinformatics, a number of global and local sequence alignment methods are used to compare the molecules’genetic similarity within and across different organisms, so as to elucidate their biological functions [15,16]. Here we adopt a local alignment method to find and enumerate short patterns in work-talk (W-T) sequences of different people in online communities. We use these short W-T pattern counts as data points for modeling human behavior using hidden Markov models (HMMs) [17]. The goodness of fit of these models are established via their ability to predict the numbers of larger patterns in the sequences [15].
In collaborative communities there is interplay between work and talk activities, resulting in meaningful W-T sequence patterns that can be used to characterize different individuals. E.g., the simplest distinguishing W-T pattern for an individual is that they either tend to work contin-uously on the shared product, i.e. the sequence WWWW. . ., or talk continuously to co-ordinate
work with others, and strengthen relationships, i.e. the sequence TTTTT. . .. More complex
pat-terns are a combination of the two. If the W-T patpat-terns are shared between people, then whole communities can also be characterized along those patterns as having a shared“community cul-ture”, in this case a work culture. This connotation of“culture”is consistent with Etzioni’s notion [18]:“the set of assumptions shared by members of a societal unit which sets a context for its view of the world and itself”. It is known that community culture plays an important role in innovation [19], the quality of work-products [20], and can facilitate the decision-making [21]. Recent studies on collaboration reveal that community size, team assembling mechanisms, and team structure have significant effects on team performance [22–24]. Thus, quantitatively characterizing the community culture is of much interest and provides novel insights for collab-oration especially when it can be related to individual productivity and work efficiency.
To quantitatively study the emergence of work culture in online task-oriented groups we built an analytic framework for analysis of patterns jointly emerging along two basic collabora-tive dimensions, work and talk. Particularly, different from the previous studies mostly relied on talk activities to generate social networks [7–9], here we treat both activities equally as events sequenced over time, and use sequence analysis methods and stochastic models to reveal and contrast W-T patterns of individuals in online task-oriented communities. Here, we use OSS communities, where abundant data is publicly available [25–27], to study the W-T pat-terns of software developers for three main reasons. First, the work in OSS communities is easy to observe, and most of the talk activities are meaningfully related (because of community norms) to work activities; this simplifies the observation of functional W-T patterns. Second, the work and talk activities in OSS communities are always archived [28], so they are readily collected for analysis. Finally, performance properties, such as productivity, in terms of number of lines of code (LoC) written, can also be measured using the state of the produced software.
Foundation OSS projects. By characterizing each developer using their corresponding HMM parameters, we find evidence for community culture in OSS projects: developers in the same community tend to have more similar W-T patterns than those from different ones, and this pattern-affinity strengthens with time. We also observed that developers who have balanced W-T patterns are just as productive as those who work more continuously (fewer“talk” inter-ruptions), but the former tend to stay active longer; this suggests that W-T balance is important to sustain OSS communities. Moreover, we create social and cooperation networks, and find that the convergence of W-T patterns between a given pair of developers appears to be re-enforced by both talk- and work-related interactions. This indicates that the emergence of a community W-T culture is apparently driven by both“work”and“talk”activities, and may offer a novel perspective on the co-evolving mechanisms of socio-technical, interdependent networks [29–31].
Materials and Methods
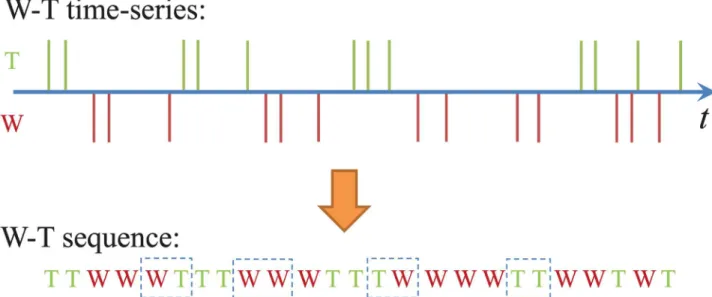
We follow the definitions ofworkandtalkin software engineering [28] and collected these activities from 31 OSS communities in theApache Software Foundationon March 24th, 2012. In each community, there are several volunteer developers who contribute by committing to files, i.e., adding or removing software code; these activities are recorded in a Git repository and are our“work events”, or“W”s. OSS developers usedeveloper mailing liststo share pro-gramming knowledge and coordinate with others in the project. We record sent emails of a developer as“talk events”, or“T”s (the received emails are included in the talk activities of oth-ers). Using this data, a W-T sequence of work and talk activities, as shown inFig 1, can be recorded for each developer. Note that messages may be automatically posted to a mailing list in an OSS community to inform others when some work is completed. We exclude such trivial talk activities and only consider response emails [32,33] which make up about 73% of all mes-sages. We also use a semi-automatic approach to solve the problem of multiple aliases [32].
We pre-process the W-T sequence data in several ways. To ensure a sufficient number of samples to reliably compare the W-T patterns between pairs of developers in the same or from
Fig 1. A multiple time-series of work and talk activities and the corresponding W-T sequence.The four different two-patterns, i.e., WW, WT, TW, and TT, are marked by the dashed rectangles.
different communities, we select a subset of“top developers”with sequences including at least 500 work and talk activities, and a subset of communities with at least 5 such developers. We acknowledge a risk of left-censorship of both work & talk activities, if any OSS communities did not archive their emails, or if they had used different version control systems before they moved to Git, some early data could be lost. Besides, it is known that many individuals need to first earn social capital in the OSS community by communicating with others before they are accepted as developers [34,35]. As a result, we often observe long, pure work (resp. talk) subse-quences before the first talk (resp. work) activity of a developer. In this study, we remove these trivial prefixes of pure work or talk activities, i.e., we only consider W-T sequences starting from the first work (resp. talk) activity if it occurred after a talk (resp. work) activity.
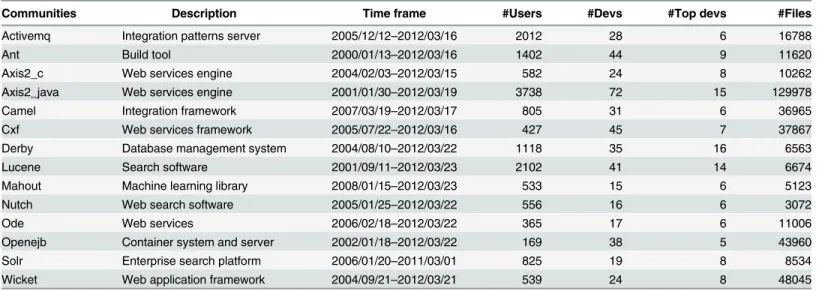
The above pre-processing of the data yielded 14 communities with 120“top developers”. The full data is available at:https://dx.doi.org/10.6084/m9.figshare.3181555. Some basic prop-erties of those OSS projects are shown inTable 1. Besides developers, there we also list the number of active users (including developers) in each community. These users might not directly change files, but they may contribute to the communities by other ways, such as report bugs etc.
Finding Surprising Sequence Patterns
AG-pattern in a sequence over the alphabet {W, T} is a subsequence of lengthG. There are total 2Gpossible differentG-patterns. Typically, the length of a pattern is much shorter than
the length of the given sequence. In our study we focus on 2-patterns and 3-patterns. Given a sequenceθ= {s1,s2,. . .,sh} over {W, T}, we count the occurrence of each of the 2Gpatterns, by
rolling a window of sizeGover the sequence, and incrementing the count for the pattern we find. For instance, in the W-T sequence shown inFig 1, the four possible 2-patterns, WW, WT, TW, and TT, occur eight, five, five, and six times, respectively.
To assess the probability that a pattern occurs by chance, we create a null (baseline) model by randomizing the observed W-T sequence so as to preserve the proportion of work to talk activities. This can be achieved, e.g., by using the R’s [36] sample() function on the sequence indexes. Then, the preference for patternPin the observed sequence,θ, over the randomized sequence,θ, is calculated by the relative difference between the counts for that pattern,C
Pand
Table 1. Basic properties of the fourteen OSS communities.
Communities Description Time frame #Users #Devs #Top devs #Files
Activemq Integration patterns server 2005/12/12–2012/03/16 2012 28 6 16788
Ant Build tool 2000/01/13–2012/03/16 1402 44 9 11620
Axis2_c Web services engine 2004/02/03–2012/03/15 582 24 8 10262
Axis2_java Web services engine 2001/01/30–2012/03/19 3738 72 15 129978
Camel Integration framework 2007/03/19–2012/03/17 805 31 6 36965
Cxf Web services framework 2005/07/22–2012/03/16 427 45 7 37867
Derby Database management system 2004/08/10–2012/03/22 1118 35 16 6563
Lucene Search software 2001/09/11–2012/03/23 2102 41 14 6674
Mahout Machine learning library 2008/01/15–2012/03/23 533 15 6 5123
Nutch Web search software 2005/01/25–2012/03/22 556 16 6 3072
Ode Web services 2006/02/18–2012/03/22 365 17 6 11006
Openejb Container system and server 2002/01/18–2012/03/22 169 38 5 43960
Solr Enterprise search platform 2006/01/20–2011/03/01 825 19 8 8534
Wicket Web application framework 2004/09/21–2012/03/21 539 24 8 48045
C
P, in the respective sequences,
lP¼CP hC
Pi
hC
Pi
100%: ð1Þ
ForhC
Pi, we generated 100 randomized sequences for each observed one. For each patternP
in a sequence, we also calculate itsZ-score [37] asZ¼lPhC
Pi=B, whereBis the standard
devia-tion of the pattern counts inθ. Larger |Z| values indicate more surprising observed counts.
Hidden Markov Model
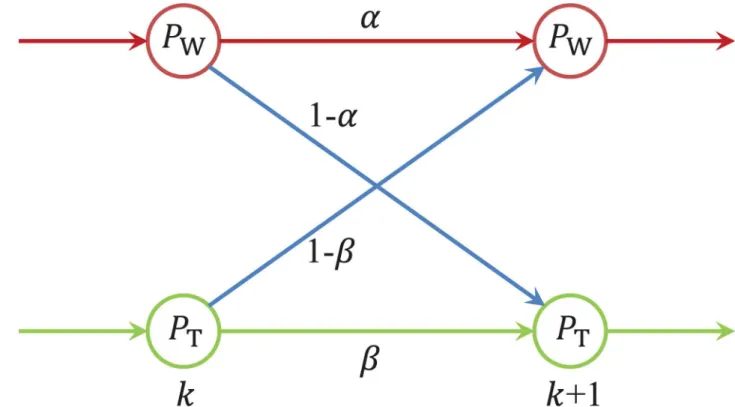
A Hidden Markov Model, HMM, is a simple stochastic model used to abstract behavior involv-ing several different states and transitions among them. To model developers and their work-talk behavior, we use an HMM with two states,“work”,“W”, and“talk”,“T”, and transitions between them corresponding to either continuing to perform the same activity, W followed by a W or T followed by a T, or switching activities, W followed by a T, and vice versa. The param-etersαandβ, representing the conditional transition probabilitiesP(W|W) andP(T|T), respec-tively. The HMM diagram is shown inFig 2.
If we denote byPW(k) andPT(k) the probabilities that work, resp. talk, happen at time step
k, then for the next time point we have
PWðkþ1Þ ¼aPWðkÞ þ ð1 bÞPTðkÞ; ð2Þ
PTðkþ1Þ ¼ ð1 aÞPWðkÞ þbPTðkÞ; ð3Þ
whereαandβare the transition probabilities. We note here that whileαandβcould evolve with
Fig 2. An HMM with two states, i.e.,“work”and“talk”, denoted by“W”and“T”, respectively.The model is used to explain the W-T patterns of developers in different communities.
time, they don’t change much between successive activities, therefore we can consider them as constants in the sequences with certain lengths. Thus, Eqs (2) and (3) can be approximated for continuous time,τ, and then transformed to the following more compact matrix form:
_ PðtÞ ¼
a 1 1 b
1 a b 1
" #
PðtÞ; ð4Þ
withP(τ) = [PW(τ),PT(τ)]T. By solvingEq (4), we have
PðtÞ ¼D1
1 b
1 a
" #
þD2
1
1
" #
eðaþb 2Þt; ð5Þ
whereD1andD2are some constants. The fractions of work and talk activities,PWandPT, in a sequence with lengthLcan be estimated by
PW PT " # ¼ 1 L Z L 0
PðtÞdt: ð6Þ
By substitutingEq (5)intoEq (6), we have
PW
PT
" #
¼ D1
ð2 a bÞL 1
1
" #
1 eðaþb 2ÞL
þ D2
1 b
1 a
" #
:
ð7Þ
In the right side ofEq (7), the first term is negligible when the sequence is long enough, con-sideringα+β<2. Since it is always satisfiedPW+PT= 1, we have
PW¼
1 b
2 a b; PT¼ 1 a
2 a b; ð8Þ
which are fully determined by the two parameters in the model. Then, the probabilities for the four different two-patterns in the sequence, in terms ofαandβ, are given by:
PWW¼aPW¼
að1 bÞ
2 a b; ð9Þ
PWT¼ ð1 aÞPW¼
ð1 aÞð1 bÞ
2 a b ; ð10Þ
PTW¼ ð1 bÞPT¼
ð1 aÞð1 bÞ
2 a b ; ð11Þ
PTT¼bPT¼
ð1 aÞb
2 a b; ð12Þ
independent from the previous state, thus we haveα= 1−β, i.e.,α+β= 1. In this case,αandβ are equal to the fractions of work and talk activities, respectively.
Based on the above model, we have the following solutions for the parameters:
a¼ PWW
PWWþPWT
; b¼ PTT
PTTþPTW
; ð13Þ
wherePWW,PWT,PTW, andPTTdenote the probabilities of the four different two-patterns for each developer, and can be estimated from the counts of the four different two-patterns as long as the corresponding W-T sequence is sufficiently long. Thus, this HMM is fully determined by the numbers of the four different two-patterns.
Hazard Modeling
To study the tenure, or survival time, of developers in the projects (time from joining until leav-ing) in terms of the HMM parametersαandβ, we use survival analysis, which enables modeling of outcomes in the presence of censored data. In our case the censoring is due to the uncertainty that long time periods without activities may or may not indicate that a developer has left the community. Generally, survival analysis involves calculating the Hazard rate [38], defined as the limit of the number of events perδttime divided by the number at risk, asδt!0. Supposing a developer does not leave the community until timeΓ, the Hazard rate is given by
hðtÞ ¼ lim
dt!0
PðtG<tþdtjtGÞ
dt : ð14Þ
Our primary interest is the survival function defined asS(t) =P(t<Γ), which can be calculated fromEq (14)by
SðtÞ ¼e
Rt
0hðtÞdt: ð15Þ
Supposeαorβcan influence the survival time, then we adopt the Cox model [39] to define the Hazard rateh(t) by
hðtÞ ¼h0ðtÞebx; ð16Þ
withh0(t) describing how the hazard changes over time at baseline level of covariatex, eitherα
orβ. Here we focus on the hazard ratioh(t)/h0(t) to see whether increasing the covariate will sig-nificantly increase or decrease the survival time, e.g.,b>0 means that the individuals of largerx
will have statistically shorter survival times.
Results
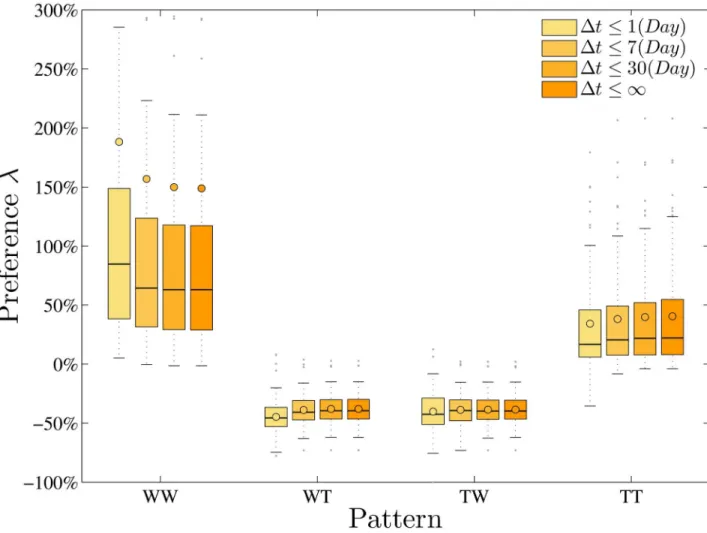
We begin by studying two-pattern preference in developer’s behavior. Given an observed W-T sequence for each person, we count in it the occurrences of all four two-patterns, and derive the preference for each, denoted byλi,i= 1, 2, 3, 4, respectively, in the real sequences as compared to random ones as described above. We find that, on average, for all developers,λ1= 148.9%
andλ4= 40.5%, whileλ2=−38.0% andλ3=−38.6%, i.e., WW and TT are positively enriched, while WT and TW are negatively enriched. We find that |Z|>5 in 462 out of 480 cases (120 developers times 4 two-patterns), indicating that most of the observed counts are surprising. These suggest that developers much prefer to persist with one activity-type, rather than switch frequently between activities.
method is robust with respect to time-scale, we also calculate the relative difference by varying the thresholds for the time-intervals over which we consider the two-patterns. We vary the thresholds, denoted byξ= 1, 7, 30 (days), and only the patterns with intervalsξare consid-ered. The results are shown inFig 3, where we can see that WW and TT patterns are always much more preferred than WT and TW patterns in the real sequences under thresholds vary-ing from one day to one month. Interestvary-ingly, we also find a slight trend that the WW pattern becomes more preferred, and the TT pattern less preferred, when we exclude more repeated activities with relatively shorter time intervals (and thus a smallerξ). Since the number of these long time-interval patterns is relatively small (2.2% and 0.3% forξ= 7 andξ= 30, respectively), this slight trend still indicates that developers are more likely to start and end a repeated and relatively compressed work sequence with talk activities, viz., talk activities plays important role in enabling new tasks (work activities) in these online communities.
Emergence of Community Culture
We use HMMs, described above, as two parameter,αandβ, models of software developers’ work-talk behavioral patterns. To validate the use of HMMs, we check their efficacy in predict-ing the counts of longer patterns, e.g., three-patterns. We find that the HMMs do predict the
Fig 3. The box-and-whisker diagram for the preferences of the four different two-patterns in the real W-T sequences under the different time-interval conditions by comparing with the random ones.
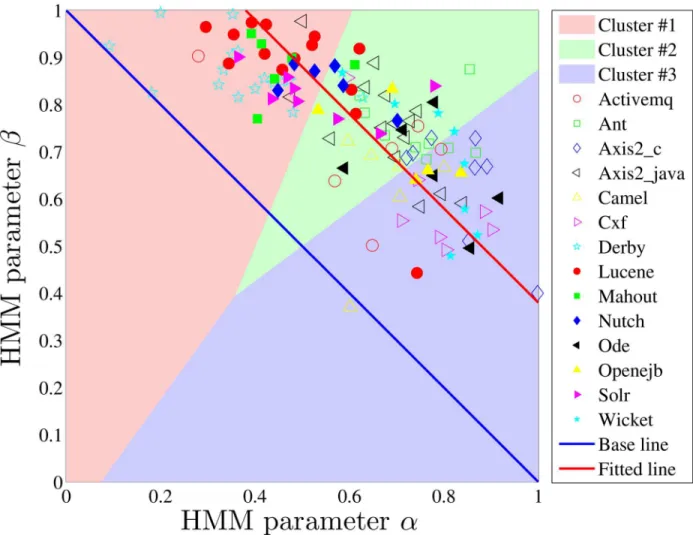
numbers of all the eight three-patterns with significantly smaller relative errors (p= 1.8 × 10⁻¹⁶ on average) than the random mechanism for the developers we studied, i.e., 14.5% versus 67.4% on average. We characterize each developer with the parametersαandβcoming out of the HMM fitted to their W-T sequence. Thoseαandβcan, then, be compared across develop-ers and communities. To study the work-talk behavior of developdevelop-ers within and between com-munities, we first visualize all (α,β) pairs in theα−βplane, as shown inFig 4, where the developers of the same communities are marked by the same symbols. Evidence of clustering is visually apparent: the points representing the developers in the same communities are indeed closer to each other when compared with those from different communities. We further divided all the developers into three groups by the k-means method [40], and find that most developers in the same communities are centralized in one of three clusters, rather than uni-formly distributed in all the three, which indicates different community cultures that empha-size continuous work (cluster #3), talk (cluster #1), or both (cluster #2), respectively. Here, we also provide the baseline formed by the HMM parameters of the W-T sequences that are gener-ated by the random mechanism with different fractions of work activities. Since this baseline
Fig 4. Visualization of developers onα-βplane by considering their whole sequences, where developers are points and those of the same communities are marked by the same symbols.The parameters are grouped into three clusters by the“K-means” method. The base line is formed by the HMM parameters of the random W-T sequences with different fractions of work activities. The points are fitted by the linear functionα+β=ε, withε= 1.38.
must satisfyα+β= 1, and almost all the points being above this based line validates again the preferred patterns WW and TT in all communities.
More specifically, most developers (50%) inDerby,Lucene,Mahout,Nutch, andSolr
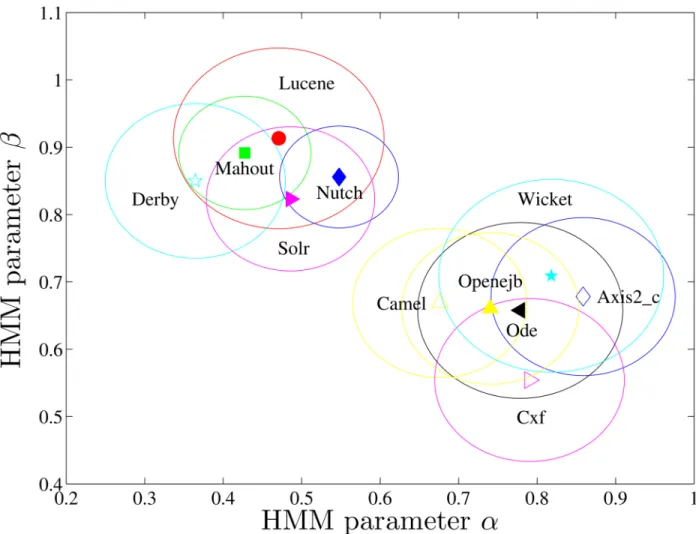
belong to cluster #1, which corresponds to mostly talk activities (highβ), while most of the developers inAxis2_c,Camel,Cxf,Ode,Openejb, andWicketbelong to cluster #3, correspond-ing to mostly work activities (highα). As a whole, we define the center of a community inα−β plane by the median of the HMM parameters of the developers in it, then calculate its diversity by the average distances of HMM parameters between the developers and the center, as shown inFig 5for the above 11 communities. It is interesting to find that the communities sharing similar W-T patterns also belong to similar domains (description inTable 1). For example,
Lucene,Nutch, andSolrare all about“search”and they are intrinsically related to each other, just like the introduction ofNutchon its web site:“Stemming from ApacheLucene, Apache
Nutchnow builds on ApacheSolradding web-specifics”. Besides,Axis2_c,Cxf, andOdeare all about“services”, while each ofCamel,Cxf, andWicketis a software framework that provides a shared architecture for class of applications.
Fig 5. The centers and the respective diversities (the large circles) of the eleven communities onα−βplane, defined as the
medians of the HMM parameters of their developers and the average distances of HMM parameters between the developers and the corresponding centers, respectively.
More formally, if we denote byαiandβithe HMM parameters of developerdi, we can
calcu-late the Euclidean distance of HMM parameters between two developersdianddjby
rij¼qffiffiffiffiffiffiffiffiffiffiffiffiffiffiffiffiffiffiffiffiffiffiffiffiffiffiffiffiffiffiffiffiffiffiffiffiffiffiffiffiffiffiffiðai ajÞ2þ ðbi bjÞ2; ð17Þ
as a quantitative metric for the similarity between the W-T patterns of developers, i.e., the shorter the distance between them, the more similar the W-T patterns of the two developers. Then, we compare the distances of HMM parameters between all pairs of developers in the same communities with those between pairs of developers from different communities, and
find that the former list of distances are significantly shorter (p= 0) than the later ones. These qualitative and quantitative analysis lend support to using the HMM parameters as a reason-able proxy for the way the interplay of work and talk testify to community culture.
To study the clustering phenomenon of W-T patterns in more detail so as to answer whether developers choose to join communities with similar W-T patterns as theirs or the sim-ilarity emerges over time as developers participate and evolve with their communities, we do the same pattern analysis as above, using only the initial 100 activities in the W-T sequences. Based on the comparison, we find that:
1. The developers in the same community showed similar W-T patterns starting with their inception into the project. I.e., for their first 100 activities, the distances of HMM parameters between pairs of developers in the same communities are significantly shorter (p= 3.1e-13) than those from different communities.
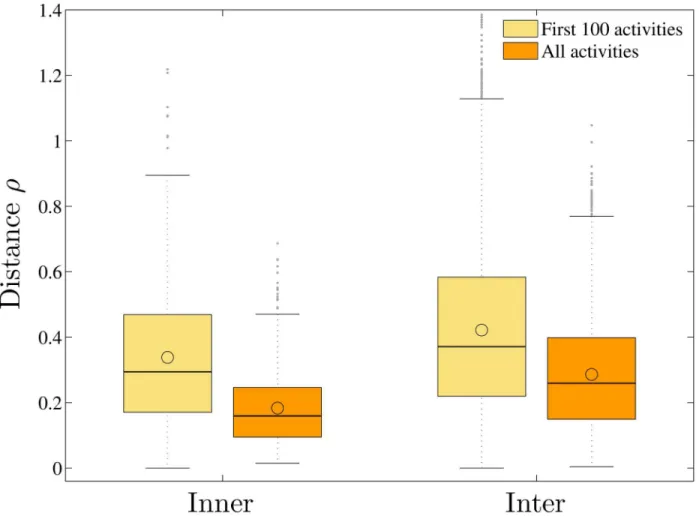
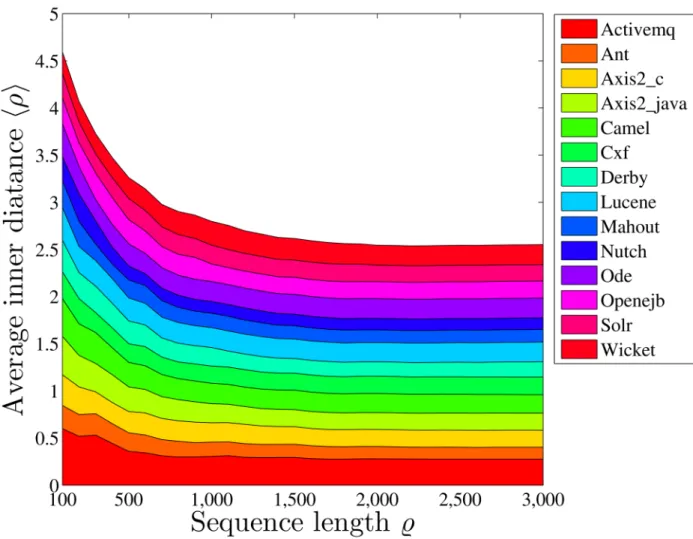
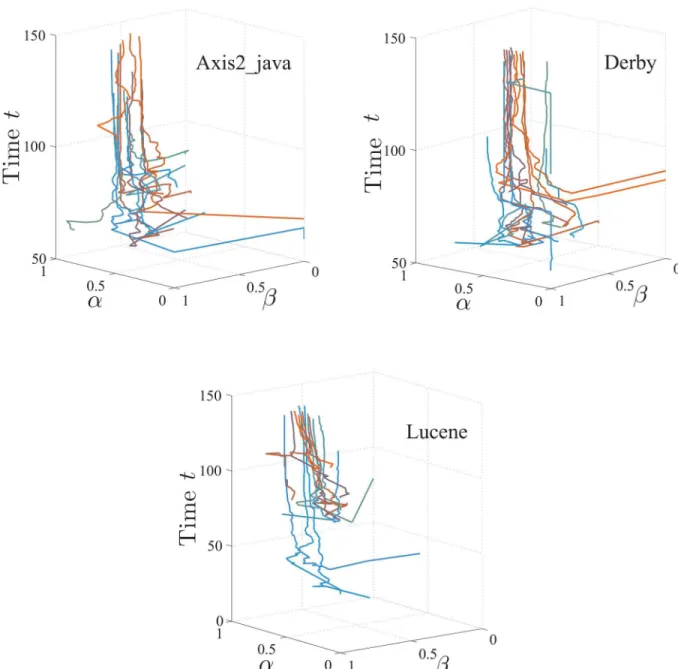
2. In addition, the community cultures of different communities converge rather than diverge from each other, as time evolves. I.e., both the inner (within-community) and inter (between-community) distances decrease significantly (p= 0) with time, as shown inFig 6. We also calculate the average inner distance for all communities by considering their respec-tive first%activities with different values of%, as shown inFig 7, to study the converging pro-cess. We find that the inner distances decrease as%increases, for most communities. As examples, the evolutions of the HMM parameters with time for the communitiesAxis2_java,
Derby, andLuceneare shown inFig 8.
3. The clustering of the HMM parameters within communities grows tighter with time. I.e., the convergence rates of the parameter distances from the first 100 activities to all activities within communities (the average distance decreases from 0.3381 to 0.1832) is significantly larger (p= 1.7e-7) than those between communities (it decreases from 0.4216 to 0.2861).
These findings suggest that developers with similar W-T patterns are indeed more likely to join in the same communities, and continue to harmonize their patterns as they work and talk as a team. In fact, since there are many online communities on similar topics, people can first experience the culture of these communities and then decide to join or not [41–43]. For OSS, it is clear that most developers do communicate a fair bit on the developer mailing list before actually contributing work [34,44]; indeed, this type of“socialization”is a necessary pre-requi-site to having one’s work contributions accepted. Thus, it is to be expected that the developers are more likely to join in the communities with harmonized work and talk patterns, in order to reduce co-ordination efforts.
activities andb)all activities. We find that both of them increase as time evolves, i.e., the HMMs in casea)have significantly smallerα(p= 0.027) andβ(p= 1.4e-5) than those inb). In fact, the efficiency of overall work and talk activities may be measured by the sumα+β; larger values of this sum indicate less switching between activities and thus fewer interruptions. This arguably represents higher efficiency [45–47]. In other words, the HMM parameters (αi,βi) shown inFig 4can be fitted by the linear function:
aþb¼ε; ð18Þ
with a single parameterεrepresenting the average efficiency of all the developers. Using the least squares method, we get the average efficiencyεand the corresponding standard deviation
σfrom the regression line as
ε¼S
N
i¼1ðaiþbiÞ
N ; s¼
ffiffiffiffiffiffiffiffiffiffiffiffiffiffiffiffiffiffiffiffiffiffiffiffiffiffiffiffiffiffiffiffiffiffiffi
SNi¼1ðaiþbi εÞ 2
2N
s
; ð19Þ
respectively, for theNdevelopers. Wefind that the average efficiency steadily increases, while the variance decreases, with time, which means that as time goes on developers tend to have
Fig 6. The box-and-whisker diagrams for the distances of the HMM parameters of the first 100 activities and those of the whole W-T sequences between pairs of developers inner and inter communities.
longer bursts of pure work and pure talk, suggesting that their discussions are becoming more effective, and that the ensuing co-operative work proceeds relatively more uninterruptedly.
Looking at the change in the rate of talk activities for all developers, in terms ofαandβ,Eq (8), we find that the rate increases significantly (p= 0.0046) with time, indicating that most developers become more socialized in the process. This phenomenon is consistent with the fact that more discussions are always needed to further improve a mature product. Meanwhile, contributing to these online communities is social work, i.e., the contributions of developers are highly visible and will be checked by many other users [33], so it is not surprising that they need to reply to comments more frequently when contributing more.
Community Culture and Individual Performance
We then study the correlations with community culture of five measures of individual perfor-mancework rhythm(# work activities per day),thousands of lines of code added per unit time
(KLoC per day),talk rhythm(# talk activities per day),newly established social links per week, andobserved survival time(# year), resp.,X1toX5. The first four properties are calculated in the same time period of the person’s W-T sequence. Thesurvival time,X5, of a developer is defined as the period of time from her first activity to the last one, which may be longer than
Fig 7. The average inner distances of HMM parameters between pairwise developers for the fourteen communities.
the period of their W-T sequence, considering that the W-T sequences under study were pre-processed by removing prefixes of pure work or talk activities. The survival time of a developer is only observed when the developer has left the respective community. Here, as a reasonable estimation, we consider that a developer has left the community if they have not been active for a relatively long time, i.e., longer than some thresholdT.
All developers are divided into three clusters by their HMM parameters, as shown inFig 4. The developers in Cluster #1 emphasize“talk”, those in Cluster #3 emphasize“work”, while those in Cluster #2 seek balance between the two. For each property fromX1toX4, we have a list of their values for developers in each cluster, and the comparisons between the properties of developers in different clusters are visualized by the box-and-whisker diagrams shown in Fig 9(A), with the significance presented inTable 2. We find that the developers in Cluster #3
Fig 8. Developers’α&βmonthly evolving curves, e.g.,Axis2_java,Derby, andLucene.
have the fastest working rhythms, those in Cluster #2 follow, while the developers in Cluster #1 work the slowest. The direction reverses for their talking rhythms. However, the situation is a little different when we compare the abilities of developers of different clusters in producing codes and earning social status. We find that the developers in Cluster #2 and Cluster #3 can produce similar KLoC per day, and both groups produce significantly more than the develop-ers in Cluster #1, while the developdevelop-ers in Cluster #2 and Cluster #1 earn similar numbdevelop-ers of social links per week, and both groups earn significantly more than the developers in Cluster #3. Interestingly, balanced, and W-heavy W-T patterns are likelier among ASF members: the fractions of ASF members in Clusters #2 and #3 are 55.6% and 55.9%, respectively, while in Cluster #1 it is 46.3%. These indicate that extended discussion is always accompanied with the slowing down of work rhythms, but not always with decrease of productivity, and the develop-ers seeking balance between work and talk behave competitively on both productivity and socialization as those who mostly work or mostly talk.
Although it seems that the developers who mostly work have the fastest working rhythms and the highest productivity, on average, it doesn’t mean that choice is the healthiest for them or for the overall community, since these developers are more likely to feel boring and then quit the communities. Based on the Hazard model to consider the censoring data, we find that developers with smallerαor largerβwill have suggestively longer survival times (p= 0.077 and
b= 1.7 forαandp= 0.042 andb=−2.4 forβ), indicating that, by comparison, talk activities
Fig 9. The effects of community culture on individual properties.The box-and-whisker diagrams for (A) the four individual propertiesX1
toX4, and (B) the observed survival timeX5with different time thresholdsT1(half year),T2(one year), andT3(two years), for the developers
in the three clusters determined by their HMM parameters.
doi:10.1371/journal.pone.0154324.g009
Table 2. The student’s t-tests for five individual properties between different clusters.Here,pijdenotes the significance of difference between the developers in Cluster #iand Cluster #j.
Property Mean value Significance
#1 #2 #3 p12 p23 p13
X1 0.2173 0.4524 0.8664 0.0189 0.0054 1.23e-07
X2 0.2099 0.7955 0.7930 0.0142 0.9939 0.0146
X3 1.0696 0.6503 0.3878 0.0119 0.0576 6.63e-06
X4 0.8988 0.8814 0.5626 0.9035 0.0365 0.0020
X5 3.7974 4.6988 3.0243 0.3016 0.0368 0.2692
are more important than work activities for developer retention. Indeed, we find that develop-ers with more balance between their work and talk stay active in the communities for sugges-tively longer periods of time than those who mostly work, as shown inFig 9(B), i.e., the significance is equal to 0.037, 0.078, and 0.049 when the survival times of the developers with their last activities occurred half year, one year, and two years before are considered, respec-tively. The significance of comparison for the survival time among the three clusters of devel-opers are presented inTable 2whenT= 0.5 (year). These findings suggest that developers with balanced W-T patterns are important to sustain OSS communities. Each of the communities we studied has at least one balanced developer, and there is also a natural trend that developers become more balanced, i.e., bothαandβincrease with time.
Role of Socio-Technical Links
Here, we study the extent to which developers with similar W-T patterns tend to be linked more in the email social network or the technical cooperation network. In social networks, social weight between two developers intuitively means the number of emails between them. In cooperation networks, a pair of developers are linked with an edge indicating the number of files on which they have both worked. In particular, denoting byψithe list of files that
devel-operdicommits to, the cooperative weight between a pair of developersdianddj, in terms of
the files to which they have committed, is defined as
oij¼ci\cj
ci[cj: ð20Þ
On the social side, for pairs of developers, we getSpearmancorrelations (Pearson correla-tions yield very similar results) between the distances of HMM parameters and the number of emails they have exchanged, shown inTable 3, in the Social weight columns. We find negative correlation in ten out of fourteen projects, with the significancep<0.1 in six of them, includ-ingAxis2_c,Camel,Derby,Lucene,Ode, andSolr, while we find positive correlation with the significancep<0.1 in only one project calledMahout. The negative correlation means that the
Table 3. Spearman correlation of HMM parameters and social & cooperative weights for developer pairs in different projects.
Project Social weight Cooperative weight
Correlation Significance Correlation Significance
Activemq –0.3056 0.2680 –0.5607 0.0323
Ant 0.0049 0.9774 –0.3704 0.0268
Axis2_c –0.4667 0.0123 0.2474 0.2036
Axis2_java –0.0442 0.6547 –0.1714 0.0805
Camel –0.6000 0.0204 –0.3679 0.1779
Cxf 0.0651 0.7793 0.1948 0.3957
Derby –0.1940 0.0337 –0.3232 3.41e-04
Lucene –0.6046 2.20e-10 –0.2275 0.0303
Mahout 0.6685 0.0064 –0.3429 0.2110
Nutch –0.2832 0.3065 0.4071 0.1333
Ode –0.4866 0.0659 –0.1429 0.6114
Openejb 0.0667 0.8648 –0.3818 0.2790
Solr –0.5083 0.0058 –0.5457 0.0031
Wicket –0.1363 0.4876 –0.1795 0.3591
All –0.2517 2.81e-09 –0.2037 1.84e-06
smaller the HMM parameter distance between two developers, the larger the number of emails they have exchanged.
On the technical end, we study theSpearmancorrelation between the distances of HMM parameters and the strength of file cooperation links between developers. We get the results in Table 3, under the Cooperative weight columns. In this case negative correlation is found in eleven out of fourteen projects, with the significancep<0.1 in six of them, includingActivemq,
Ant,Axis2_java,Derby,Lucene, andSolr, while no project has positive correlation with signifi-cancep<0.1. The negative correlation means that the smaller the HMM parameter distance between two developers, the larger the cooperation between them.
When considering all communities together, we obtain a significantly negative correlation in both cases (the last row ofTable 3). Thus, developers with more emails between them or committing to more of the same files are more likely to have similar W-T patterns. The results also indicate that community culture may be either social or task (technical) oriented; the dis-tances between HMM parameters are more likely to be correlated with social weights in some communities, and with cooperative weights in others. Note that such findings are reasonable, considering that developers who commit more to popular files or who communicate more are likelier to coordinate more with each other [48], which may require higher-level convergence between their W-T patterns.
Discussion
In this paper, we demonstrate that work-talk patterns of software developers in a number of OSS communities can be effectively studied using sequence analysis methods on sequences arising from simple two-state behavior models of work and talk activities.
Our methods enabled us to learn about a series of interesting task-oriented community based phenomena: that developers in a community present similar W-T patterns, and this clus-tering of W-T patterns is enhanced with time, reflecting different work cultures in these com-munities, with emphasis on different proportions of continuous work to continuous talk activities; that social and technical interactions may play a role in synchronizing W-T patterns, since developers with stronger social or technical links in a community have more similar W-T patterns; and that although successful task-communities may have relatively different cultures, developers with balanced work-talk patterns seems to play critical roles in sustaining them, and, at least in the ones we studied, each has at least one such developer. These findings suggest that online individuals may synchronize their behaviors with others to better fit in the task communities and to improve coordinating efficiencies. We acknowledge that the talk activities we discussed here are meaningfully related to work activities, and thus can be considered also as being work activities, in a more general sense. But commits and email communications are still different kinds of activities [28,33,49] and thus it’s reasonable to use HMM to describe the switching patterns between them. Moreover, it is because talk and work are related that the functional W-T patterns are meaningful.
derive more comprehensive results. To address this, we collected issue tracking data from Jira and Bugzilla [35], and arguably experimented with including them as talk activities (both open-ing issue as initializopen-ing the discussion and comments). Our result did not change significantly, indicating the revealed phenomena are quite robust. We use lines of code, LoC, to measure the productivity of a developer since it has been used extensively [27,49,53]. This, while appropri-ate, is not the only such measure. Alternative metrics include the number of issues fixed [57], the development time of tasks [58], and the number of bugs [59]. Using them may offer addi-tional insight into the benefits of balanced W-T patterns.
Acknowledgments
The authors would like to thank all the members in the DECAL Lab in the Department of Computer Science, University of California in Davis, for the valuable discussion about the ideas and technical details presented in this paper. QX acknowledges support from the National Natural Science Foundation of China (Grant Nos. 61572439, 61273212).
Author Contributions
Conceived and designed the experiments: QX PD VF. Performed the experiments: QX. Ana-lyzed the data: QX. Wrote the paper: QX PD VF.
References
1. Koerin B. Violent crime: Prediction and control. Crime & Delinquency. 1978; 24:49–58. doi:10.1177/ 001112877802400105
2. Eck J, Chainey S, Cameron J, Leitner M, Wilson R. Mapping Crime: Understanding Hot Spots. Wash-ington: National Institute of Justice; 2005.
3. Kitamura R, Chen C, Pendyala RM, Narayaran R. Micro-simulation of daily activity-travelpatterns fortra-veldemandforecasting. Transportation. 2000; 27:25–51. doi:10.1023/A:1005259324588
4. González MC, Hidalgo CA, Barabási AL. Understanding individual human mobility patterns. Nature. 2008; 453:779–782. doi:10.1038/nature06958PMID:18528393
5. Bhatnagar A, Misra S, Rao HR. On risk, convenience, and Internet shopping behavior. Communica-tions of the ACM. 2000; 43:98–105. doi:10.1145/353360.353371
6. Bodapati AV. Recommendation systems with purchase data. Journal of Marketing Research. 2008; 45:77–93. doi:10.1509/jmkr.45.1.77
7. Eagle N, Macy M, Claxton R. Network diversity and economic development. Science. 2010; 328:1029– 1031. doi:10.1126/science.1186605PMID:20489022
8. Onnela JP, Saramäki J, Hyvönen J, Szabó G, Lazer D, Kaski K, et al. Structure and tie strengths in mobile communication networks. Proceedings of the Natlional Academy of Sciences USA. 2007; 104:7332–7336. doi:10.1073/pnas.0610245104
9. Newman MEJ, Forrest S, Balthrop J. Email networks and the spread of computer viruses. Physical Review E. 2002; 66:035101. doi:10.1103/PhysRevE.66.035101
10. Watson JD, Crick FHC. The structure of DNA. Cold Spring Harbor Symposia on Quantitative Biology. 1953; 18:123–131. doi:10.1101/SQB.1953.018.01.020PMID:13168976
11. Abbott A. Sequence analysis: New methods for old ideas. Annual Review of Sociology. 1995; 21:93– 113. Available:http://www.jstor.org/stable/2083405doi:10.1146/annurev.so.21.080195.000521
12. Brzinsky-Fay C, Kohler U. Sequence analysis with Stata. The Stata Journal. 2006; 6:435–460. Avail-able:http://www.stata-journal.com/article.html?article=st0111
13. Aisenbrey S, Fasang AE. New life for old ideas: The“second wave”of sequence analysis bringing the “course”back into the life course. Sociological Methods & Research. 2010; 38:420462.
14. Abbott A, Hrycak A. Measuring resemblance in sequence data: An optimal matching analysis of musi-cians’careers. American Journal of Sociology. 1990; 96:144–185. Available:http://www.jstor.org/ stable/2780695doi:10.1086/229495
16. Rosenberg MS. Sequence Alignment: Methods, Models, Concepts, and Strategies. Berkeley: Univer-sity of California Press; 2009.
17. Eddy SR. Hidden Markov models. Current Opinion in Structural Biology. 1996; 6:361–365. doi:10. 1016/S0959-440X(96)80056-XPMID:8804822
18. Etzioni A. The Active Society. New York: Free Press; 1968.
19. Hurley RF. Group culture and its effect on innovative productivity. Journal of Engineering and Technol-ogy Management. 1995; 12(1):57–75. doi:10.1016/0923-4748(95)00004-6
20. Astrachan JH. Family firm and community culture. Family Business Review. 1988; 1(2):165–189. doi: 10.1111/j.1741-6248.1988.00165.x
21. Chen AY, Sawyers RB, Williams PF. Reinforcing ethical decision making through corporate culture. Journal of Business Ethics. 1997; 16(8):855–865. doi:10.1023/A:1017953517947
22. Wuchty S, Jones BF, Uzzi B. The increasing dominance of teams in production of knowledge. Science. 2007; 316(5827):1036–1039. doi:10.1126/science.1136099PMID:17431139
23. GuimeràR, Uzzi B, Spiro J, Amaral LAN. Team assembly mechanisms determine collaboration net-work structure and team performance. Science. 2005; 308(5722):697–702. doi:10.1126/science. 1106340PMID:15860629
24. Xuan Q, Fang H, Fu C, Filkov V. Temporal motifs reveal collaboration patterns in online task-oriented networks. Physical Review E. 2015; 91(5):052813. doi:10.1103/PhysRevE.91.052813
27. Weber S. The Success of Open Source. Cambridge, MA: Cambridge University Press; 2004.
25. Dempsey BJ, Weiss D, Jones P, Greenberg J. Who is an open source software developer? Communi-cations of the ACM. 2002; 45(2):67–72. doi:10.1145/503124.503125
26. Mockus A, Fielding RT, Herbsleb JD. Two case studies of open source software development: Apache and Mozilla. ACM Transactions on Software Engineering and Methodology. 2002; 11(3):309–346. doi: 10.1145/567793.567795
28. Pattison DS, Bird CA, Devanbu PT. Talk and work: A preliminary report. In: Proceedings of the 2008 International Working Conference on Mining Software Repositories. New York; 2008. p. 113–116.
29. Buldyrev SV, Parshani R, Paul G, Stanley HE, Havlin S. Catastrophic cascade of failures in interdepen-dent networks. Nature. 2010; 464(7291):1025–1028. doi:10.1038/nature08932PMID:20393559
30. Brummitt CD, D’Souza RM, Leicht E. Suppressing cascades of load in interdependent networks. Pro-ceedings of the National Academy of Sciences. 2012; 109(12):E680–E689. doi:10.1073/pnas. 1110586109
31. Xuan Q, Du F, Yu L, Chen G. Reaction-diffusion processes and metapopulation models on duplex net-works. Physical Review E. 2013; 87(3):032809. doi:10.1103/PhysRevE.87.032809
32. Bird C, Gourley A, Devanbu P, Gertz M, Swaminathan A. Mining email social networks. In: Proceedings of the 3th International Workshop on Mining Software Repositories. Shanghai, China: ACM; 2006. p. 137–143.
33. Xuan Q, Gharehyazie M, Devanbu PT, Filkov V. Measuring the effect of social communications on indi-vidual working rhythms: A case study of open source software. In: Proceedings of the 2012 Interna-tional Conference on Social Informatics. Washington D.C.: IEEE; 2012. p. 78–85.
34. Bird C, Gourley A, Devanbu P, Swaminathan A, Hsu G. Open borders? Immigration in open source projects. In: Proceedings of the 4th International Workshop on Mining Software Repositories. IEEE; 2007. p. 6–6.
35. Gharehyazie M, Posnett D, Filkov V. Social activities rival patch submission for prediction of developer initiation in OSS projects. In: Proceedings of the 29th IEEE International Conference on Software Main-tenance. IEEE; 2013. p. 340–349.
36. Team RC. R: A language and environment for statistical computing. R Foundation for Statistical Com-puting, Vienna, Austria. 2013. ISBN 3-900051-07-0; 2014.
37. Kashtan N, Alon U. Spontaneous evolution of modularity and network motifs. Proceedings of the National Academy of Sciences. 2005; 102(39):13773–13778. doi:10.1073/pnas.0503610102
38. Elandt-Johnson RC, Johnson NL. Survival Models and Data Analysis. Wiley New York; 1980.
39. Cox DR. Regression models and life tables. JR stat soc B. 1972; 34(2):187–220. Available:http://www. jstor.org/stable/2985181
40. Jain AK, Murty MN, Flynn PJ. Data clustering: A review. ACM Computing Surveys (CSUR). 1999; 31 (3):264–323. doi:10.1145/331499.331504
41. Cothrel JP. Measuring the success of an online community. Strategy & Leadership. 2000; 28(2):17–21. doi:10.1108/10878570010341609
43. Ridings CM, Gefen D. Virtual community attraction: Why people hang out online. Journal of Computer-Mediated Communication. 2004; 10(1):00–00. doi:10.1111/j.1083-6101.2004.tb00229.x
44. Von Krogh G, Spaeth S, Lakhani KR. Community, joining, and specialization in open source software innovation: a case study. Research Policy. 2003; 32(7):1217–1241. doi:10.1016/S0048-7333(03) 00050-7
45. Adamczyk PD, Bailey BP. If not now, when?: The effects of interruption at different moments within task execution. In: Proceedings of the SIGCHI Conference on Human Factors in Computing Systems. Vienna, Austria: ACM; 2004. p. 271–278.
47. LaToza TD, Venolia G, DeLine R. Maintaining mental models: A study of developer work habits. In: Pro-ceedings of the 28th International Conference on Software Engineering. Shanghai, China: ACM; 2006. p. 492–501.
46. Basoglu KA, Fuller MA, Sweeney JT. Investigating the effects of computer mediated interruptions: An analysis of task characteristics and interruption frequency on financial performance. International Jour-nal of Accounting Information Systems. 2009; 10(4):177–189. doi:10.1016/j.accinf.2009.10.003
48. Cataldo M, Herbsleb JD. Coordination breakdowns and their impact on development productivity and software failures. IEEE Transactions on Software Engineering. 2013; 39(3):343–360. doi:10.1109/ TSE.2012.32
49. Xuan Q, Filkov V. Building it together: Synchronous development in OSS. In: Proceedings of the 36th International Conference on Software Engineering. Hyderabad, India: ACM; 2014. p. 222–233.
50. Dabbish L, Stuart C, Tsay J, Herbsleb J. Social coding in GitHub: transparency and collaboration in an open software repository. In: Proceedings of the ACM 2012 Conference on Computer Supported Coop-erative Work. Seattle, WA: ACM; 2012. p. 1277–1286.
51. Giles J. Internet encyclopaedias go head to head. Nature. 2005; 438(7070):900–901. doi:10.1038/ 438900aPMID:16355180
52. Vasilescu B, Filkov V, Serebrenik A. StackOverflow and GitHub: Associations between software devel-opment and crowdsourced knowledge. In: Proceedings of the 2013 International Conference on Social Computing. Alexandria, VA: IEEE; 2013. p. 188–195.
53. Xuan Q, Okano A, Devanbu PT, Filkov V. Focus-shifting patterns of OSS developers and their congru-ence with call graphs. In: Proceedings of the 22nd ACM SIGSOFT International Symposium on the Foundations of Software Engineering. Hong Kong, China: ACM; 2014.
54. Cataldo M, Mockus A, Roberts JA, James D Herbsleb Herbsleb JD. Software dependencies, work dependencies, and their impact on failures. IEEE Transactions on Software Engineering. 2009; 35 (6):864–878. doi:10.1109/TSE.2009.42
55. Bird C, Nagappan N, Gall H, Murphy B, Devanbu P. Putting it all together: Using socio-technical net-works to predict failures. In: Proceedings of the 20th International Symposium on Software Reliability Engineering. Mysuru, Karnataka: IEEE; 2009. p. 109–119.
56. Wagstrom P, Herbsleb J, Carley K. A social network approach to free/open source software simulation. In: Proceedings of the 1st International Conference on Open Source Systems; 2005. p. 16–23. Avail-able:http://alliance.casos.cs.cmu.edu/publications/papers/2005ASocialNetworkApproach.pdf
57. Zhou M, Mockus A. What make long term contributors: Willingness and opportunity in oss community. In: Proceedings of the 34th International Conference on Software Engineering. IEEE; 2012. p. 518– 528.
58. Herbsleb JD, Roberts JA. Collaboration in software engineering projects: A theory of coordination. In: Proceedings of the 2006 International Conference on Information Systems. Milwaukee, Wisconsin; 2006. p. 38. Available:http://aisel.aisnet.org/icis2006/38