The Influence of God Class and Long Method in the Occurrence of Bugs in Two
Open Source Software Projects: An Exploratory Study
Aloisio Sampaio Cairo
HGlauco de Figueiredo Carneiro
HAntônio Maria Pereira de Resende
JFernando Brito e Abreu
IH
Universidade Salvador (UNIFACS), Brazil
JUniversidade Federal de Lavras (UFLA), Brazil
I
Instituto Universitário de Lisboa (ISCTE-IUL), Portugal
Abstract
Context: Code smells are associated with poor design and programming style that often degrades code quality and hampers code comprehensibility and maintainability. Goal: In this paper, we investigated to which extent classes affected by the God Class and Long Method code smells were more susceptible to the occurrence of software bugs. Method: We conducted an exploratory study targeting two well known open source software projects, Apache Tomcat and Eclipse JDT Core Component. We applied corre-lation analysis in order to evaluate to which extent Long Method and God Class were related to the occurrence of bugs.
Results: We have found a significant correlation of Long Method and Commits and, on the other hand, a poor cor-relation of God Class and Commits in the two analyzed projects. Therefore, we expected that the higher the num-ber of occurrences of Long Method, the higher the chances of more commits in a class that contains this method, which could result in the increase of occurrence of bugs.
Conclusion: Based on the results, we confirmed what other studies pointed out, regarding classes affected by Long Method being more bug-prone than others. In practice, we found evidence, from analyzed data, that the occurrence of Long Method implies more effort in maintenance tasks.
1
Introduction
Throughout releases, a software project usually includes new functionalities and fixes bugs that were found and con-sidered relevant in previous releases. Since maintenance costs are the highest share in the development lifecycle [1], special attention should be dedicated to avoid bugs.
Martin Fowler, in his book on software refactoring [2], claimed that code smells can negatively impact software quality, namely on its understandability and reliability. For more than a decade after that, several authors have claimed
that the empirical evidence of such impact was still scarce [3, 4, 5] and, as such, Fowler’s claim could not be consid-ered as fully confirmed. Among the 22 code smells pre-sented in Fowler’s book, we selected God Class and Long Method to provide further evidence of their influence on software bugs occurrence. The former refers to classes that centralize the intelligence of the system, realizing too much work, when compared with the remainder classes, while the latter refers to methods with many statements and/or com-plex control flow structures [6].
To reach our stated research objective, we analyzed two projects, Apache Tomcat and Eclipse JDT Core Component. Tomcat is a "pure Java" HTTP web server environment in which Java code can run. JDT (Java Development Tools) Core Component is the Java in-frastructure of Eclipse’s Java IDE. We have chosen these two projects because they: (i) are open source; (ii) have a prominent popularity in the Java community; (iii) have been studied in the literature by several authors [7, 8, 9]; (iv) are related in the scope of this study.
Regarding the last reason, we found the relationship in their bug repository: 51 closed bugs from Apache Tomcat are related to the Eclipse project. These bugs were re-ported in classes affected by God Class or containing meth-ods affected by Long Method in the following releases analyzed in this study: 9_0_9 of (Apache Tomcat) and Y20180725-2200 (Eclipse JDT Core). Moreover, we have also noticed that 36 bugs out of those 51 were reported in classes simultaneously affected by both code smells in those releases. Hence, we considered that the influence of the aforementioned code smells in the selected software projects deserved further analysis.
The remainder of this paper is laid out as follows. Sec-tion 2 overviews previous related research work. The ex-perimental design of our study is presented in Section 3 and Section 4 discusses its results. Finally, in Section 5, we present concluding remarks and future work.
2
Related Work
Lehman’s second law of software evolution [10] argues that as a project grows, software complexity increases as well. Constantly changing code is the context in which code smells find favorable conditions to arise. Studies have reported that code smells usually affect a software entity, such as class or method, after a change executed to fix a bug [11]. To tackle this problem, several approaches have been proposed to support the identification of code smells, as de-scribed in secondary studies such as the ones conducted by Rasool and Arshad [12] and Fernandes et al. [13].
According to [14], code smells are indicators of poor source code quality and hamper its maintenance and reuse. The influence of the God Class and Long Method code smells on software bugs occurrence has been studied by several authors. Li and colleagues [15] reported the influ-ence of Shotgun Surgery, God Class, and God Method code smells on bugs based on the analysis of post-release system evolution. They confirmed that some smells were positively associated with the class error probability in three error-severity levels (High, Medium, and Low), usually applied to classify issues. In [16], the authors unveiled the relation-ship among Shotgun Surgery, God Class and God Methods code smells and the occurrence of bugs in three Eclipse releases (3.0, 2.1 and 2.0). Olbrich and colleagues [17] pre-sented evidence that instances of God Class and Brain Class suffered more frequent changes and contained more defects than classes not affected by those smells.
Later, Nascimento and SantAnna [18] analyzed five soft-ware projects (Apache Ant, Apache Jmeter, Apache Lenya, Apache Tomcat and Apache Xerces) to con-clude that classes affected by the code smells Data Class, Data Clumps, Feature Envy, God Class, Message Chain, Schizophrenic Class and Tradition Breaker had a higher likelihood to introduce bugs than other classes from the same project. They further reported God Class as the smell with the greatest number of related bugs in the an-alyzed projects with a percentage of 20%, followed by Fea-ture Envywith a percentage close to 15%, Schizophrenic Classwith 9% and Message Chains with 7%. In addition, Palomba and colleagues [8] claimed that classes with code smells tend to be more change- and fault-prone than other classes and that this is even more noticeable when the same class is affected by multiple smells.
A recent systematic literature review conducted by Cairo and colleagues [19] claims that there is evidence in the liter-ature showing that software entities, such as classes affected by code smells, tend to be more prone to change and failure than other classes.
3
The Experimental Design
This section describes the characteristics and steps ap-plied in this exploratory study. We adopted the
Goal-Question-Metric (GQM) approach [20], as described in Ta-ble 1, to derive the following Research Question (RQ): To which extent God Class and Long Method code smells influence the occurrence of bugs in Apache Tomcat and Eclipse’s JDT Core Component projects?
Table 1: Research goal based on the GQM approach
Analyze the God Class and Long Method code smells
for the purpose of evaluating their influence with respect to the occurrence of bugs from the viewpoint of maintainers and developers in the context of
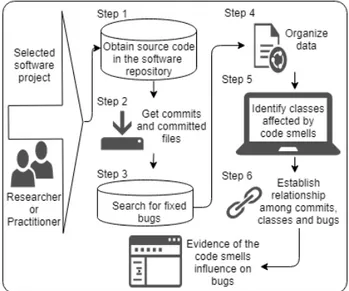
Apache Tomcat and Eclipse’s JDT Core Component open source software projects To reduce the collection time and the frequent errors that arise during code smells manual detection [21], we used the PMD static code analyzer. We performed the six steps represented in Figure 1 that will be further detailed in the following paragraphs, using a common template (data input, step description, performing the step, data output).
Figure 1: Proposed approach to analyze the influence of code smells on bugs occurrence in a software project
3.1 Step 1 - Obtain source code
Data input:URL of selected software projects repository. Step description: We cloned the sources of each selected software project using Git Bash, a Windows application which provides a Git command line shell.
Performing the step:We executed the git clone command. Data output: Local repository containing the source code of selected software projects.
3.2 Step 2 - Get commits and coresponding files Data input: GitHub features that allow the collection of data related to commits performed in a software project. Step description: We executed the command lines 1 and 2 presented below using Git Bash. Besides commits, we also collected the files involved in each commit.
Performing the step:Execute the commands as follows: (1) git log –pretty=format:"%H %h %an %ad %s" – grep="bug" > log-commit.txt(stores the names of all files involved in each commit in the named file)
(2) git show hash-numbers –pretty=format: "%H" –stat > log-arquivos.txt(stores all commit hashes in the named file) 3.3 Step 3 - Search for fixed bugs
Data input: Bugzillafeatures that allow the collection of data related to bugs of a specific software project.
Step description: Identify all bugs marked as closed for all analyzed software projects.
Performing the step: We collected all closed bugs for Apache Tomcatuntil August 8th (2018) and for Eclipse until September 9th (2018). We used the Bugzilla’s REST APIto obtain data from the projects’ repositories.
Data output:Files containing information related to bugs in JSONformat from the analyzed software projects.
3.4 Step 4 - Organize data
Data input:Data about commits and bugs for each project. Step description:We tabulated raw data to prepare them for statistical analysis.
Performing the step: All data was inserted in a database and we applied queries to get it organized in table format. After that, we exported them to a spreadsheet for apply-ing statistical analysis. An automatic routine was imple-mented to capture the ID from Bugzilla repositories. Only Java files were considered and all others (e.g. configura-tion files) were deleted, since only the former were relevant for code smells detection. We also did not consider com-mits in files not related to code smells. Some long absolute paths to Java classes were incomplete, such as, for instance in ".../apache/catalina/connector/CoyoteAdapter.java". In those cases, we searched manually for the file and com-pleted the correct absolute path string, being careful in cases of multiple files with the same name, located in different packages.
Data output: Commit data, file involved in each commit, and bugs of each project.
3.5 Step 5 - Identify classes affected by code smells Data input:Source code of projects cloned in step 1. Step description: We used the PMD tool to collect informa-tion about code smells.
Performing the step: The PMD tool was applied in each project to detect God Class and Long Method occurrences. Data output:A table containing all software project classes
affected by God Class and Long Method, and the number of occurrences of each code smell, for each class.
3.6 Step 6 - Evidence of code smells influence on bugs Data input: Each line of tabulated data contains software project name, version, absolute path of Java class, class name, occurrences of Long Method, occurrences of God Classand total amount of commits involving both projects. Step description:We performed statistical analysis on avail-able data to check the intensity of correlations among code smells and bugs.
Performing the step: Since the data was not normally dis-tributed, we used the Spearman non-parametric correlation coefficient to check the correlation among the occurrences of each code smell and the amount of commits. We grouped the commits in ranges to check the correlation. Data out-put:Intensity of correlation among code smells occurrences and amount of bugs, represented by commits.
4
The Study Results
4.1 Distribution adherence testing
All data used in this analysis is available in a public Github repository1. The total number of classes analyzed
with at least one commit are 1049 and all those classes have at least one code smell. The first step of a statistical cor-relation analysis is to verify whether the data is normally distributed. This verification allows the selection of the most suitable statistical technique to be applied. We used the EasyFit tool2to perform the aforementioned
verifica-tion. The results pointed out that the occurrences of Long Method and God Class have Poisson Distribution and the amount of commits has Geometric distribution. Since none of them has a normal distribution, that required the appli-cation of a non-parametric correlation coefficient such as Spearman’s.
4.2 Correlation analysis by commit ranges
The main research question stated in Section 3 aimed at devising to which extent God Class and Long Method code smells influence (or have impact in) the occurrence of bugs in two open source projects. In this study we only consid-ered bugs that were fixed and took as surrogate of those bugs the number of file (class) commits they cause. Therefore, the research question originated two sub-questions, one per each code smell, where we want to check if there is a statis-tical significant association among the variables that allow us to not discard that the aforementioned impact exists. In other words, the sub-questions are:
a) Is there a correlation between the occurrences of Long Method in a class and the amount of commits in that class?
1https://github.com/SEKE2019CodeSmell/SEKE2019EvidenceCodeSmells 2http://www.mathwave.com/
b) Is there a correlation between the occurrences of God Class in a class and the amount of commits in that class?
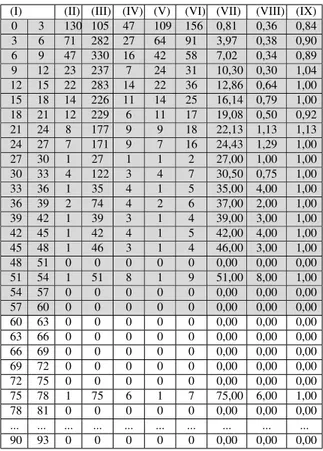
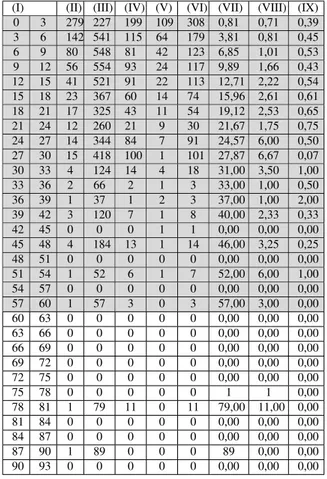
To answer those questions, while eliminating some ran-dom deviations that might have occurred in collected data, we grouped the analyzed classes by consecutive ranges of 3 commits. Therefore, the first range contains classes with commits within the [0, 3[ range, the second in the [3, 6[ range, and so forth, as represented in the first two columns in Tables 2 and 3 for the Apache Tomcat and Eclipse JDT Core Component, respectively. For instance, the values of 130 and 279 on the first line of column II of the same tables represent the total number of classes with 0, 1 or 2 com-mits (range defined in column I) in the two analyzed soft-ware projects. We have also normalized the amount of class commits, occurrences of Long Method and God Class, by calculating their average value per class. The column labels of Tables 2 and 3 are as follows:
(I) Commit range (>= and <, respectively) (II) Class total
(III) Commits Sum
(IV) Long Method Total (occurrences) (V) God Class Total (occurrences) (VI) Code Smells Total (occurrences) (VII) Average Commits Per Class
(VIII) Long Method Average (occurrences) Per Class (IX) God Class Average (occurrences) Per Class
The highlighted lines in Tables 2 and 3 represent the data that we considered as relevant. The classes with commits above the 57-60 range were clear outliers and were ignored in the following study. To confirm this claim, we gener-ated dispersion charts (Figures 2 and 3) to visually check the distribution of data in the ranges. The Long Method chart provides some evidence of correlation, because the points are around the tendency line and increasing, meaning a positive correlation. Furthermore, it is possible to obtain a curve with even better fit (as measured by the R squared coefficient of determination), what suggests that the effect of this code smell on commits may be non-linear. As for the God Class the chart does not provide evidence of corre-lation. After determining the valid data, without irrelevant lines and outliers, we calculated the Spearman correlations. The results are presented in Table 4.
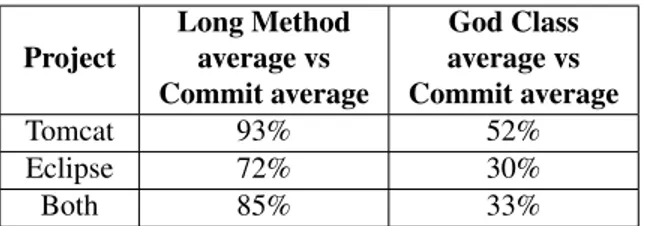
To interpret the values of the coefficients in Table 4, we used the ordinal intensity scale presented in Table 5 (from [22]). Therefore, based on the obtained values of the Spearman correlation coefficient in Table 4, we can state that there is a very high positive correlation between Long MethodAverage and Commit Average. Consequently, that result allow us to raise the hypothesis that the number of commits in a class may be impacted by the occurrences of the Long Method code smell. The same cannot be claimed for the God Class code smell, since only a moderate posi-tive correlation was observed. For the Eclipse project, we
Table 2: Classes grouped by commit ranges (APACHE TOMCAT)
(I) (II) (III) (IV) (V) (VI) (VII) (VIII) (IX) 0 3 130 105 47 109 156 0,81 0,36 0,84 3 6 71 282 27 64 91 3,97 0,38 0,90 6 9 47 330 16 42 58 7,02 0,34 0,89 9 12 23 237 7 24 31 10,30 0,30 1,04 12 15 22 283 14 22 36 12,86 0,64 1,00 15 18 14 226 11 14 25 16,14 0,79 1,00 18 21 12 229 6 11 17 19,08 0,50 0,92 21 24 8 177 9 9 18 22,13 1,13 1,13 24 27 7 171 9 7 16 24,43 1,29 1,00 27 30 1 27 1 1 2 27,00 1,00 1,00 30 33 4 122 3 4 7 30,50 0,75 1,00 33 36 1 35 4 1 5 35,00 4,00 1,00 36 39 2 74 4 2 6 37,00 2,00 1,00 39 42 1 39 3 1 4 39,00 3,00 1,00 42 45 1 42 4 1 5 42,00 4,00 1,00 45 48 1 46 3 1 4 46,00 3,00 1,00 48 51 0 0 0 0 0 0,00 0,00 0,00 51 54 1 51 8 1 9 51,00 8,00 1,00 54 57 0 0 0 0 0 0,00 0,00 0,00 57 60 0 0 0 0 0 0,00 0,00 0,00 60 63 0 0 0 0 0 0,00 0,00 0,00 63 66 0 0 0 0 0 0,00 0,00 0,00 66 69 0 0 0 0 0 0,00 0,00 0,00 69 72 0 0 0 0 0 0,00 0,00 0,00 72 75 0 0 0 0 0 0,00 0,00 0,00 75 78 1 75 6 1 7 75,00 6,00 1,00 78 81 0 0 0 0 0 0,00 0,00 0,00 ... ... ... ... ... ... ... ... ... ... 90 93 0 0 0 0 0 0,00 0,00 0,00
have a high positive correlation for Long Method Average and Commit Average, and for God Class Average and Com-mit Average. Those correlations in the Eclipse project are lower than in the Tomcat project, even though both projects presented a significant correlation. When we consider both projects together, the results keep in-between, as expected. 4.3 Answering the research questions
As discussed in section 4.2, our main research question was split in two, each regarding the association between the occurrences of one code smell and the corresponding com-mits. Considering the observed high correlation, we can-not refute the hypothesis that the number of occurrences of Long Methodmay have a positive impact on the amount of commits. As for the God Class code smell, due to the ob-served moderate to low positive correlation, we have to say it the other way round: we cannot sustain the hypothesis that the number of occurrences of Long Method may have an impact on the amount of commits.
4.4 Threats to Validity
We are aware of the limitations of correlational analyses such as the used in this study. For this reason, we dubbed this paper as an exploratory study. The evidence raised ba-sically allows to stand or discard hypotheses that must be tested, preferably with controlled experiments. The
conclu-Table 3: Classes grouped by commit ranges (ECLIPSE JDT CORE)
(I) (II) (III) (IV) (V) (VI) (VII) (VIII) (IX) 0 3 279 227 199 109 308 0,81 0,71 0,39 3 6 142 541 115 64 179 3,81 0,81 0,45 6 9 80 548 81 42 123 6,85 1,01 0,53 9 12 56 554 93 24 117 9,89 1,66 0,43 12 15 41 521 91 22 113 12,71 2,22 0,54 15 18 23 367 60 14 74 15,96 2,61 0,61 18 21 17 325 43 11 54 19,12 2,53 0,65 21 24 12 260 21 9 30 21,67 1,75 0,75 24 27 14 344 84 7 91 24,57 6,00 0,50 27 30 15 418 100 1 101 27,87 6,67 0,07 30 33 4 124 14 4 18 31,00 3,50 1,00 33 36 2 66 2 1 3 33,00 1,00 0,50 36 39 1 37 1 2 3 37,00 1,00 2,00 39 42 3 120 7 1 8 40,00 2,33 0,33 42 45 0 0 0 1 1 0,00 0,00 0,00 45 48 4 184 13 1 14 46,00 3,25 0,25 48 51 0 0 0 0 0 0,00 0,00 0,00 51 54 1 52 6 1 7 52,00 6,00 1,00 54 57 0 0 0 0 0 0,00 0,00 0,00 57 60 1 57 3 0 3 57,00 3,00 0,00 60 63 0 0 0 0 0 0,00 0,00 0,00 63 66 0 0 0 0 0 0,00 0,00 0,00 66 69 0 0 0 0 0 0,00 0,00 0,00 69 72 0 0 0 0 0 0,00 0,00 0,00 72 75 0 0 0 0 0 0,00 0,00 0,00 75 78 0 0 0 0 0 1 1 0,00 78 81 1 79 11 0 11 79,00 11,00 0,00 81 84 0 0 0 0 0 0,00 0,00 0,00 84 87 0 0 0 0 0 0,00 0,00 0,00 87 90 1 89 0 0 0 89 0,00 0,00 90 93 0 0 0 0 0 0,00 0,00 0,00
sion validity is related to the ability to draw significant cor-rect conclusions. For this reason, we applied the distribu-tion adherence testing and the correladistribu-tion analysis by com-mit ranges based on dispersion chats to support the analysis. We discussed the internal validity in terms of threats to the design of the study. For this reason, we managed to care-fully plan the study and the variables to consider in the anal-ysis as described in the six steps presented in Section 3. The use of the PMD tool for collecting code smells can be also a potential threat, since several authors have pointed out the inherent subjectivity in the code smells definition [23] can lead to unmatched detection, when using different tools. We expect to mitigate this last problem through our ongoing research work on the Crowdsmelling approach [24]. The external validity represents the possibility of generalizing the findings of this study. We identified external validity threats in our results, since the analysis was restricted to data from two open source software project systems, imple-mented in one programming language and focusing on two code smells from the catalogue published in [2]. However, the fact that these two open source software projects have an active community is an evidence of the
representative-Figure 2: Dispersion Chart between Average Commits and Long Method Average occurrences (both projects)
Figure 3: Dispersion Chart between Average Commits and God Class Average occurrences (both projects)
ness of these projects to support the conclusions drawn is this study for the analyzed code smells implemented in the Java language.
5
Conclusions
In this paper, we conducted an exploratory study upon two open source projects (Apache Tomcat and Eclipse JDT Core Component), in order to check if the occurrences of the Long Method and God Class code smells were as-sociated to software defects (bugs). The PMD tool was ap-plied to gather those code smells from all classes of those projects where code fixes occurred. The REST API of the Bugzillatool was used to identify which were the files af-fected by code fixes (i.e. those where commits occurred dur-ing code fixdur-ing), by collectdur-ing data related to all closed bugs of those projects. We applied the Spearman correlation co-efficient to evaluate the association between average values (per class) of a) occurrences of Long Method and observed commits; b) occurrences of God Classes and observed com-mits; and c) occurrences of both code smells and observed commits. We obtained a strong correlation of Long Method and Commits and revealead a poor correlation of God Class
Table 4: Spearman correlations (code smells vs commit ranges) Project Long Method average vs Commit average God Class average vs Commit average Tomcat 93% 52% Eclipse 72% 30% Both 85% 33%
Table 5: Interpreting the Correlation Coefficient [22] Correlation Interpretation of correlation 90% to 100% Very high positive (negative) 70% to 90% High positive (negative) 50% to 70% Moderate positive (negative) 30% to 50% Low positive (negative) 0% to 30% Negligible correlation
and Commits, regarding both projects analyzed. Therefore, the higher is the number of Long Method, the higher is ex-pected to be the number of commits in a class, although the effect is probably non-linear. In practice, we got strong evidence in those datasets that the occurrence of the Long Methodmay make the maintenance process harder, so we should avoid it through refactoring operations.
References
[1] L. Erlikh, “Leveraging legacy system dollars for e-business,” IT professional, vol. 2, no. 3, pp. 17–23, 2000.
[2] M. Fowler, K. Beck, J. Brant, W. Opdyke, and D. Roberts, Refactoring: improving the design of existing code. Addison-Wesley Professional, 1999.
[3] S. M. Olbrich, D. S. Cruzes, and D. I. K. SjÃÿberg, “Are all code smells harmful? a study of god classes and brain classes in the evo-lution of three open source systems,” in 2010 IEEE International Conference on Software Maintenance, Sep. 2010, pp. 1–10. [4] A. Yamashita and L. Moonen, “To what extent can maintenance
problems be predicted by code smell detection?–an empirical study,” Information and Software Technology, vol. 55, no. 12, pp. 2223– 2242, 2013.
[5] D. I. K. SjÃÿberg, A. Yamashita, B. C. D. Anda, A. Mockus, and T. DybÃˇe, “Quantifying the effect of code smells on maintenance effort,” IEEE Transactions on Software Engineering, vol. 39, no. 8, pp. 1144–1156, Aug 2013.
[6] M. Lanza and R. Marinescu, Object-oriented metrics in practice: using software metrics to characterize, evaluate, and improve the design of object-oriented systems. Springer Science & Business Media, 2007.
[7] H. Aman, “An empirical analysis on fault-proneness of well-commented modules,” in Empirical Software Engineering in Practice (IWESEP), 2012 Fourth International Workshop on. IEEE, 2012, pp. 3–9.
[8] F. Palomba, G. Bavota, M. Di Penta, F. Fasano, R. Oliveto, and A. De Lucia, “On the diffuseness and the impact on maintainabil-ity of code smells: a large scale empirical investigation,” Empirical
Software Engineering, pp. 1–34, 2017.
[9] A. Saboury, P. Musavi, F. Khomh, and G. Antoniol, “An em-pirical study of code smells in javascript projects,” in Software Analysis, Evolution and Reengineering (SANER), 2017 IEEE 24th International Conference on. IEEE, 2017, pp. 294–305.
[10] M. M. Lehman, “Laws of software evolution revisited,” in European Workshop on Software Process Technology. Springer, 1996, pp. 108–124.
[11] M. Tufano, F. Palomba, G. Bavota, R. Oliveto, M. Di Penta, A. De Lucia, and D. Poshyvanyk, “When and why your code starts to smell bad,” in Proceedings of the 37th International Conference on Software Engineering-Volume 1. IEEE Press, 2015, pp. 403–414. [12] G. Rasool and Z. Arshad, “A review of code smell mining
tech-niques,” Journal of Software: Evolution and Process, vol. 27, no. 11, pp. 867–895, 2015.
[13] E. Fernandes, J. Oliveira, G. Vale, T. Paiva, and E. Figueiredo, “A review-based comparative study of bad smell detection tools,” in Proceedings of the 20th International Conference on Evaluation and Assessment in Software Engineering. ACM, 2016, p. 18. [14] M. Mika, J. Vanhanen, C. Lassenius et al., “A taxonomy and an initial
empirical study of bad smells in code,” in null. IEEE, 2003, p. 381. [15] W. Li and R. Shatnawi, “An empirical study of the bad smells and class error probability in the post-release object-oriented system evo-lution,” Journal of systems and software, vol. 80, no. 7, pp. 1120– 1128, 2007.
[16] F. Khomh, M. Di Penta, and Y.-G. Gueheneuc, “An exploratory study of the impact of code smells on software change-proneness,” in Reverse Engineering, 2009. WCRE’09. 16th Working Conference on. IEEE, 2009, pp. 75–84.
[17] S. M. Olbrich, D. S. Cruzes, and D. I. Sjøberg, “Are all code smells harmful? a study of god classes and brain classes in the evolution of three open source systems,” in Software Maintenance (ICSM), 2010 IEEE International Conference on. IEEE, 2010, pp. 1–10. [18] R. Nascimento and C. Sant’Anna, “Investigating the relationship
be-tween bad smells and bugs in software systems,” in Proceedings of the 11th Brazilian Symposium on Software Components, Architectures, and Reuse. ACM, 2017, p. 4.
[19] A. Cairo, G. Carneiro, and M. Monteiro, “The impact of code smells on software bugs: A systematic literature review,” Information, vol. 9, no. 11, p. 273, 2018.
[20] V. Basili, G. Caldiera, and H. ROMBACH, “Goal question metric approach paradigm,” pp. 528–532, 1994.
[21] N. Moha, Y.-G. Gueheneuc, A.-F. Duchien et al., “Decor: A method for the specification and detection of code and design smells,” IEEE Transactions on Software Engineering (TSE), vol. 36, no. 1, pp. 20– 36, 2010.
[22] D. E. Hinkel, W. Wiersma, and S. G. Jurs, Applied statistics for the behavioral sciences, 5th ed. Hougthon Mifflin Company, 2003. [23] S. Bryton, F. Brito e Abreu, and M. Monteiro, “Reducing subjectivity
in code smells detection: Experimenting with the long method,” in 2010 Seventh International Conference on the Quality of Information and Communications Technology. IEEE, 2010, pp. 337–342. [24] J. P. dos Reis, F. Brito e Abreu, and G. Carneiro, “Code smells
de-tection 2.0: Crowdsmelling and visualization,” in 2017 12th Iberian Conference on Information Systems and Technologies (CISTI). IEEE, 2017, pp. 1–4.