E
LECTRON TRANSFER BIOCHEMISTRY
METAL REDUCTASE ACTIVITY OF TRIHEME CYTOCHROME C
3E
DUARDO
P
AULO DE
O
LIVEIRA LOPES
C
ALÇADA
D
ISSERTATION PRESENTED TO OBTAIN AMS
C DEGREE INB
IOCHEMISTRY AT THEF
ACULDADE DEC
IÊNCIAS DAS
AÚDE,
U
NIVERSIDADE DAB
EIRAI
NTERIOR
S
UPERVISORS:
R
ICARDOO.
L
OURO&
I
LÍDIOJ.
C
ORREIAO
PPONENT:
L
UÍSP
ASSARINHAAcknowledgements
A investigação subjacente a esta tese foi o resultado culminar do esforço comum onde orientadores, professores, amigos e restante comunidade científica fora desta instituição desenvolveram um papel importante. Sem eles, nunca teria acesso ao vasto conhecimento inerente e esta investigação nunca teria sido possível.
Ao meu orientador Prof. Doutor Ricardo Louro a audácia, a lucidez e a confiança concedida no presente trabalho, assim como o apoio incondicional na resolução dos problemas que surgiram no desenvolvimento do mesmo;
Ao Prof. Doutor Ilídio Correia pela ousadia de me encaminhar rumo a novos desafios;
Ao Prof. Doutor Carlos Romão pelo apoio e aconselhamento no uso e síntese dos ferrocenos no seu laboratório.
Ao Doutor Yann Astier pela ajuda na familiarização com o potenciostato, assim como nas dúvidas relacionadas com electroquímica.
À Doutora Catarina Paquete pelo empenho, cooperação e perseverança reveladas, assim como nos aconselhamentos e apoio na interpretação tanto das bases cinéticas, como dos procedimentos laboratoriais.
À Engenheira Isabel Pacheco pela simpatia e disponibilidade;
Aos colegas de laboratório Alexandra, Bruno e Ivo, que permitiram toda a harmonia e boa disposição no ambiente laboratorial;
Ao Doutor Lukas Kromer pela ajuda na síntese organometálica dos ferrocenos no laboratório do Doutor Carlos Romão.
Aos amigos que sempre acompanharam o ultrapassar de cada etapa, Ana, Carlos, Diana, Leitão, Márcia, Nelson, Ricardo, Rodrigo, Rute e Teresa.
À minha namorada Adelaide Santos pela ubiquidade em todas as emoções, e por ter sido sempre o alicerce essencial de subtileza e determinação.
À família que se divide por Viseu e pela Guarda. Aos meus pais, a quem com saudade dedico esta tese.
Abbreviations
D. acetoxidans Desulfuromonas acetoxidans
DIRB Dissimilatory iron‐reducing bacteria
DSMZ Deutsche Sammlung von Mikroorganismen
und Zellkulturen GmbH (German Collection of Microorganisms and Cell Cultures) DEAE Diethylaminoethyl DFF DEAE Fast‐Flow column SDS Sodium dodecyl sulfate PAGE Polyacrylamide gel electrophoresis OD Optical density IUPAC International union of pure and applied chemistry NMR Nuclear magnetic resonance SRB Sulfate reducing bacteria Fc Ferrocene SCE Saturated Calomel Electrode SHE Standard Hydrogen Electrode
Keywords
Electron transfer; Kinetics; Cytochrome c; Metal reductase; Bioremediation; Organometallics;
Resumo
Os microrganismos anaeróbicos isolados de sedimentos, como Desulfuromonas acetoxidans apresentam um mecanismo respiratório de notável versatilidade. Este microrganismo Gram‐negativo é estritamente anaeróbio, capaz de adaptar o seu metabolismo a uma vasta gama de aceitadores de electrões, como elementos tóxicos e metais insolúveis. Da grande variedade de citocromos que este microrganismo apresenta, o citocromo c7 é o mais abundante, e está evolvido na redução de
metais. Esta pequena proteína (9kDa) contém três hemos tipo‐c com coordenação axial bis‐histidina. A sua estrutura tridimensional e o arranjo dos três hemos é análoga ao dos citocromos c3 tetrahémicos de bactérias redutoras de sulfato.
No entanto, apresenta diferentes propriedades termodinâmicas e cinéticas. Compreender os mecanismos moleculares da transferência electrónica na cadeia respiratória tem‐se tornado um grande desafio. Foi demonstrado que o ambiente electrostático do citocromo c7, é o parâmetro mais influente que
condiciona o local de ligação para a reacção de transferência de electrões entre parceiros redox. O conhecimento detalhado do comportamento desta proteína na transferência de electrões na cadeia respiratória contribuirá para optimizar potencias aplicações de Desulfuromonas acetoxidans na biorremediação de ambientes contaminados com metais pesados e também na construção de células de combustível microbianas.
Abstract
Anaerobic microorganisms isolated from sediments such as Desulfuromonas acetoxidans displays a remarkably versatile respiratory mechanism. These microorganisms are Gram‐ negative, strictly anaerobic bacteria, capable of adapting their metabolism to a wide range of electron acceptors, like toxic elements and insoluble metals. From the large variety of cytochromes from these microorganisms, cytochrome c7 is the
most abundant, being a small (9kDa) protein that contains three c‐type hemes with bis‐hystidinyl axial coordination. This protein participates in the reduction of metals. It presents a similar three‐dimensional fold as well a conserved arrangement of the three hemes analogous to the tetraheme cytochrome c3
from sulfate reducing bacteria. However it presents different thermodynamic and kinetic properties. Understanding the molecular mechanisms of the electron transfer in the respiratory chain became a major challenge. It was demonstrated that electrostatic environment of cytochrome c7
is the major factor that controls the binding site of redox partners in electron transfer reactions.
Detailed knowledge of the behaviour of this protein in the respiratory electron transfer chain will provide the basis for optimization of applications of Desulfuromonas acetoxidans in bioremediation and also in the development of microbial fuel cell technology.
Table of Contents
ACKNOWLEDGEMENTS I ABREVIATIONS ERROR! BOOKMARK NOT DEFINED. KEYWORDS III LIST OF FIGURES IX LIST OF TABLES XI LIST OF EQUATIONS XI PREFACE XII 1 INTRODUCTION 1 1.1 Biogeochemisty 1 1.1.1 Metal‐reducing bacteria 1 1.1.2 Respiratory Proteins 5 1.2 Electron transfer 8 1.2.1 Marcus Theory 8 1.2.2 Thermodynamic and Kinetic modelling 9 1.3 Biorganometallics 14 1.3.1 Ferrocenes 15 1.3.2 Cobalt complexes 16 2 MATERIALS AND METHODS 18 2.1 Source of organisms 18 2.2 Cell cultivation 18 2.2.1 Growth of Stock cultures 182.2.2 Cellular growth using Fumarate as the terminal electron acceptor 19 2.2.3 Cellular growth using Sulphur as the terminal electron acceptor 20 2.2.4 Large scale cell cultivation 20 2.3 Protein Purification 21 2.3.1 Cell harvest and disruption 21 2.3.2 Separation of soluble from membrane fractions 22 2.3.3 Protein purification 22 2.3.4 UV‐Visible spectroscopy 23 2.3.5 NMR spectroscopy 25 2.3.5.1 Sample preparation 25 2.3.5.2 NMR spectroscopy 26 2.4 Ferrocenium sample preparation 26 2.4.1 Ferrocene synthesis: 2‐Ferrocenylethanol 27 2.4.2 NMR Spectroscopy of ferrocenes 28 2.4.3 Ferrocene oxidation 28 2.4.4 Voltammetry studies 29 2.4.5 UV‐Visible spectroscopy 30 2.5 Sample preparation of Cobalt complexes 30 2.5.1 Trans‐diclrobis(ethylenediamine)coalt(III) 30 2.5.2 Cis‐diclrobis(ethylenediamine)coalt(III) 31 2.5.3 Voltammetry studies 31 2.5.4 UV‐Visible spectroscopy 31 2.6 Kinetic Studies 32 2.6.1 Circuit washing 32 2.6.2 Circuit refill procedure 33 2.6.3 Dead time calculation 33 2.6.4 Experimental assay 35 2.6.4.1 Light calibration and circuit refill 35 2.6.4.2 Preparation of mono‐substituted ferrocenes 36 2.6.4.3 Sodium dithionite sample preparation 36 2.6.4.4 Preparation of cytochromes samples 36 2.6.5 Kinetic Modelling 37 3 RESULTS 38 3.1 Bacterial growth 38 3.2 Protein Purification 38 3.3 NMR spectroscopy of protein 42 3.4 Ferrocene as mediator 43
3.4.1 Ferrocenylethanol synthesis 43 3.4.2 NMR spectroscopy of ferrocenes 43 3.4.3 Voltammetry of mono‐substituted ferrocenes 45 3.4.1 Ferrocene oxidation 46 3.4.2 UV‐Visible Spectroscopy of ferrocenes 47 3.5 Cobalt complexes as mediator 49 3.5.1 Synthesis of [trans‐Co(en)2Cl2]+ and [cis‐Co(en)2Cl2]+ 49 3.5.2 Voltammetry 49 3.5.3 UV‐Visible Spectroscopy 51 3.6 Stoppedflow calibration dead time 53 3.7 Kinetic experiments 55 3.7.1 Kinetic data using α‐Hydroxyethyl ferrocenium as mediator 55 3.7.2 Kinetic data using Trans‐[Co(en)2Cl2]+ as mediator 57 4 DISCUSSION 59 4.1 Monosubstitued ferrocenium as mediator 59 4.2 Cobalt complexes as mediators 60 5 CONCLUSION 67 6 BIBLIOGRAPHY 70
List of Figures
Figure 1.1 – The microbial mediated iron redox cycle 3 Figure 1.2 – Phylogenety affiliation of microorganisms contributing to iron redox cicling 4 Figure 1.3 – Structure and distance metrics of fully reduced D. acetoxidans cytochrome c7 6 Figure 1.4 – Schematic representation of the microstates of a protein with three redox centres and one acid‐base centre 10 Figure 1.5 ‐ Cistrans isomeriaztion Dichlorobis(ethylenediamine)cobalt 17 Figure 2.1 – French‐Press equipment in use with fast‐flow anaerobic kit 22 Figure 2.2 – Stopped‐flow equipment 32 Figure 2.3 – Cartoon of dead time determination 35 Figure 3.1 – Scale‐up procedure for large‐scale growth of D. acetoxidans 38 Figure 3.2 ‐ Schematic representation of protein purification 39 Figure 3.3 – SDS‐PAGE haem staining 39 Figure 3.4 –UV‐Visible DEAE fractions Spectra 40 Figure 3.5 – SDS‐PAGE haem staining 41 Figure 3.6 –UV‐Visible fraction B spectra from HTP column separation 41 Figure 3.7 – 1H‐NMR spectrum of purified cytochrome c7 42 Figure 3.8 ‐ Ferrocenylethanol synthesis 43 Figure 3.9 ‐ NMR spectra of ferrocenylacetic acid 44 Figure 3.10 ‐ NMR spectra of ferrocenylethanol synthesized in this work. 44 Figure 3.11 ‐ Voltammetry of mono‐substituted ferrocenes 45 Figure 3.12 – α‐hydroxyethyl ferrocene electrochemical oxidation 46 Figure 3.13 –UV‐Visible spectroscopy of mono‐substituted ferrocenes 48 Figure 3.14 – Synthesis dichlorobis(ethylenediamine)cobalt(III) 49 Figure 3.15 ‐ Voltammetry of cobalt complexes 50 Figure 3.16 – UV‐Visible spectroscopy of transdichlorobis(ethylenediamine) cobalt(III) in different solvents 51Figure 3.17 – UV‐Visible spectroscopy of trans and cis‐dichlorobis (ethylenediamine) cobalt(III) in different pH buffer solutions 52 Figure 3.18 ‐ Dead time kinetic traces of DCPIP reaction with ascorbic acid 54 Figure 3.19 ‐ Trend line of dead time determination 54 Figure 3.20 – Kinetic traces of the oxidation of D. gigas cytochrome c3 by α‐ hydroxyethyl ferrocenium 56 Figure 3.21 – UV‐visible spectroscopy of cytochrome c3 57 Figure 3.22 ‐ Kinetics of oxidation of cytochrome c7 by trans‐[Co(en)2Cl2]+ 58 Figure 4.1 – Electrostatic environment around the hemes of fully reduced cytochrome c7 from D. acetoxidans 64
List of Tables
Table 2.1 – Ascorbic acid versus DCPIP solution preparation 34 Table 3.1 – Absorbance values from each fraction from DEAE column. 40 Table 3.2 – Reduction potentials of mono‐substituted ferrocenes 47 Table 3.3 – Reduction potential of cobalt complexes 51 Table 3.4 – Reference rate constants for each heme of D. acetoxidans cytochrome c7 58 Table 4.1 – Thermodynamic parameters of cytochrome c7 from D. acetoxidans 62 Table 4.2 – Fraction of electrons that enter and leave the cytochrome c7 through each heme in each one‐electron reduction step. 66List of Equations
Equation 1.1 ‐ Marcus equation 8 Equation 1.2 ‐ Kinetic model based on Marcus equation 13 Equation 2.1 ‐ Beer‐Lambert law 24
Preface
In the present thesis the metal reductase activity of cytochrome c7 was studied. The presentation of this work is
divided in five sections.
The introduction begins with a briefly synopsis about anaerobic microorganisms with the ability to reduce metals and ends with a description of the organometallic compounds used as mediators in this study. These two issues are linked by the description of the Marcus electron transfer theory as well the kinetic model used. The cytochrome c7 was the focus protein in
this study. The cytochrome c3 was also used but only for the
optimization of the kinetic procedure. Two groups of metal complexes were used as mediators: mono‐substituted ferrocenes and cobalt complexes.
The materials and methods presents in detail all the procedures used. The main experimental procedures used in this work, such as Stopped‐flow and NMR techniques are described in this section.
The presentation of the results includes the analyses and observations registered in every step both for the obtaining of the protein and for the attainment of the redox partner. The modelling of the data and kinetic analysis is discussed both for mono‐substituted ferrocenes as well for cobalt complexes.
The conclusion remarks consider the understanding of results and include new targets to be applied in the future.
1 Introduction
1.1 Biogeochemistry
The primary inhabitants of sediments are prokaryotes whose diversity is expressed in terms of metabolism rather than structure because they have optimized their biochemistry for the uptake and utilization of a wide variety of nutrients, like acetate, ethanol or propanol (Gebhardt et al. 1985, Nealson & Saffarini 1994). The characteristic vertical nutrient (electron donor and electron acceptor) profiles seen in sediments are produced as a result of microbial activities, with each nutrient a product or reactant of one or more metabolic groups (Nealson 1997).
1.1.1 Metal‐reducing bacteria
Iron respiration has been proposed as one of the first forms of microbial metabolism to have evolved, preceding the development of oxygen, nitrate and sulfate respiration (Vargas et al. 1998).
For many years, the profiles of metals were regarded as the result of chemical reactions in sediment, primarily because the substrates involved were solids (Mn and Fe oxides) and thought to be inaccessible to direct bacterial reduction. This view has changed dramatically with the discovery of several groups of bacteria that grow by the dissimilatory reduction of
iron and/or manganese (Lovley & Phillips 1988, Lovley 1993, Nealson & Saffarini 1994) which results in the oxidation of organic matter and the reduction of Fe(III) or Mn(IV). A wide variety of iron oxide and iron‐bearing clay minerals (representing >90% of oxidative capacity in many environments) can serve as source of Fe(III) for use by dissimilatory iron‐reducing bacteria (DIRB). These bacteria performs the reduction of ferric iron Fe(III) to ferrous Fe(II) in anoxic non‐sulfidogenic environments, being the fundamental catalysts in iron biogeochemistry (Fredrickson & Gorby 1996).
At pH 7 iron (Fe) exists primarily as insoluble, solid‐ phase minerals in the divalent ferrous, Fe(II), or trivalent ferric, Fe(III), oxidation states (Cornell & Schwertmann 2003).
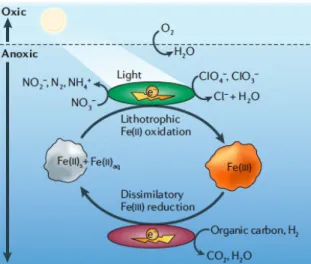
Coupled to Fe(III) reduction, microbial catabolism of organic contaminants can occur naturally (Lovley et al. 1989). Fe(III) represents the single most abundant electron acceptor for oxidation of contaminants in many subsurface environments (Fredrickson & Gorby 1996) for lithotrophic and heterotrophic Fe(III)‐reducing microorganisms (Weber et al. 2006) (figure 1.1).
The activity of DIRB results in the generation of aqueous Fe(II) (aq), and solid‐phase Fe(II)‐bearing minerals Fe(II)(s) including siderite, vivianite and geologically significant mixed‐ valence Fe(II)–Fe(III) minerals, such as magnetite and green rust (Lovley 1991).
Figure 1.1 – The microbial mediated iron redox cycle (Weber et al. 2006). The physiology of microbial Fe(III) reduction and Fe(II) oxidation remains an enigma, as a terminal Fe(III) reductase has not yet been identified and nothing apart from the implicated role of ctype cytochrome(s) is known on Fe(II) oxidation at circumneutral pH (Weber et al. 2006).
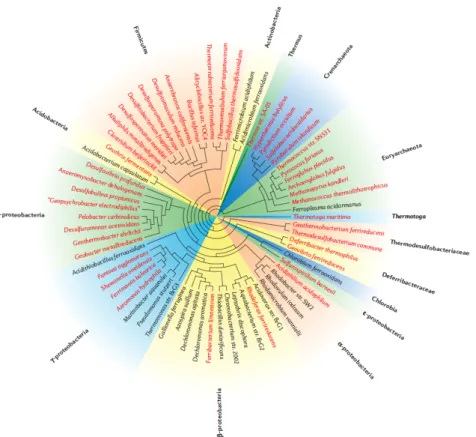
Desulfuromonas (D.) acetoxidans has been shown to use Fe(III) as a terminal electron acceptor for growth (Roden & Lovley 1993). D. acetoxidans is a strictly anaerobic, rod‐shaped, laterally flagellated, Gram‐negative bacterium first isolated from marine sediments in 50m depth in the Antarctic ocean at the South Orkney Islands (Pfennig & Biebl 1976). D. acetoxidans is involved in a symbiotic association with a green sulfur bacterium in the habitats from which it is isolated (Pfennig & Biebl 1976). The phylogeny of these bacteria (figure 1.2) belongs to the δ‐proteobacteria of microorganisms involved in redox cycle of iron (Weber et al. 2006).
Figure 1.2 – Phylogeny affiliation of microorganisms contributing to iron redox cycling (Weber et al. 2006) based on nearly complete 16S ribosomal DNA sequences.
Because it is difficult to grow in laboratory, D. acetoxidans is one of the least studied metal‐reducing microorganisms. Previous work revealed new methodologies for large scale cell cultivation in the laboratory (Fonseca 2007).
The draft genome of Desulfuromonas acetoxidans DSM684 is available on the United States Department of Energy (DOE) Joint Genome Institute (JGI). Knowing the whole genome from D. acetoxidans is an advantage for the assembly and correlation of unknown proteins from putative purification and sequence.
1.1.2 Respiratory Proteins
D. acetoxidans contains a multitude of redox proteins that are involved in its respiratory capabilities (Rache et al. 1983).
Hemeproteins such as cytochromes are widespread in living organisms being components of different biological processes. It has been proposed that one‐electron transfer occurs to stimulate reduction of metal oxides performed by cytochromes (Brown et al. 1999). The purification of cytochromes with ability to reduce metal oxides offers the possibility of study cell‐free metal dissolution. C‐type hemes are covalently bound to the polypeptide chain, through thioether linkages between the porphyrin vinyl side‐chains and cysteinyl residues (Moore & Pettigrew 1990). In all hemeproteins the iron is five or six‐coordinated, and these axial ligands are provided by aminoacids of the polypeptide chain as well by other compounds like NO, O2 or CO. Five‐coordinated hemes are
high‐spin in both oxidation states. Six coordinated hemes (the sixth ligand is usually either a methionine or a histidine) are usually low‐spin in both oxidation states. The hemeproteins cover a wide range of reduction potentials (from ‐500 mV to +400 mV) (Moore & Pettigrew 1990), allowing these proteins to be found in the electron transfer chains of anaerobic and aerobic organisms. The reduction potential of the hemes depends on multiple inter‐playing factors, such as electric charges, distance between amino acid residues, dipolar and hydrogen‐bonding interactions, solvent exposure, and heme‐
heme interactions (homotropic interactions) (Moore & Pettigrew 1990).
The cytochrome c7 formerly known as cytochrome c551,5
is the most abundant cytochrome in the periplasm of D. acetoxidans (Giudici‐Orticoni et al. 2003). It is a 68 amino acid monomeric cytochrome c containing three hemes. The hemes presents bis‐histidinyl axial iron coordination and low reduction potentials (Ambler 1991). The triheme cytochrome c7
has been proposed to have a role in the reduction of iron(III) and manganese(IV) (Roden & Lovley 1993), as also in the sulfur metabolism (Pereira et al. 1997).
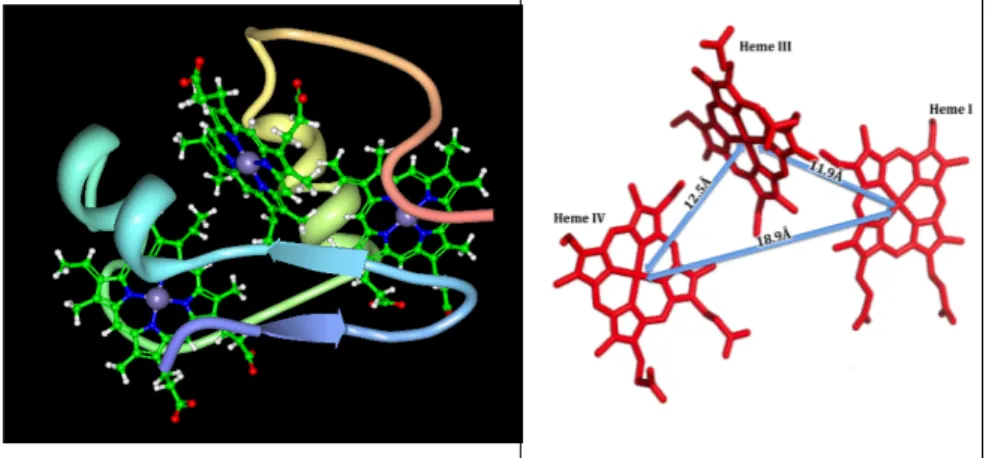
The structure of cytochrome c7 (figure 1.3) is
homologous to the tetraheme cytochrome c3 from Desulfovibrio
species with the difference that the heme II is absent in cytochrome c7.
Figure 1.3 – Structure and distance metrics of fully reduced D. acetoxidans cytochrome c7 (Assfalg et al. 2002).
Thermal denaturation studies shows that at 20 0C,
cytochrome c7 is a monomer (Giudici‐Orticoni et al. 2003). The
previously determined (Correia et al. 2002), which shows that all hemes presents similar microscopic reduction potentials in the physiological pH range (6.0 to 8.0).
It was shown that several aerobic and anaerobic chromium(VI) reducers are able to use organic contaminants as electron donors for chromium(VI) reduction, pointing for treatment of mixed wastes (Lovley & Coates 1997). Assfalg and colleagues revealed that cytochrome c7 performs the reduction
of chromium(VI) showing the presence of a specific binding site for the metal ion. The structure shows that the oxidized chromium(III) binds closer to heme IV than to the other hemes in cytochrome c7. Heme IV has the highest reduction potential
and represent the electron sink for the electrons to be transferred to chromium(VI) (Assfalg et al. 2002). These studies support the notion that cytochrome c7 displays metal reductase
activity, being an accessible tool for remediation of water and soils contaminated by heavy metals.
Its lack of specificity for electron acceptors owed to the low reduction potential of cytochrome c7 and to the exposure of
the hemes (Pereira et al. 1997, Correia et al. 2002) makes cytochrome c7 an interesting protein for varied application.
Knowing the thermodynamic parameters of cytochrome c7, the kinetic reduction behaviour and the putative binding site
for metal ions, it is of interest to study the kinetic oxidation behaviour of this cytochrome. This work will focus on detailed molecular mechanism of reduction of metal complexes by cytochrome c7.
1.2 Electron transfer
1.2.1 Marcus Theory
For one‐electron reactions, the theoretical basis for the electron‐transfer (ET) kinetics is well developed. In 1954, Marcus developed a model based on a molecular description of ET between small molecules in solution (Marcus 1956). The Marcus theory of electron transfer is widely applied. Long‐ range electron transfer is an essential component of biological systems, playing an important role in respiration (Marcus &
Sutin 1985).
Applicable to interprotein electron transfer, the rates (equation 1.1) of nonadiabatic electron‐transfer reactions are controlled by the driving force, reorganization energy, distance between the redox centers, and the nature of the intervening medium separating the electron donor and acceptor.
Equation 1.1 Marcus equation (Marcus & Sutin 1985)
In a simple intramolecular system, k will decrease with distance. ΔG0 is the standard free energy of the reaction, which
is related to the standard reduction potentials of the donor D and the acceptor A according to ΔG0 = F(E0D – E0A). The
parameter λ, is the reorganization energy, representing the molecular rearrangements that accompany the transfer (both the geometries of the molecules that are oxidized or reduced
and the polarization of the surrounding solvent should be considered). The transmission coefficient, is close to unity for an adiabatic reaction and less than unity (sometimes much less than) for a nonadiabatic reaction (Simonneaux & Bondon 2005). The pre‐exponential term depends on the strength of the electronic coupling (HAB) between the acceptor and the donor. Therefore, pre‐exponential term will depend on the overlap of the molecular wave functions of D and A, and therefore on the nature of the redox centers, on their distance, and on the intervening medium.
1.2.2 Thermodynamic and Kinetic modelling
In this work, a kinetic model that makes use of thermodynamic parameters (Catarino & Turner 2001) will be used to discriminate the reference rate constants for each heme in triheme cytochrome c7 for the oxidation process with metal
complexes. The microscopic and macroscopic thermodynamic properties of cytochromes can be assigned by NMR redox titrations at various pH values (Louro et al. 1997).
The thermodynamic parameters and the reference rate constants of each heme for the reduction process with sodium dithionite have been determinated in previous work (Correia et al. 2002).
Figure 1.4 illustrates the kinetic model for the triheme cytochrome c7. The pH dependence of the reduction potentials
is a result of the interaction between each heme and the ionisable centre.
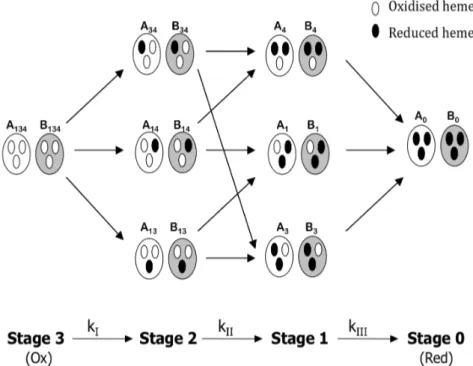
Figure 1.4 – Schematic representation of the microstates of a protein with 3 redox centres and one acidbase centre. A and B represents the protonated and deprotonated microstates respectively. Adapted from (Catarino & Turner 2001).
Cytochrome c7 may present 8 different redox states from
fully reduced to fully oxidised state. Depending on the reduction state of each of the three hemes and on the protonation state of ionisable centre, 16 microscopic states can be defined (figure 1.4). The system involves 8 protonated and 8 deprotonated microstates, which are in fast equilibrium due to the fast proton exchange. After interaction with the redox partner, the 16 microstates can be interconverted through 24 electron transfer microsteps (Correia et al. 2002). A microstep is the step between each microstate and it is represented in figure (figure
1.4) by arrows. Each microstate accounts with the ionisable centre, which can be in two states, protonated or deprotonated, so that each arrow represents two possible microsteps.
The kinetic reaction between a protein and a redox partner involves three steps according with scheme 1.1: the complex formation between the redox partner and the protein, the electron transfer reaction between them and the complex dissociation.
Scheme 1.1 Considering the multicentre cytochrome c7, which needs
three electrons to be fully reduced, the scheme 1.1 should be considered for each individual centre. Therefore, at least 6 rate constants for each heme for the deprotonated and protonated state are necessary for each microstep, turning the kinetic analysis very complex with a total of 24 rate constants (Correia et al. 2002).
On the other hand, in steady state conditions for the protein acceptor complex this scheme can be approximated to a simple collisional model (scheme 1.2) (Capeillere‐Blandin et al. 1986, De Francesco et al. 1994), where the electron transfer is rate limiting, and there is fast equilibrium in the complex association and dissociation.
Scheme 1.2 Therefore k+ and k‐ are the product of the equilibrium
binding constant and the rate constant for electron transfer. The use of large excess of oxidizing agent and the high reduction potential of the oxidizing agent allows further simplification in this system by guaranteeing irreversible electron transfer and pseudo‐first order conditions (scheme 1.3).
Scheme 1.3 The equations for the rate constants used in the model are analytical, whereas considering reversible reactions the equations need to be integrated numerically. For a three‐centre protein as cytochrome c7, the k+ has to be defined for each
single electron transfer reaction (Paquete 2006).
Considering fast intramolecular electron exchange within microstates belonging to the same oxidation stage, due to the close proximity of hemes, this complex system collapses into a simple kinetic scheme of 3 consecutive macroscopic one‐ electron transfer steps (figure 1.4).
Under these conditions the electrons equilibrate inside the molecule, according to the relative reduction potentials of the hemes, before the next reduction step meaning that the distribution of electrons inside the molecule is thermodynamically controlled within each redox stage. kI, kII
and kIII are the macroscopic rate constants of each step, which
are the values that define the shape of the kinetic trace (Correia et al. 2002). These macroscopic rate constants are a weighted average of the microscopic rate constants of all the microsteps in each stage.
The Marcus theory for one‐electron transfer (Marcus & Sutin 1985) can establish the relation between the rate constants of each heme in different microsteps (Catarino & Turner 2001). The rate constant of each microstep depends on the structural factors, on the reorganizational energy (λ) and on the thermodynamic driving force. The driving force is defined by the difference between the reduction potential of the donor and acceptor, which may vary between microsteps due to intrinsic differences in the microscopic reduction potentials of the centers. The kinetic model (Catarino & Turner 2001) considers that the reorganisation energy and the reference rate constant do not change during the electron transfer process. Thereafter, the product of the reference rate constant intrinsic to each heme and an exponential factor gives the rate constant of a particular microstep, kij, according to equation 1.2 derived from Marcus theory (Marcus & Sutin 1985): Equation 1.2 – Kinetic model based on Marcus equation.
This exponential factor accounts for the driving force associated with the electron transfer in each microstep, being eij
the reduction potential of centre i for each microstep, and eA the
reduction potential of electron acceptor.
In the present work, several different redox partners were prepared and the corresponding reduction potentials (eA = E0) were determined. The reorganization energy used was 1eV
(Christensen et al. 1994). Both eA and λ are assumed to be
constant during the reduction process. This way, the rate constants were assumed to be modulated only by the ΔGi (the
driving force between each center of the protein and the redox partner) and by the reference rate constant, which was determined for each redox center.
The kinetic model has already been applied for the reduction of triheme cytochrome c7 (Correia et al. 2002) and of
several tetraheme cytochrome c3 (Catarino & Turner 2001,
Paquete et al. 2007) with sodium dithionite.
The present work reports for the first time, the application of the kinetic model for the oxidation of cytochromes, indicating that this model enables the analysis of kinetic properties of systems under thermodynamic control.
1.3 Biorganometallics
Organometallic chemistry and biochemistry have been merged in the last two decades into a new field: biorganometallic chemistry (van Staveren & Metzler‐Nolte 2004). To study the oxidation behaviour of cytochrome c3 and c7 it is of interest to analyse how the electron transfer occurs
organometallic compounds, which may have the capability to interact with biomolecules and perform one‐electron transfer reactions at different reduction potentials. Ferrocenes and cobalt complexes present these abilities (van Staveren & Metzler‐Nolte 2004) (Bailar 1946).
1.3.1 Ferrocenes
The discovery of ferrocene and elucidation of its remarkable structure has been proposed to mark the starting point for modern organometallic chemistry (Stepnicka 2008). The stability of the ferrocenyl group, the accessibility of a large variety of derivatives, and its favourable electrochemical properties have made ferrocene and its derivatives very popular molecules for biological applications with biomolecules (van Staveren & Metzler‐Nolte 2004). Iron undergoes a reversible one‐electron reduction from Fe(III) to Fe(II). The ferrocenyl group [Fe(η5‐C5H4)(η5‐C5H5)] is herein denoted as Fc
and ferrocene [Fe(η5‐C5H5)2] as FcH.
Ferrocene is a neutral molecule and is soluble in many common organic solvents. Ferrocene features a reversible one‐ electron oxidation and in conjugation with the stability of the corresponding ferrocenium salts, ferrocene/ferrocenium is a very stable redox pair (Togni et al. 1995). The reduction potential for the ferrocene/ferrocenium couple depends on the solvent used and is Eo = 0.31V vs. saturated calomel electrode
(SCE) in acetonitrile (Long 1998).
played a significant role as a backbone or a substituent in ancillary ligands due to the specific and unique geometries that the ferrocene provides, and its electronic (redox) properties. The possibility of switching the redox state of the ferrocene backbone gives potential access to control the reactivity of the metal center. Ferrocene undergoes facile electrophilic substitution, it is sensitive to oxidation and thus reactions such as halogenation and nitration cannot be used for the synthesis of substituted ferrocenes. In fact, only radical substitution and electrophilic substitution under nonoxidising conditions, borylation, lithiation and mercuration can be used for the formation of substituted ferrocenes (Stepnicka 2008).
The oxidation potential of the ferrocene/ferrocenium couple, changes according to the nature and number of substituents. In general, the potential shift depends on the substituent’s electron‐donating or –accepting power (electrophilicity) (Silva et al. 1994).
1.3.2 Cobalt complexes
Dichlorobis (ethylenediamine) cobalt(III) cation [Co(en)2Cl2]+ is a coordination compound where the cobalt
contains four ligands (two Cl‐ and two “en”). The bonding
between the Co3+ ion and Cl‐ and “en” ligands is via coordinate
covalent bonds arranged octahedrally around the metal center (Pearson & Basolo 1956).
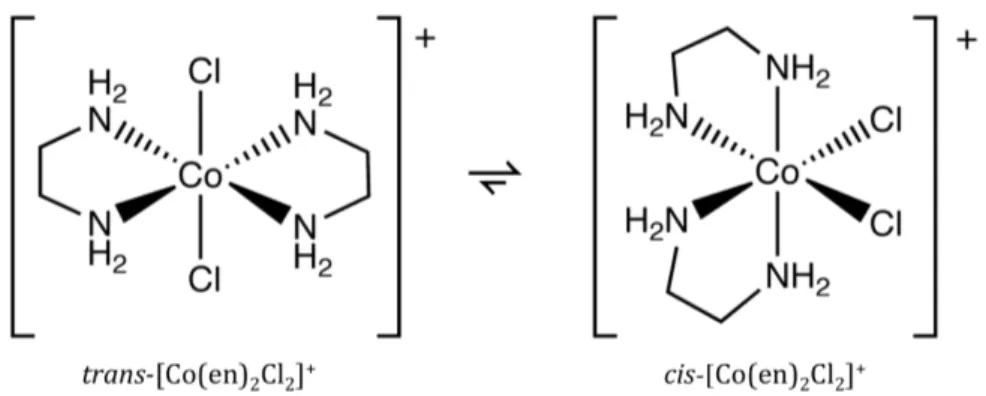
geometric isomers of cobalt complex are possible to form, a cis form and a trans form (figure 1.5).
Figure 1.5 Cistrans isomerisation of Dichlorobis(ethylenediamine)cobalt(III).
The cistrans interconversion was first discovered by Jorgensen cited in (Niederhoffer et al. 1986). Because of the particular splitting of the d‐orbitals of the Co3+ center, the trans
complex is green and the cis complex is purple (Bailar 1946). transdichlorobis(ethylenediamine)cobalt(III) changes to the cis form on heating in water (Haworth et al. 1955). The presence of acid, however, causes the reverse change to take place (Bailar 1936).
Recently, spectroscopic and electrochemical studies have been performed, showing that the cis and trans complexes presents similar electrochemical characteristics (Vivier et al. 2006).
In this work the two isomers cis and trans of the coordination compound [Co(en)2Cl2]+ will be synthesized.
2 Materials and Methods
2.1 Source of organisms The type strain Desulfuromonas acetoxidans (DSM 684) was purchased from German Collection of Microorganisms and Cell Cultures (DSMZ), Braunchweig, Germany. 2.2 Cell cultivationStandard anaerobic techniques were used during all the procedures involving bacterial growth (Hungate 1969, Miller & Wolin 1974, Fonseca 2007).
2.2.1 Growth of Stock cultures
To prepare laboratory stock cultures, cells were first cultivated using a modified medium for D. acetoxidans described in the Catalogue of Strains of the DSMZ (http://www.dsmz.de/microorganisms/html/strains/strain.ds m000684.html). The medium composition per litre of distilled water, was as follows: NH4Cl, 20.0g; Na2SO4, 0.3g; MgSO4.7H2O,
1.0g; MgCl2.6H2O, 2.0g; KH2PO4, 1.0g; NaCl, 1.77g; CaCl2.2H2O,
0,1g (all from Fluka); Trace element solution SL‐4, 10.0ml [EDTA, 0.500g; FeSO4.7H2O, 0.200g; ZnSO4.7H2O, 0.010g;
MnCl2.4H2O, 0.003g; H3BO3, 0.030g; CoCl2.6H2O, 0.020g;
(all from Fluka) and Distilled water, 1000ml]. As terminal electron acceptor, disodium fumarate (Fluka) was used and added to the medium to obtain a final concentration of 30mM. In order to remove dissolved oxygen, the media were boiled and cooled down to room temperature under nitrogen atmosphere, for approximately 90min and capped with a thick rubber stopper before autoclaving. Separately, the following supplements were made and added to the deoxygenated and sterilized medium (per litre): 20 µg/ml biotin (Fluka), 1.0 ml; 4.0M HCl (Pronalab), 1.0ml; absolute ethanol (Panreac), 1.0 ml; 0.80M NaHCO3 (Sigma), 60.0 ml; 0.07M Na2.9H2O (Sigma), 20.0
ml. The NaHCO3 and Na2S.9H2O supplements were
deoxygenating for about 90min and then sterilized by autoclaving at 121ºC during 30min. 4.0M HCl was added to obtain a final pH of 7.2.
Cellular growth was initiated with 20% inocula. The cells were grown in the dark, without stirring, at 30ºC for 24 hours. The cultures were stored at 4ºC for later use in growth, and at ‐ 80ºC after addition of glycerol (10%) to the culture for long‐ term preservation. 2.2.2 Cellular growth using Fumarate as the terminal electron acceptor In a procedure similar to that used for the preparation of stock cultures, fumarate was used as terminal electron acceptor
during the initial steps of scale‐up. Ethanol was used as carbon source and as electron donor.
2.2.3 Cellular growth using Sulphur as the terminal electron acceptor
At the last step of each scale‐up the terminal electron acceptor used was elemental Sulphur (Fluka) instead of Fumarate, to a final concentration of 60mM (2 grams per litre of medium). For the medium containing elemental sulphur the autoclaving conditions were changed to 110 oC during 60 min to
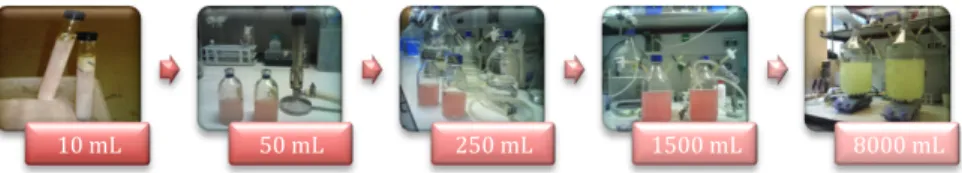
avoid melting of the sulphur. In this case the deoxygenation of the media was performed after autoclaving, under nitrogen flow during 120min, using a connection into the bioreactor (10.0l). The carbon source and electron donor was ethanol. Bacterial growth was initiated with the previous 1500ml basal medium fumarate/ethanol matching a 20% inoculum volume. The cells were grown for 48 hours at 30º C in the dark without stirring in a procedure similar to the previous steps. 2.2.4 Large scale cell cultivation In order to obtain sufficient biomass for the purification of proteins, large‐scale growth batches of D. acetoxidans DSM 684 were performed. Scale‐up was performed using the media and conditions previously described.
Large‐scale growth batches of 16 litres (2 x 8 litres simultaneously) were run until the culture reached roughly the
late‐log stage of growth (OD = 0.8). To avoid the catabolic turn off and degradation of terminal reductases, bacterial growth was always stopped before it entered the stationary phase i.e. after each 24 hours/batch (Fumarate as terminal electron acceptor) and 48 hours/batch (Sulphur as terminal electron acceptor) (Fonseca 2007). 2.3 Protein Purification 2.3.1 Cell harvest and disruption Prior to cell harvest, the precipitates in the culture owing to unreacted elemental sulphur were removed through decantation. Decanted cells were harvest by centrifugation at 11300 g for 15 min at 4 0C (Beckman J2‐21M/E centrifuge). The
biomass obtained from all growths was collected, washed with 10mM Tris‐HCl (pH7.6) buffer and centrifuged at 11300 g for 15 min at 4 0C.
Prior to cellular lysis, the cellular pellet was resuspended in 10mM Tris‐HCl (pH7.6) buffer containing deoxyribonulease (Sigma) and a tablet of protease inhibitors cocktail (Sigma). Cellular lysis was performed in a French Press (three times at 1000 Psi) (Termo Scientific®) using a fast‐flow anaerobic kit
(figure 2.1). The disrupted cell lysate was collected and maintained at 4ºC.
Figure 2.1 – FrenchPress equipment in use with fastflow anaerobic kit assembled
2.3.2 Separation of soluble from membrane fractions
The collected cell lysate was centrifuged at 11300 g for 15 min at 4 0C) and the supernatant (crude extract) retained.
The supernatant was then ultracentrifuged at 22000 g for 90 min at 4 0C (Beckman Coulter Optima™ LE‐80K Ultracentrifuge)
to separate the soluble protein fraction from the membrane fraction. The pellet (membrane fraction) was stored for future work, and the supernatant (soluble fraction) was dialysed against 20mM Tris‐HCl pH 7.6 buffer at 4ºC overnight.
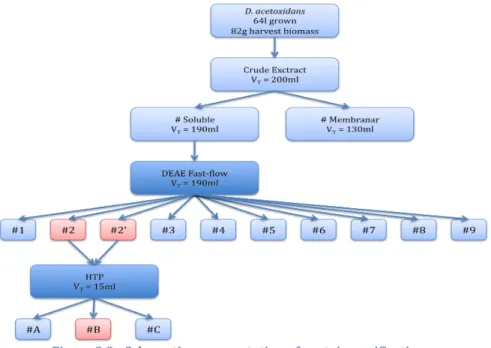
2.3.3 Protein purification
After dialysis, the soluble fraction was fractionated on a DEAE Sepharose Fast‐Flow anion exchange column (Amersham Pharmacia Biotech®) equilibrated with 20mM Tris‐NaCl buffer
unabsorbed proteins and eluted with a linear gradient of 0‐1M NaCl in 20mM Tris‐HCl buffer pH 7.6 at a flow rate of 6ml/min. Red fractions were concentrated by ultrafiltration on an Amicon® diaflo with a cut‐off membrane of 3000 Dalton
(Millipore®). Those containing a 9kDa band with purity index
(A409/A280) greater than 1.0 were pooled, dialyzed against
20mM Phosphate (pH 7.6) buffer and the desalted solution was centrifuged at 15000g for 20 min at 4 0C. The resulting sample
(approximately 15ml) was loaded on a HTP column (Amersham Pharmacia Biotech®) previously equilibrated with 20mM
Phosphate pH 7.6 and eluted with a linear gradient of 0‐1M Phosphate buffer pH 7.6 at a flow rate of 3ml/min. Previous work shows that the cytochrome c7 tends to precipitate slowly when stored frozen in 10mM Tris buffer (Probst et al. 1977). To prevent this, it was used 100mM Tris buffer (pH7.6). Fractions were checked for purity by SDS‐PAGE, UV‐Visible spectroscopy and NMR spectroscopy. 2.3.4 UV‐Visible spectroscopy
The absorption and emission of electromagnetic radiation of specific energy (wavelength) is a characteristic feature of many molecules, as a consequence of the promotion of electrons to excited electronic states, in accordance with the laws of quantum mechanics.
UV‐Visible spectrophotometry is a useful technique for identification of metalloproteins. It is based on two fundamental principles were the absorption of light is exponentially related:
to the solute concentration I and to the length of the light path through the absorbing solution (l). The absorbance (A) is a logarithmic relation between the intensity of incident light (I0)
and the emergent light (I), represented in the Beer‐Lambert relationship where ε is a constant absorption coefficient of the solute:
Equation 2.1 BeerLambert law.
The known absorption characteristics of heme‐proteins allow the identification of type of heme, the spin and the oxidation state through characteristic bands represent on the visible spectra.
Cytochromes have UV‐visible spectra with three characteristic bands, α and β bands between 600‐500nm and the Soret band between 430‐390 nm. The distinctive wavelengths for each of these bands can be used to classify the present cytochrome (Moore & Pettigrew 1990).
A broad band between 600‐500 nm, and a Soret band between 430‐390 nm characterize the oxidized state of cytochromes. In the reduced form the Soret band is shifted to higher wavelengths and the α and β band become sharper (Catarino 1998).
2.3.5 NMR spectroscopy
Nuclear magnetic resonance spectroscopy is based on differences in energy of the magnetic states of atomic nuclei, placed in an external magnetic field. The effective field at the nucleus is the difference between the magnetic field (B0) and its
product by shielding constant (σ). The shielding constant (σ) expresses the contribution of the small secondary field generated by the nearby electrons in the molecule. The magnitude of σ depends on the electronic environment of a nucleus, so nuclei of the same isotope give rise to small different resonance frequencies. The separation of resonance frequencies resulting from the different electronic environments of the nucleus of the isotope is called the chemical shift (δ) (Levitt 2001).
In frequency units the chemical shift is proportional to the applied static magnetic field, and therefore chemical shifts are customarily quoted in parts per million (ppm) units expressed against an internal standard (Wuthrich 1986).
2.3.5.1 Sample preparation
The sample used for NMR studies was dialyzed against twice‐distilled water and then lyophilized three times in 99.9% D2O to reduce the water signal and to exchange the labile
protons. The NMR tubes were prepared under aerobic conditions and, consequently, the samples were obtained in the
oxidized form, since the hemes have very low reduction potentials.
2.3.5.2 NMR spectroscopy
One‐dimensional 1H‐NMR spectra were acquired on a
Bruker AMX‐300 spectrometer (magnetic field strength 7.058 T, 300 MHz for proton resonance frequency). 256 scans were done, the spectral width was 240Hz and the data was smoothed with a exponential window function with a line broadening (LB) of 10Hz. The temperature of the sample was kept at 303 ± 1.0 K. 2.4 Ferrocenium sample preparation For kinetic experiments ferrocenium cations were required as oxidant agents. Mono‐substituted ferrocenia were prepared by one‐electron oxidation of each mono‐substituted ferrocenes. Ferrocene monocarboxylic acid, ferrocenylacetic acid and α‐ hydroxyethyl ferrocene were purchased from Strem®.
Ferrocenylethanol was synthesized following a modified method (described on section 2.4.1) from Davis and colleagues (2005) and recrystallized as described by Rinehart and colleagues (1957).
Ferrocenes are insoluble in protic solvents and soluble in most organic solvents (Stepnicka 2008). For experimental tests, ferrocene had to be prepared in the same aqueous solution used on thermodynamic and kinetic studies of cytochrome c7
reported in the literature (Correia et al. 2002). Stock solutions of 10mM of each ferrocene were prepared by initial dilution on 200.0µl of absolute ethanol to a final volume of 1.0ml of tris‐ maleate buffer at pH 6.0, 7.0 and 8.0.
2.4.1 Ferrocene synthesis: 2‐Ferrocenylethanol
The synthesis of 2‐ferrocenylethanol was achieved by the reduction of 2‐ferrocenylacetic acid using LiAlH4 as a
reducing agent. A Schlenk flask with LiAlH4 was carefully
connected to a flask under nitrogen pressure, and sufficient LiAlH4 to ensure excess of reducing agent was added (318.0mg,
8.3mmol) and suspended in dry ether (15.0cm3).
Ferrocenylacetic acid (250.0mg, 1.0mmol) in dry ether (5.0cm3)
was slowly added (drop by drop) to the LiAlH4 suspension
while slight boiling was maintained (Davis et al. 2005).
LiAlH4 is a dangerous reagent that violently reacts with water including atmospheric moisture. The mixture was refluxed for 13 h at 50.0 ºC with two overnight breaks (2 hours + 8 hours + 2 hours) just maintaining the stirring.
Subsequently an 1:1 ethanol:ether mixture (10cm3) was
very carefully added to destroy the excess LiAlH4. The reaction
mixture was slowly poured into excess of ice‐cold 2 M NaOH solution (150.0cm3) and the ether and aqueous phases
separated. The aqueous phase was washed with ether after which the ether fraction was washed with 1 M NaOH (50.0cm3)
and twice with equal volumes of water. This procedure dissolves the remaining COOH and solubilises Al+3 and Li+1 with
hydroxyls that will be in water phase. In order to dry the ether layer, MgSO4 was added and the solvent removed under
reduced pressure. The solution was dried on a rotary evaporator (Davis et al. 2005).
To improve the purity of the product, recrystallization was performed. A mixture of ether‐pentane (both with a 36 0C
boiling point) was used to dissolve the remaining residues, and ferrocenylethanol recrystallized in ether. The flask was cooled on a freezer (‐20 0C) for 2 hours. (Rinehart Jr et al. 1957)
2.4.2 NMR Spectroscopy of ferrocenes
NMR analyses of ferrocenylethanol and its precursor ferrocenylacetic acid were performed on a Bruker Avance III 400 NMR spectrometer using CDCl3 as solvent.
2.4.3 Ferrocene oxidation
To perform a one‐electron oxidation of cytochrome c7,
ferrocene mediators had to be oxidized previously to respective ferrocenium derivatives. To avoid the presence of unwanted
chemical substances, oxidation was performed
electrochemically with a potentiostat (Autolab® PSTAT10)
achieving equal spectra as chemical oxidation. A potential above the Eo1/2 of each ferrocene was imposed until a complete oxidation state was achieved. The oxidation procedure was followed by amperometry, which measures the intensity of the current, which becomes near zero after complete oxidation of ferrocenes.
2.4.4 Voltammetry studies
Evaluation of standard electrode potentials of ferrocenes performed by different workgroups should be taken with the appropriate care because each group mentions their reduction potential versus different reference electrodes. IUPAC recommends the use the FcH/FcH+ couple as an internal
standard (Ives et al. 1961). Herein, aqueous solutions will be used for all kinetic experiments, an hence standard electrode potentials will be reported versus the conventional reference electrode standard hydrogen electrode (SHE). In practical laboratory measurements, a secondary reference electrode is used, a reference whose potential vs SHE (aq) is well known, +0.241 for the (KCl) saturated calomel electrode (SCE), +0.197 for the saturated silver/silver chloride electrode, +0.209 for 3M NaCl silver/silver chloride electrode, all at 25 0C (Ives et al.
1961) (Zoski 2007).
Cyclic voltammetry was performed using an Autolab®
PSTAT10 electrochemical analyser. A three‐electrode configuration was used in a cuvette‐cell, specially designed to work with a micro magnetic stirrer. A platinum wire was used as the counter electrode and the reference electrode was a standard Ag+/AgCl electrode. Scan rates between 50 and
150mV/s were tested to identify the best conditions for each ferrocene. Data were collected at room temperature before and after the oxidation procedure.
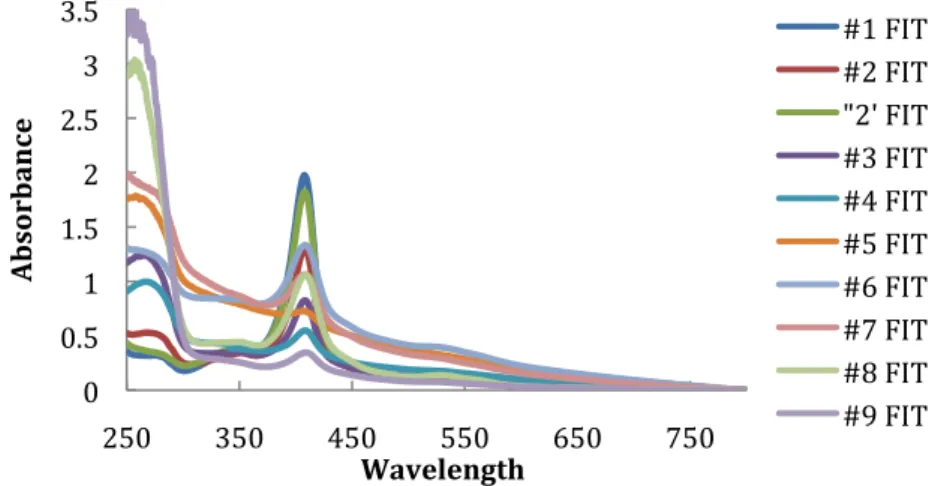
2.4.5 UV‐Visible spectroscopy
The reduced and oxidized state of each ferrocene was checked by UV/Visible spectroscopy. The different spectra allow the characterization of ferrocene oxidation state. All spectrometry experiments were performed on a Shimadzu UV‐ 3100 spectrophotometer. 2.5 Sample preparation of Cobalt complexes 2.5.1 Trans‐dichlrobis(ethylenediamine)cobalt(III) The trans‐dichlorobis(ethylenediamine)cobalt(III) trans [Co(en)2Cl2]+ was prepared as described by Bailar (Bailar 1953) at room temperature.
A glass beaker large enough to contain a 100ml Erlenmeyer flask was used as water bath on a hot plate. The water bath was heated just below the boiling point (with addition of additional water to the bath as needed, to account for evaporation). A 10ml portion of MilliQ water (Millipore) was added to 4 g of CoCl2.6H2O. After dissolution 15ml of a 10%
solution of ethylenediamine was added to the mixture. The mixture was stirred over the steam bath during 40 minutes, maintaining the bath volume by adding small volumes of water. During this process, the Co2+is oxidized to Co3+ by the oxygen in
the air and the ethylenediamine ligands are coordinating to the metal (Bailar 1953). Good stirring is necessary to promote solvation of the oxygen.
added maintaining the heating and stirring, without addition of water, until a thin slurry of crystals has formed. The slurry was cooled to room temperature stirring occasionally for 15 minutes. The mixture was filtered and washed with 5mL of 6M HCl obtaining a pure green product. The final product was dryed and weighted.
2.5.2 Cis‐dichlrobis(ethylenediamine)cobalt(III)
The cis‐[Co(en)2Cl2]+ was synthesized from the trans
[Co(en)2Cl2]+ compound (Haworth et al. 1955). A 50mg portion
of trans‐[Co(en)2Cl2]+ complex was dissolved in 20ml of distilled
water and gently evaporated while the solution was heated at 100ºC. This procedure was repeated three times. The residual product was then mixed with very cold water (Vivier et al. 2006).
2.5.3 Voltammetry studies
Cyclic voltammetry was performed as described on section 2.4.4.
2.5.4 UV‐Visible spectroscopy
UV‐visible spectroscopy was followed as described on section 2.4.5.
2.6 Kinetic Studies
Kinetic reactions between the cytochrome c7 and all the
ferrocenium cations were followed by stopped‐flow assay using HI‐TECH Scientific® Stopped‐Flow equipment (SF‐61DX2),
working on single mix mode. The Stopped‐flow equipment works inside an anaerobic glove‐box (Mbraun MB150‐GI) (figure 2.2). The data were acquired using a wavelength of 552nm, and 512 points per second were registered ensuring accuracy in the measurement of fast kinetic reactions. The data collected were analysed with HI‐TECH Scientific Kinetic Studio. Figure 2.2 – Stoppedflow equipment. For light calibration, the input Xenon light intensity (As LPU 150 Xenon lamp) was set according to a standard operating procedure defined by the manufacturer. 2.6.1 Circuit washing
The SAMPLE HANDLING UNIT circuit is coated with Teflon and because of its permeability to oxygen and dithionite,
all the circuit has to be washed according to a standard operating procedure defined by the manufacturer. Prior to each experiment the circuit was washed using a 2M solution of H2SO4 during 15 minutes followed by a 4M solution of NaOH during 15 minutes and finally washed abundantly with distilled water. 2.6.2 Circuit refill procedure The volume of the stop syringe was set up to 100µL and the circuit has a volume near 40µL. To make sure that all the circuit of the SAMPLE HANDLING UNIT was filled with the corrected solutions, it was necessary to make at least three single shots before data acquisition.
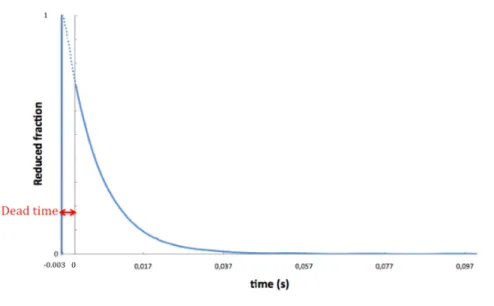
2.6.3 Dead time calculation
In kinetic studies by the method of stopped‐flow, the dead time (td) of the instrument is the time between the end of
mixing the two solutions and the beginning of observation of the kinetics of the reaction.
Calculation of td is crucial to know the performance of
the stopped‐flow instrument and it depends on the distance between the mixer and the cell, the final velocity of the flow at the instant the flow is stopped, the efficiency of the mixer and the viscosity of solutions.
Td was calculated through the 2,6‐
dichlorophenolindophenol reduction with L‐ascorbic acid (Matsumura et al. 1990), studying this first‐order reaction in which the concentration of a coloured solution of (DCPIP) falls
to zero after mixing with a decolorizing solution (Ascorbic Acid). The transmission of light was calibrated with distilled water and the wavelength was set to 524nm. Table 2.1 lists the solutions used.
Table 2.1 – Ascorbic acid versus DCPIP solution preparation
Solution Preparation
A 0.2mM DCPIP 6 mg DCPIP / 50 ml H2O
B6 100mM Ascorbic acid, 20mM HCl 500mg Ascorbic acid/25ml C B5 50mM Ascorbic acid, 20mM HCl 5 ml B6 + 5 ml C B4 20mM Ascorbic acid, 20mM HCl 2 ml B6 + 8 ml C B3 10mM Ascorbic acid, 20mM HCl 1 ml B6 + 9 ml C B2 5mM Ascorbic acid, 20mM HCl 0.5 ml B6 + 9.5 ml C B1 1mM Ascorbic acid, 20mM HCl 0.1 ml B6 + 9.9 ml C C 20mM HCl 331.2µL HCl 37%/200ml H2O
Syringes were first filled with solutions A and C and a sequence of three single shots were done, to acquire the absorbance value of DCPIP. Subsequently, solution C was replaced with solutions B1 to B6 making three single shots in
each assay. Between each experiment, the refill and shot procedure was done as described on 2.6.2, ensuring a complete exchange of solutions on the Stopped‐flow circuit. The acquisition time was adjusted to 0.1 seconds. The data collected were treated converting the absorption values into reduced fraction. Figure 2.3 gives an example of a kinetic trace taken with the stopped‐flow instrument.
Figure 2.3 – Cartoon of dead time determination.
The first milliseconds in which the reaction returns no measurable data represented in figure 2.3 are the dead time.
2.6.4 Experimental assay
The traces were acquired at 552nm and the temperature maintained at 289.0 ± 1.0K, the same conditions used in the study for the thermodynamic and reduction kinetics of cytochrome c7 (Correia et al. 2002). Stock solutions of buffers
were prepared inside the anaerobic glove box with a final concentration of 100mM Tris‐maleate, 400mM KCl at pH 6.0, 7.0 and 8.0.
2.6.4.1 Light calibration and circuit refill
The transmission of light was calibrated with 100mM Tris‐maleate at pH 6.0, 7.0 and 8.0 with ionic strength set to 500mM trough addiction of KCl.