Stress distribution in the cervical region
of an upper central incisor in a 3D finite
element model
Abstract: The aim of this study was to evaluate the stress distribution in the cervical region of a sound upper central incisor in two clinical situations, standard and maximum masticatory forces, by means of a 3D model with the highest possible level of idelity to the anatomic dimensions. Two models with 331,887 linear tetrahedral elements that represent a sound upper central incisor with periodontal ligament, cortical and trabecular bones were loaded at 45o in relation to the tooth’s long axis. All structures were considered to be homogeneous and isotropic, with the exception of the enamel (anisotropic). A standard masticatory force (100 N) was simulated on one of the models, while on the other one a maximum masticatory force was simulated (235.9 N). The software used were: PATRAN for pre- and post-processing and Nastran for processing. In the cementoenamel junction area, tensile forces reached 14.7 MPa in the 100 N model, and 40.2 MPa in the 235.9 N model, exceeding the enamel’s tensile strength (16.7 MPa). The fact that the stress concentration in the amelodentinal junction exceeded the enamel’s tensile strength under simulated conditions of maximum masticatory force suggests the possibility of the occurrence of non-carious cervical lesions such as abfractions.
Descriptors: Tooth injuries; Tomography; Methods; Imaging, three-dimensional; Computing methodologies.
Isis Andréa Venturini Pola Poiate(a)
Adalberto Bastos de Vasconcellos(b)
Edgard Poiate Junior(c)
Kátia Regina Hostílio Cervantes Dias(d)
(a) Postdoctoral Student, Department of
General Physics, Physics Institute, University of São Paulo, São Paulo, SP, Brazil.
(b) Adjunct Professor, Department of Operative
Dentistry, School of Dentistry, Fluminense Federal University, Nova Friburgo, RJ, Brazil.
(c) PhD Student, Department of Mining and
Petroleum Engineering, Polytechnic School of Engineering, University of São Paulo, São Paulo, SP, Brazil.
(d) Adjunct Professor, Department of Dental
Clinic, School of Dentistry, State University of Rio de Janeiro, Rio de Janeiro, RJ, Brazil.
Corresponding author:
Isis Andréa Venturini Pola Poiate Rua Joaquim Antunes, 1049, apto. 133, Pinheiros
São Paulo - SP - Brazil CEP: 05415-012
E-mail: [email protected]
Introduction
A number of theories have arisen to explain the etiology of non-carious cervical lesions (NCCL), yet, the real causes remain obscure, as is relected by the contradictory terminology used in literature.
Acidic and abrasive processes have been docu-mented as etiological factors,1 but the role of me-chanical stress from occlusal loads is the most accepted theory,2,3 explaining abfraction as a conse-quence of tooth delection caused by excessive occlu-sal forces. During tooth delection, tensile and com-pression forces are generated in the cervical region of the tooth, causing rupture of the union between hydroxyapatite crystals, leading to the formation of a crack and eventually to enamel loss.1,4
The presence of high stress on the enamel adja-cent to the cementoenamel junction (CEJ) may be explained by the fact that this is the region where enamel is the thinnest, by the arrangement of amor-phic enamel prisms in this area, and by the weak union between enamel and dentine in the cervical area.5
A variety of different methods have been applied in an attempt to comprehend the characteristics of the stress distribution in teeth and their anatomic support structures. Photoelasticity was used as a qualitative method but it presents too many dif-iculties in the quantitative analysis of stress, and also this method doesn’t deine which type of stress is generated.6
The Finite Element (FE) Method is the most ap-propriate for evaluating stress distribution due to its ability to quantitatively analyze stress and execute parametric studies where each factor that is repre-sented mathematically, such as physical and me-chanical conditions, can be rapidly modiied and the distribution of the resulting stress can be inves-tigated.7
Even though the biomechanical process related to the formation of NCCL is still not fully under-stood, a common theme seems to be the presence of high occlusal force causing tooth lexion. This work aimed at evaluating the stress distribution in the cer-vical region of a sound upper central incisor in two clinical situations: maximum intercuspation simu-lating standard and maximum masticatory forces.
Materials and Methods
Computerized tomography (CT) image acquisi-tion in DICOM (Digital Imaging Communicaacquisi-tions in Medicine) format was performed with a GE HiS-peed NX/i CT scanner (HiSHiS-peed NX/I, General Ele-tric, Denver, CO, USA) using several physical and geometrical parameters within safety limits (Ethics in Research Committee, Antonio Pedro University Hospital, Fluminense Federal University, protocol no.213/05). The parameters that yielded the best re-sults with respect to image quality were 120 kV, 150 mA, 512 x 512 matrix, ield of view 14 x 14 cm and slice thickness of 0.5 mm.
Initially, the CT images, 165 sections along the patient’s axial axis and 123 sections along the coro-nal axis, anteroposterior direction, were imported into the program Mimics/MedCAD 8.0 (Materi-alise, Leuven, Belgium).
From this point, segmentation was started. Seg-mentation is a process that consists in separating an object of interest from other adjacent anatomi-cal structures in different groups or masks, such as enamel, dentine, pulp, cortical and spongious bone (Figure 1), according to their radiodensities ex-pressed in Hounsield units.
In the pre-processing stage, a mathematical mod-el of the object or structure being studied is gener-ated by a CAD/CAE program. This geometry is dis-cretized during the FE model generation.
Figure 1 shows the isocurves, with a spacing of 0.5 mm, of pulp, enamel and dentine of the maxil-lary teeth. The upper central right incisor was de-ined as the model for this analysis, with the cre-ation of a periodontal ligament with a thickness8 of 0.25 mm from the dentine isocurves due to the im-possibility to deine this structure from CT images, since the pixel size was 0.273 mm. The isocurves of the cortical and spongious bones were also export-ed, with their thickness being deined as 10 mm, and whose extremities correspond to the position-ing of the central right and left upper incisors.After the generation of a surface mesh for every structure, a volumetric mesh with tetrahedral elements was generated in a Pentium 4, 3.2 GHz computer with 2.0 GB RAM memory.
excep-tion of the enamel, assumed an isotropic, homoge-neous, and linearly elastic behavior, characterized by two physical properties (Table 1): Young Mod-ulus (E) and Poisson Coeficient (ν). The interfaces between the structures were presumed to be perfect-ly united.
The nasal layer of the incisor was taken into ac-count in every model. However, since the model represents only the upper central incisor, “springs”
with ixed ends were introduced on the nodes at the mesial and distal extremities of the cortical and spongious bones. The purpose of these springs is to represent the rigidity of the remaining structures, thus reproducing reactions generated by the remain-ing structure.7
To determine the exact location of the force ap-plication, the occlusal contact points of the anterior teeth of a volunteer in maximal habitual intercuspa-tion posiintercuspa-tion were marked with carbon paper. The application area (0.6 x 1.2 mm) was determined by a digital photographic image of the occlusal contact of the upper central incisor of the volunteer in the anterior region. It then had its coordinates mapped by a program speciically developed by the authors to digitize the data into bitmaps.
In the present study, an occlusal loading, equally divided among 12 nodes, was used. A 100 N load applied to the upper central incisor is the most used in FE analysis in several areas of dentistry, with this value being chosen by a large number of research-ers.13-16 The load intensity of 235.9 N was used based on the study by Ferrario et al.17 (2004), who deter-mined the average force value of maximum bite on a central incisor to be 146.17 N. Applying the uncer-tainty analysis in the study, with a 95% conidence interval (± 88.73), the highest limit is the value of 235.9 N. Both loads were applied on the palatine as-pect of the tooth, right above the cingulum, at a 45° angle with the long axis of the tooth.
The processing stage or solution analysis was performed with the program MSC/NASTRAN 2005 (MSC.Software Corporation, Santa Ana, CA, USA). The program MSC/PATRAN 2005 (MSC. Software Corporation, Santa Ana, CA, USA), used Table 1 - Mechanical Properties, number of nodes and number of elements in each one of the anatomical structures.
Anatomical Structures Young Modulus (GPa) Poisson’s Ratio References Nodes Elements
Pulp 0.02 0.45 Farah, Craig9 (1974) 4103 22,243
Dentine 18.6 0.31 Ko et al.10 (1992) 17737 131,156
Enamel (anisotropic) Ex = 80.0; Ez = Ey = 20.0 0.30 Rees, Hammadeh11 (2004) 2309 21,267
Periodontal Ligament 0.0689 0.45 Weinstein et al.12 (1980) 206 17,276
Spongious Bone 1.37 0.30 Ko et al.10 (1992) 13812 107,293
Cortical Bone 13.7 0.30 Ko et al.10 (1992) 5767 32,652
Figure 1 - The isocurves of pulp, enamel and dentine imported into Patran
(A) and finite element
model (B).
A
Figure 3 - Panoramic views of the compressive and tensile stress in buccal view and lingual view (100 N load).
–56.8 14.7
in the pre-processing, was also utilized in the post-processing for the visualization and evaluation of the results.
Results
In this study, the von Mises criterion was ap-plied and the tensile and compressive stress distri-bution was evaluated. Table 2 shows the tensile and
Anatomical Structures
Tensile Strength (MPa)
Compressive
Strength (MPa) References
Pulp 2.94 2.94 Tanaka et al.18 (2003)
Dentine 103 / 105.5 282 / 297 Tanaka et al.18 (2003) / O’Brien19 (1996)
Enamel 16.7 / 10.3 321 / 384 Tanaka et al.18 (2003) / O’Brien19 (1996)
Bone 123 167 Tanaka et al.18 (2003)
Table 2 - Tensile and compressive strength and references.
Figure 2 - Panoramic views of the von Mises stress in buccal view and lingual view (100 N load).
compressive strength of the structures analyzed, as available in literature, and will serve as a reference for comparison of the results obtained in the pres-ent study.
A panoramic view of the results of the von Mises stress under a 100 N load is presented in Figure 2. It can be observed that the greatest von Mises stress
values are located at the points of load application, a very punctual and well-located site of stress con-centration.
A panoramic view of the results of the compres-sion and tensile stress under a 100 N load can be seen in Figure 3. It is interesting to observe that there is a greater stress concentration in the cervical region of the palatal enamel, in the form of a strip, from mesial to distal.
Thus, after observing the results on the model that simulates a standard masticatory force, it was possible to notice that the compression stress was distributed throughout the buccal surface, while the tensile stress was spread on the palatal surface, in-variably, and that there was a point of compressive stress concentration in the apical region of the root.
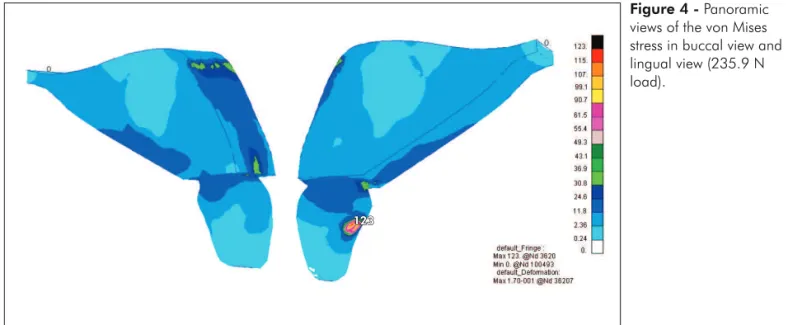
A panoramic view of the results of the von Mises stress under a load of 235.9 N is presented in Fig-ure 4. The highest von Mises stress values were found under the load application points, forming a decreasing gradient of stress values in the direction of the occlusal loading points up to the trabecular bone.
In Figure 5, the enamel-dentine interface at the CEJ is easier to observe with the aid of compression and tensile stress vectors. From a distal view, it is possible to clearly visualize the tensile stress with a peak of 40.2 MPa on the palatal surface, exceeding the enamel’s tensile strength, which is 16.7 MPa.
Figure 4 - Panoramic views of the von Mises stress in buccal view and lingual view (235.9 N load).
123
Figure 5 - Compression and tensile stress vectors at the enamel-dentine interface throughout the CEJ (235.9 N load).
Discussion
The conducting of studies that simulate the be-havior of oral structures entails a very complex analysis due to the characteristics of the elements that constitute the stomatognathic system. These studies involve the application of forces that simu-late mastication, for instance, with photoelasticity, strain gauges, and FE analysis.
Photoelasticity was used as a qualitative method, but it presents too many dificulties in the quanti-tative analysis of stress. Furthermore, this method doesn’t deine which type of stress is generated.6
Strain gauges are the most widely used transduc-er in exptransduc-erimental mechanics to evaluate strain at a point in engineering structures. There are, however, certain limitations. For instance, they have to be isolated from saliva and blood to prevent short cir-cuits and, in order to measure strain correctly, must be irmly stuck to the surface of the material under examination. Furthermore, they can only measure strain at one point and in one direction.20
The FE analysis is widely used in dental re-search. There are a few limitations to 2D modeling, particularly due to the geometric complexity of the biological structures involved.21 A 2D model cannot accurately represent the clinical reality because of its simpliications which do not take into consider-ation some important biomechanical aspects being studied.5 In contrast, 3D models present advantages such as images of greater and richer detail, the pos-sibility of rotating in space and visualizing internal areas of the models.
Our results with the model that simulates a stan-dard masticatory force are qualitatively equivalent to those of Lewgoy et al.14 (2003) and Albuquerque et al.13 (2003). Our results with the model that simu-lates a maximum masticatory force reveal a tensile stress on the palatal surface that exceeds the enam-el’s tensile strength. These stress proiles, therefore, seem to mimic the pattern of clinical presentation of abfraction lesions. A similar pattern was observed palatally in Palamara et al.16 (2005) and Rees, Ham-madeh11 (2004). The increase in masticatory force did not alter the pattern of stress distribution, but it ampliied the stress intensity.
The decision to represent an upper central
inci-sor was based on evidence from recent studies3,11 which demonstrates that abfraction lesions are most commonly found in upper incisors, followed by pre-molars and canines, the latter being the teeth least commonly affected.
This prevalence may be associated to a reduced area of the periodontal ligament and consequent mo-bility under loading.22 In other words, it may be due to the fact that the ligament area in upper incisors is smaller than that in canines and upper premolars.23 This suggests that incisors are less prepared to with-stand the stress distribution generated by the loads applied during masticatory function.
NCCLs are more frequently found on the buccal or lingual surfaces due to the direction of occlusal or incisal loads, the angling and asymmetry of the tooth’s buccolingual plane, and its relation to the supporting alveolar bone.20
In an upper central incisor, it can be expected that tensile stresses be found in the cervical region on the palatal surface. Oblique traumatic loading on the palatal surface of upper central incisors produc-es dental lexion in the buccal direction, rproduc-esulting in tensile stress upon the enamel in the cervical region. Since the stress concentration at the enamel-dentine interface on the palatal surface exceeds the enamel’s tensile strength, the occurrence of a NCCL may be suggested. For instance, an abfraction may develop, which represents a lesion resulting from enamel mi-crofractures at the cervical region because it is the site of maximum lexion moment and also because it is the region of least enamel thickness, generating a stress concentration.24,25 Studies1,18,26 have demon-strated that this is the main cause of rupture of the union between enamel crystals.
Some studies5,15,16 have used simpliications which interfere with the results, such as consider-ing the enamel to have isotropic characteristics, that is, having an orthogonal prism distribution on the tooth surface. Prism orientation varies throughout the depth of the enamel,27 characterizing the enamel as anisotropic, which is important for stress analy-sis.
References
1. Lee WC, Eakle WS. Possible role of tensile stress in the eti-ology of cervical erosive lesions of teeth. J Prosthet Dent. 1984;52(3):374-80.
2. Kuroe T, Itoh H, Caputo AA, Konuma M. Biomechanics of cervical tooth structure lesions and their restoration. Quintes-sence Int. 2000;31(4):267-74.
3. Rees JS. The role of cuspal flexure in the development of abfraction lesions: a finite element study. Eur J Oral Sci. 1998;106(6):1028-32.
4. McCoy G. The etiology of gingival erosion. J Oral Implantol. 1982;10:361-2.
5. Geramy A, Sharafoddin F. Abfraction: 3D analysis by means of the finite element method. Quintessence Int. 2003;34(7):526-33.
6. Cohen BI, Condos S, Musikant BL, Deutsch AS. Pilot study comparing the photoelastic stress distribution for four endo-dontic post systems. J Oral Rehabil. 1996;23(10):679-85. 7. Bathe KJ. Finite Element Procedures. 1a ed. New Jersey:
Pren-tice Hall; 1996.
8. Lee SY, Huang HM, Lin CY. In vivo and in vitro natural frequency analysis of periodontal conditions, an innovative method. J Periodontol. 2000;71(4):632-40.
9. Farah JW, Craig RG. Finite element stress analysis of a re-stored axisymmetric first molar. J Dent Res. 1974;53(4):859-66.
10. Ko CC, Chu CS, Chung KH, Lee MC. Effects of posts on dentin stress distribution in pulpless teeth. J Prosthet Dent. 1992;68(3):421-7.
11. Rees JS, Hammadeh M. Undermining of enamel as a mech-anism of abfraction lesion formation: a finite element study. Eur J Oral Sci. 2004;112(4):347-52.
12. Weinstein AM, Klawitter JJ, Cook SD. Implant-bone interface characteristics of bioglass dental implants. J Biomed Mater Res. 1980;14(1):23-9.
13. Albuquerque RC, Polleto LT, Fontana RH, Cimini CA. Stress analysis of an upper central incisor restored with different posts. J Oral Rehabil. 2003;30(9):936-43.
14. Lewgoy HR, Youssef MN, Matson MR, Bocangel JA, Netto CA, Amore R. Finite elements study of the Flexi Post and Flexi Flange post systems in a maxillary central incisor. Pesqui Odontol Bras. 2003 Apr-Jun;17(2):132-6. Epub 2003 Oct 10.
Erratum in: Pesqui Odontol Bras. 2003 Jul-Sep;17(3):216. 15. Palamara D, Palamara JEA, Tyas MJ, Messer HH. Strain
pat-terns in cervical enamel of teeth subjected to occlusal loading. Dent Mater. 2000;16(6):412-9.
16. Palamara JEA, Palamara D, Messer HH, Tyas MJ. Tooth morphology and characteristics of non-carious cervical le-sions. J Dent. 2005;34(3):185-94.
17. Ferrario VF, Sforza C, Serrao G, Dellavia C, Tartaglia GM. Single tooth bite forces in healthy young adults. J Oral Reha-bil. 2004;31(1):18-22.
18. Tanaka M, Naito T, Yokota M, Kohno M. Finite element analysis of the possible mechanism of cervical lesion formation by occlusal force. J Oral Rehabil. 2003;30(1):60-7.
19. O’Brien WJ. University of Michigan. NIDR Materials Sci-ence Research Center at the University of Michigan School of Dentistry. Biomaterials Properties Database [homepage on the Internet] [accessed 2005 Dec 25; Revised April, 1996]. Available from: http://www.zubnistranky.cz/intro.html. 20. Asundi A, Kishen A. Advanced digital photoelastic
in-vestigations on the tooth-bone interface. J Biomed Opt. 2001;6(2):224-30.
21. Romeed SA, Fok SL, Wilson NH. A comparison of 2D and 3D finite element analysis of a restored tooth. J Oral Rehabil. 2006;112(33):209-15.
22. Rudd KD, O’Leary TJ, Stumpf AJ. Horizontal tooth mobility in carefully screened subjects. Periodontics. 1964;2:65-8. (1985) found a relationship between occlusal
con-tact and wedge-shaped defects in posterior teeth. Heymann et al.26 (1991) pointed out a relationship between the loss of cervical illings and the presence of traumatic occlusal contacts.
Conclusion
Under a load of 235.9 N, stress on the enamel-dentine interface at the CEJ of the palatal surface was greater than the enamel’s tensile strength, sug-gesting the possibility of occurrence of NCCLs, such as abfractions.
Acknowledgements
This study was partially based on a thesis sub-mitted to The Fluminense Federal University, in ful-illment of the requirements for the degree of Master of Science.
23. Jepsen A. Root surface measurement and a method for X-ray determination of root surface area. Acta Odontol Scand. 1963;21(1):35-46.
24. Borcic J, Anic I, Smojver I, Catic A, Miletic I, Ribaric PS. 3D finite element model and cervical lesion formation in normal occlusion and in malocclusion. JOral Rehabil. 2005;32(7):504-10.
25. Kishen A, Tan KBC, Asundi A. Digital moiré’ interferometric investigations on the deformation gradients of enamel and dentine: An insight into non-carious cervical lesions. J Dent. 2006;34(1):12-8.
26. Heymann HO, Sturdevant JR, Bayne SC, Wilder AD, Sluder TB, Brunson WD. Examining tooth flexural effects on cervi-cal restorations: a two-year clinicervi-cal study. J Am Dent Assoc. 1991;122(5):41-7.
27. Fernandes CP, Chevitarese O. The orientation and direction of rods in dental enamel. J Prosthet Dent. 1991;65(4):793-800. 28. Ott RW, Proschel P. [Etiology of wedge-shaped defects. A