*e-mail: [email protected]
Comparison of Analytical Models with Cellular Automata
Simulation of Recrystallization in Two Dimensions
Paulo Rangel Rios*, Janaína Costa Pereira Torres de Oliveira,
Valmir Torres de Oliveira, José Adilson de Castro
Escola de Engenharia Industrial Metalúrgica de Volta Redonda,
Universidade Federal Fluminense,
Av. dos Trabalhadores, 420, 27255-125 Volta Redonda - RJ, Brazil
27255-125 Volta Redonda - RJ, Brazil
Volta Redonda - RJ, Brazil
Received: January 4, 2005; Revised: April 18, 2005
Cellular automata simulation of recrystallization in two dimensions is carried out. The simulated microstrutural evolution is compared in detail with the predictions from mathematically exact analytical theories considering both kinetic and geometrical aspects. Very good agreement is observed between the cellular automata simulation and the theoretical results. Moreover, the simulated data is used to test new expressions recently derived to describe the evolution of the interfaces between recrystallized grains. This work focuses on recrystallization but its results are applicable to any nucleation and growth transformation.
Keywords:microstructure, kinetics, recrystallization, computer simulation, cellular automata
1. Introduction
Recent years have witnessed a large increase in computer simula-tion of microstructural evolusimula-tion. For example, there are many papers on computer simulation of grain growth evolution using a wide range of simulation techniques. Not so much attention has been given to recrystallization. One promising technique is that of cellular automata. Hesselbarth and Göbel1 applied it for recrystallization in an early work. Other papers have also applied this technique2-8.
An important issue that arises when a computer model is chosen is whether it is able to forecast the process results. In other words, to what extent one can trust that it actually simulates the intended process or phenomenon. Although the ultimate test of any model is to accurately represent reality, its first test is to determine its ability to describe the phenomenon in simple cases for which there are math-ematically exact analytical solutions. A “good” model should be able to agree closely with the mathematically exact analytical solutions. Moreover, if valid, the simulation can assist the development of the analytical theory itself. The simulation can provide accurate data for situations in which there are no analytical results.
The basis of analytical modeling of recrystallization are the mathematically exact results of Johnson and Mehl9, Avrami10-12 and Kolmogorov13, the JMAK theory, extended by DeHoff’s14 concept of microstructural path. Vandermeer and coworkers have successfully used this approach and developed it in recent years15-17. Detailed de-scription of this theory has been recently given by Rios and Padilha18. In this theory, nucleation is assumed to take place in sites randomly located in the strained matrix. The simplest assumption is that all nucleation occurs at the beginning of recrystallization. This is nor-mally called site-saturation and has been experimentally found to be a reasonable assumption for recrystallization19. When, in addition to that, a constant interface velocity is also assumed, a number of exact theoretical expressions are obtained. However, even for the simplest assumptions there are gaps in the theory. For instance, only recently analytical expression were developed20 to quantitatively describe the time evolution of the interface area between recrystallized grains.
In this work, a cellular automata(CA) simulation of recrystalliza-tion is carried out. The simulated microstrutural evolurecrystalliza-tion is compared
in detail with the predictions from mathematically exact analytical theories considering both kinetic and geometrical aspects. Moreover, the simulated data is used to test new expressions derived to describe the evolution of the interfaces between recrystallized grains. It is worthy of note that although this work focuses on recrystallization its results are applicable to any nucleation and growth transformation.
2. Cellular Automata Simulation
2.1. Description of the simulation
Cellular automata methodology was used to simulate recrystalli-zation. The implementation followed that of Hesselbarth and Göbel1,7,8 using the von Neumann neighborhood criterion. The matrix consisted of a square lattice with 812 x 812 cells and 784 nuclei. One cell was considered to have a unit area and consequently the side of a single cell had unit length. The units of all quantities reported here follow from this. The number of nuclei per unit of area, NA, was equal to 1/841. The matrix size and number of nuclei were chosen for reasons described in a previous work7,8. The nuclei were randomly dispersed on the matrix. The nucleation was site-saturated: all nuclei appeared at t = 0. The simulation produced a sequence of matrices as a function of time. Time is discrete in CA, it takes integer values starting from
t = 0. One time unit corresponds to the interval between two consecu-tive matrix updates1,8. From the simulated matrices, all the desired quantities could be extracted. Hesselbarth and Göbel give a more detailed account of two-dimensional cellular automata in general. Oliveira8 gives further details of the present simulation.
2.2. Geometry and kinetics of the evolution of a single grain
in CA
All nucleation takes place at t = 0 but at that instant the sizes of all nuclei are equal to zero. Therefore, the area of a single grain, a, and its perimeter, l, at t = 0 are equal to:
a(0) = 0 (1a)
l(0) = 0 (1b)
For t > 1 the area of a single grain as a function of time is8:
a(t) = 2t2 – 2t + 1 (2)
This equation is not valid for t = 0. Neglecting the lower order powers of time:
a(t) @ 2t2 area units (3)
Equation 3 is in error at the very beginning but will be used in what follows. Equation 3 suggests that for better results with CA it is better to use a large matrix with a small number of nuclei.
The perimeter of a single grain, l, for t > 1 is8:
l(t) = 8t – 4 (4)
Again, neglecting early time behavior:
l(t) @ 8t length units (5)
The interface velocity, v, can be calculated with the help of Cahn-Hagel21 equation for 2d:
v ldt da
= (6)
Inserting Equations 3 and 5 gives:
v = 0.5 units of length/unit of time (7)
The units will be omitted from now on.
The interface velocity is a constant. Therefore, for a single grain the simulation was able to produce constant growth rate.
The integral of the curvature of any closed figure along its pe-rimeter is 2π, so the average interface curvature of a single grain is, for t > 1:
( )
k l t
2r
= (8)
or
( / )
k
t t
4 1 2 4
r , r
=
- (9)
If one considers the set of all grains growing as if they were isolated, it is common to refer to this set as the “extended space” and to the geometric properties of this set as “extended quantities”. For example, the sum of the area of all grains growing as if they were isolated divided by the total volume is normally called “extended area fraction”. This terminology will be used in what follows.
3. Results and Discussion
Figures 1-7 show the results obtained from the simulation com-pared with the theoretical expressions.
In this section, the expressions derived in the previous section for single grain evolution are used to obtain expressions containing “global” measurements, that is, average measurements such as area fraction and interface length per unit of area. The calculated expres-sions are compared with the results from the simulation. Section 3.1 mainly deals with quantities related to the mobile interface: the interface between recrystallized and nonrecrystallized regions. Sec-tion 3.2 compares simulaSec-tions results with new expressions derived for the evolution of the interfaces between recrystallized and non-recrystallized regions.
3.1. Area fraction, interface length per unit of area,
microstructural path, grain boundary velocity and grain
boundary curvature
The extended area fraction, AAE, is the sum of the area of all individual grains supposing that they grow without impingement. The subscript “E” is reserved for “extended quantities” defined in a manner similar to the extended area fraction.
AAE = NAa = 2NAt2 (10) For randomly located nuclei, extended area fraction, AAE, and real area fraction, AA, are related by the JMAK9-13 expression:
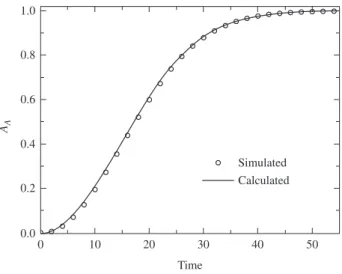
AA = 1 – exp(– 2NAt2) (11)
Figure 1 shows a comparison between AA calculated from the analytical solution and obtained from the CA simulation. The agree-ment is very good.
The extended interface length between transformed and untrans-formed regions, LAE is the sum of the interface length of all individual grains supposing that they grow without impingement:
LAE = NAl = 8NAt (12) For randomly located nuclei, extended interface length and real interface length, LA, are related by the DeHoff’s14 expression:
LA = LAE(1 – AA) = 8NAtexp(– 2NAt2) (13) Figure 2 shows a comparison between the LA calculated from the analytical solution and obtained from the CA simulation. The agreement is very good.
In two dimensions the microstructural path can be seen as a curve on the (AA,LA) plane. From Equations 3 and 5:
l=4 2 a (14)
Multiplying both sides by NA and using the above:
( ) ln
L N A
A
32 1
1 1
A A A
A
=
-c m (15)
Figure 3 shows a comparison between the values calculated us-ing the theoretical expression for the microstructural path obtained above and those obtained from the simulation. The agreement is very good.
1.0
0.8
0.6
0.4
0.2
0.0
0 10 20 30 40 50
Time
AA
Simulated Calculated
Figure 1. Area fraction, AA, against time. Simulation results are in agreement
The grain boundary velocity is given by21:
.
v ldt da
L dt
dA
L dt
dA
1 1 0 5
AE AE
A A
= = = = (16)
The grain boundary velocity calculated from the simulated values was 0.51 + 0.01, very close to the theoretical prediction. This means that the interface velocity in real space is the same as that in extended space, as expected.
The average curvature of the interface between transformed and untransformed region can be measured by DeHoff’s22 sweeping tangent method:
k L
T
A A r
= (17)
TA is the number of points of tangency between a sweeping test line and a grain boundary per unit test area. Also by multiplying and dividing Equation 8 by NA and using Equation 13:
( )
k
t L
N A
4
2 1
A
A A
r r
= = - (18)
JMAK assumes that the interface shape remains unchanged after impingement. For example, the interface between transformed and untransformed region of a circular grain after impingement remains the arc of a circle of the same radius of the radius of the circle that it would have if it were growing as an isolated grain. This implies that the average curvature of the interface between transformed and untransformed region, Equation 17, is equal to the average curvature of a single grain, Equation 18.
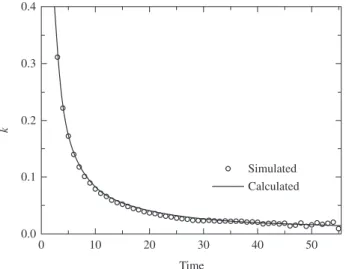
Figure 4 shows a comparison between the values calculated using the theoretical expression, Equations 9 or 18, obtained from a single grain, for the average curvature of the interface between transformed and untransformed region per unit of area, k, and the values obtained from the simulation, by means of the sweeping tangent method, Equa-tion 17. The agreement is very good. This means that the moving interface shape remains the same after impingement, as supposed in the JMAK theory.
It is important to stress that the calculated curves in Figures 1-4 were not fitted but obtained from the kinetics of a single grain using nothing but the JMAK correction for impingement.
3.2. New expressions for the impinged interface length per
unit of area, total interface length per unit of area and the
contiguity
There are two kinds of interface during recrystallization: mobile and immobile. The mobile interface is the interface between the re-crystallized region and the deformed matrix. This interface migrates and its migration determines the recrystallization progress. The immo-bile interface is a consequence of impingement of recrystallized grains. The recrystallized grain size is a function of the interface area between recrystallized grains when the recrystallization reaches 100%.
Traditionally, recrystallization studies focus on the mobile inter-face. This could be seen in the previous section. All equations involve only LA. However, the amount of interface between recrystallized grains is an important quantity and contains valuable information about the evolution of recrystallization. The CA simulation is able to provide accurate data on these interfaces and so gives a good basis for comparison with analytical models. In what follows, recently obtained20 analytical expressions are shown for the interface length of the interface between recrystallized regions per unit of area, LR, and for the total interface area per unit of area, LT, defined as: 0.8
0.6
0.4
0.2
0.0
0 10 20 30 40 50
Time
LA
Simulated Calculated
0.08
0.06
0.04
0.02
0.00
0.0 0.2 0.4 0.6 0.8 1.0
AA
LA
Simulated Calculated
Figure 2. Length of the interface between transformed and untransformed
region per unit of area, LA, against time. Simulation results are in agreement with those calculated from the kinetics of a single grain, Equation 13.
Figure 3. Microstructural path: length of the interface between transformed
and untransformed region per unit of area, LA, against Area fraction, AA. Simulation results are in agreement with those calculated from the kinetics of a single grain, Equation 15.
0.4
0.3
0.2
0.1
0.0
0 10 20 30 40 50
Time
k
Simulated Calculated
Figure 4. Average curvature of the interface between transformed and
LT = LA + 2LR (19) Another important quantity, derived from those is the contiguity parameter, CR. The contiguity is the ratio of immobile interface length to the total interface length and is quite sensitive to deviations of nuclei location from randomness, as recently shown by Vandermeer and Jensen23. It can be defined as23:
C
L L
L
2 2
R
A R
R
=
+ (20)
The expressions for the interface length of the interface between recrystallized regions per unit of area, LR, as a function of time is given by20:
( ) exp( ) ( )
L t L 4 N t N t erf N t
2 2 2
R RF
A
A A
2
r
= d- - + n (21)
The total interface length per unit of area is:
( ) exp( )
L tT 8N tA 2N tA 2
2
= - + (22)
( ) ( )
exp
L N t N t erf N t
2 4
2 2 2
RF
A
A A
2
r
+ d- - + n
The contiguity, CR, then becomes:
( )
C tR =1- (23)(23)
( ) ( ) ( )
( )
exp exp
exp
N t N t L N t N t erf N t
N t N t
8 2 2 4
2 2 2
8 2
A A RF
A
A A
A A
2 2
2
r
-- + - - +
-d n
It is more common to plot CR as a function of area fraction than of time. Combining Equation 11 and Equation 23 gives:
CR=1- (24)(24)
( ) ( )
( )
ln ln ln
ln
N A A L A A erf A
N A
A
32 1 1 1 2 2 1 1 1 1 1
32 1
1 1
A A
A
RF A
A A
A A
A
r
-- + - - - +
--
-c f c e c
c
m m mop
m
Notice that the above expressions are specific for the CA simu-lation carried out here. More detailed discussion and derivations of Equations 21-24 are the subject of a paper now in preparation20.
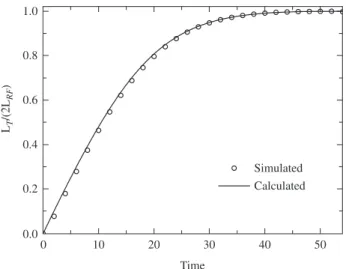
Figures 5-7 show the comparison of the values calculated by means of Equations 21-24 and those obtained from the simulation. The agreement is very good. For LR and LT, Figures 5 and 6, the normalized quantities LR/LRF and LT/2LRF were plotted.
The agreement between the new expressions and the simulation was very good.
It is important to mention that no adjustable parameters were used in this work. Only exact analytical solutions were compared with the simulations. The good agreement between theory and simulation shows that CA is a good model for recrystallization. It is able to repro-duce exactly the situations for which there are mathematically exact solutions. This good agreement suggests that CA can be confidently applied to situations in which there are no analytical solutions. This will be done in future papers.
4. Summary and Conclusions
The very good agreement between the cellular automata(CA) simulation and the theoretical expressions shows that CA is a good model for recrystallization. CA is able to reproduce exactly the site-saturated, constant velocity situation for which there are exact solutions.
Moreover, the simulation results were useful to test new expres-sions recently developed20 for the evolution of length per unit of area
Figure 7. Contiguity, CR, against area fraction. Simulation results are in
agreement with those calculated from the kinetics of a single grain, Equa-tion 24. The contiguity is the ratio of immobile interface length to the total interface length.
1.0
0.8
0.6
0.4
0.2
0.0
0 10 20 30 40 50
Time LR
/L
RF
Simulated Calculated
Figure 5. Length of the interface between transformed and transformed region
per unit of area, LR/LRF, against time. Simulation results are in agreement with those calculated from the kinetics of a single grain, Equation 21.
1.0
0.8
0.6
0.4
0.2
0.0
0 10 20 30 40 50
Time LT
/(2L
RF
)
Simulated Calculated
1.0
0.8
0.6
0.4
0.2
0.0
0.0 0.2 0.4 0.6 0.8 1.0
AA
CR
Simulated Calculated
Figure 6. Total interface length per unit of area, LT/(2LRF) against time.
of the interface between the recrystallized regions. The new expres-sions showed very good agreement with the simulated results. It is worth pointing out that no adjustable parameters were used throughout this work. The present work has emphasized recrystallization but its results are general and may be applied to any nucleation and growth transformation.
Acknowledgments
This work was supported by Conselho Nacional de Desenvolvi-mento Científico e Tecnológico, CNPq, Coordenação de Aperfeiçoa-mento de Pessoal de Nível Superior, CAPES, and Fundação de Amparo à Pesquisa do Estado do Rio de Janeiro, FAPERJ.
References
1. Hesselbarth HW, Göbel IR. Simulation of recrystallization by cellular automata. Acta Metallurgica et Materialia. 1991; 39(9):2135-2143.
2. Pezzee CF, Dunand DC. The impingement effect of an inert, immobile 2nd phase on the recrystallization of a matrix. Acta Metallurgica et Materialia. 1994; 42(5):1509-1524.
3. Sessa V, Fanfoni M, Tomellini M. Validity of Avrami’s kinetics for ran-dom and nonranran-dom distributions of germs. Physical Review B. 1996; 54(2):836-841.
4. Goetz RL, Seetharaman V. Static recrystallization kinetics with homo-geneous and heterohomo-geneous nucleation using a cellular automata model. Metallurgical and Materials Transactions A-Physical Metallurgy and Materials Science. 1998; 29(9):2307-2321.
5. Marx V, Reher FR, Gottstein G. Simulation of primary recrystallization using a modified three-dimensional cellular automaton. Acta Materi-alia.1999; 47(4):1219-1230.
6. Pineda E, Pradell T, Crespo D. Non-random nucleation and the Avrami kinetics. Philosophical Magazine A-Physics of Condensed Matter Struc-ture Defects and Mechanical Properties. 2002; 82(1):107-121.
7. Rios PR, Carvalho JJS, Salazar TC, Paula FVL, Castro JA. Cellular automata simulation of the effect of nuclei distribution on the recrystal-lization kinetics. Materials Science Fórum. 2004; 467-470: 659-664.
8. Oliveira JCPT. Simulação do efeito da distribuição dos núcleos na cinética e no caminho microestrutural da recristalização pelo método do autômato celular [unpublished M. Sc. thesis]. Volta Redonda: Universidade Federal Fluminense; 2004.
9. Johnson WA, Mehl RF. Reaction kinetics in processes of nucleation and growth. Transactions AIME. 1939; 135:416-441.
10. Avrami MJ. Kinetics of phase change I general theory. The Journal of Chemical Physics. 1939; 7(12):1103-1112.
11. Avrami MJ. Kinetics of phase change II transformation-time relations for random distribution of nuclei. The Journal of Chemical Physics. 1940; 8(2):214-224.
12. Avrami MJ. Kinetics of phase change III granulation, phase change, and microstructure kinetics of phase change. The Journal of Chemical Phys-ics. 1941; 9(2):177-184.
13. Kolmogorov NA. The statistics of crystal growth in metals. Isvestiia Academii Nauk SSSR - Seriia Matematicheskaia. 1937; 1:333-359. 14. DeHoff RT. In: Hansen N, Jensen DJ, Leffers T, Ralph B, editors.
Anneal-ing Processes—Recovery, Recrystallization and Grain Growth, Proceed-ings of the 7th Conference of Risø National Laboratory; 1986, Roskilde, Denmark. Roskilde: Risø National Laboratory; 1986. p. 35-52. 15. Vandermeer RA, Masumura RA. The microstructural path of grain
bound-ary nucleated phase transformations. Acta Metallurgica et Materialia. 1992; 40(4):877-886.
16. Vandermeer RA, Jensen DJ. The migration of high angle grain boundaries during recrystallization interface. Science. 1998; 6(1-2):95-104.
17. Vandermeer RA, Jensen DJ. Microstructural path and temperature de-pendence of recrystallization in commercial aluminum. Acta Materialia. 2001; 49(11):2083-2094.
18. Rios,PR, Padilha AF. Microstructural path of recrystallization in a commercial Al-Mn-Fe-Si (AA3003) alloy. Materials Research. 2003; 6(4):605-613.
19. Lauridsen EM, Poulsen HF, Nielsen SF, Jensen DJ. Recrystallization kinetics of individual bulk grains in 90% cold-rolled aluminium. Acta Materialia. 2003; 51(15):4423-4435.
20. Rios PR, Godiksen R, Schmidt S, Jensen DJ, Vandermeer RA, [personal communication]. 2004.
21. Cahn JW, Hagel W. Theory of the Pearlite Reaction. In: Zackay ZD, Aaaronson HI, editors. Decomposition of austenite by Diffusional Proc-esses. New York: Interscience; 1960. p. 131-196, 1960
22. DeHoff RT. Quantitative estimation of mean surface curvature. Transac-tions of the Metallurgical Society of AIME. 1967; 239(5):617-621.