ABSTRACT
Objective: The use of the rapid shallow breathing index (RSBI) is recommended in ICUs, where it is used as a predictor of mechanical ventilation (MV) weaning success. The aim of this study was to compare the performance of the RSBI calculated by the traditional method (described in 1991) with that of the RSBI calculated directly from MV parameters. Methods: This was a prospective observational study involving patients who had been on MV for more than 24 h and were candidates for weaning. The RSBI was obtained by the same examiner using the two different methods (employing a spirometer and the parameters from the ventilator display) at random. In comparing the values obtained with the two methods, we used the Mann-Whitney test, Pearson’s linear correlation test, and Bland-Altman plots. The performance of the methods was compared by evaluation of the areas under the ROC curves. Results: Of the 109 selected patients (60 males; mean age, 62 ± 20 years), 65 were successfully weaned, and 36 died. There were statistically signiicant differences between the two methods for respiratory rate, tidal volume, and RSBI (p < 0.001 for all). However, when the two methods were compared, the concordance and the intra-observer variation coeficient were 0.94 (0.92-0.96) and 11.16%, respectively. The area under the ROC curve was similar for both methods (0.81 ± 0.04 vs. 0.82 ± 0.04; p = 0.935), which is relevant in the context of this study. Conclusions: The satisfactory performance of the RSBI as a predictor of weaning success, regardless of the method employed, demonstrates the utility of the method using the mechanical ventilator.
Keywords: Respiration, artiicial; Ventilator weaning; Spirometry.
The rapid shallow breathing index as
a predictor of successful mechanical
ventilation weaning: clinical utility when
calculated from ventilator data
Leonardo Cordeiro de Souza1,2,3,4, Jocemir Ronaldo Lugon1,5
Correspondence to:
Leonardo Cordeiro de Souza. Hospital Icaraí, Rua Marquês de Paraná, 233, 5º andar, Centro, CEP 24030-215, Niterói, RJ, Brasil. Tel.: 55 21 3176-5000 extension 5306. E-mail: leonardo.uti@gmail.com
Financial support: None.
INTRODUCTION
The use of indices predicting weaning outcomes can reduce the risk of weaning failure and complications posing potential morbidity, such as reintubation.(1,2) Weaning indices are used in order to evaluate lung mechanics and can provide information regarding the causes of mechanical ventilation (MV) dependence.(3,4) It is currently recommended that weaning indices be used only in cases in which it is dificult to make a decision; the decision to perform a spontaneous breathing trial (SBT) should not be based on any one weaning index.(5,6)
The rapid shallow breathing index (RSBI), which is also referred to as the ratio of respiratory rate to tidal volume (f/VT), is the most widely used predictor of weaning success because it is easy to use and interpret. (1,4,7-13) The 2007 international consensus guidelines for weaning from MV, the 2007 Brazilian consensus guidelines for weaning from MV, and the 2013 Brazilian guidelines for MV underscore the clinical utility of the RSBI and recommend its use.(5,8,9)
First described by Yang & Tobin in 1991,(3) the RSBI allows assessment of respiratory mechanics by f/VT. The RSBI was designed to be measured during spontaneous
breathing for 60 s with a spirometer connected to the artiicial airway before an SBT. An RSBI of less than 105 breaths/L predicts successful weaning from MV.(3,11,14)
It has been proposed that the RSBI be calculated directly from ventilator data during spontaneous ventilation; however, because of the study design, the small number of patients enrolled, and the limitations of the statistical tests used, the results were inconclusive.(14-17)
The major limitations of the RSBI appear to be related to neurological and neuromuscular diseases, as well as to prolonged ventilation. In such cases, the performance of the RSBI is far worse than that of other predictors, such as the Glasgow Coma Scale score and the recently described timed inspiratory effort (TIE) index.(4,12,13,18,19)
The primary hypothesis of the present study was that the RSBI calculated directly from ventilator data is comparable with the RSBI calculated by the traditional method in terms of their accuracy in predicting successful weaning from MV.
METHODS
The present study evaluated data from a database developed for a previous study of predictors of weaning 1. Programa de Pós-Graduação em
Ciências Médicas, Universidade Federal Fluminense, Niterói (RJ) Brasil. 2. Serviço de Terapia Intensiva, Hospital &
Clínica São Gonçalo, São Gonçalo (RJ) Brasil.
3. Serviço de Terapia Intensiva, Hospital Icaraí, Niterói (RJ) Brasil.
4. Serviço de Nefrologia, Departamento de Medicina, Universidade Federal Fluminense, Niterói (RJ) Brasil. Submitted: 7 April 2015. Accepted: 25 August 2015.
success and was approved by the Research Ethics Committee of the Fluminense Federal University (Protocol no. 259/09). At the time, patients (or their legal guardians) gave written informed consent.
The inclusion criteria were as follows: being over 18 years of age; having been on MV for more than 24 h; and being a candidate for weaning from MV. The study participants also met the following criteria: resolution of the acute phase of the disease that led to their being placed on MV; a preserved cough relex or absence of excessive tracheobronchial secretion; cardiovascular stability (heart rate ≤ 120 bpm and systolic blood pressure = 90-160 mmHg, with minimal or no use of vasopressors); stable metabolic state; adequate oxygenation (SaO2 > 90% with an FiO2 ≤ 0.4 or PaO2/ FiO2 ≥ 200 mmHg with a positive end-expiratory pressure ≤ 8 cmH2O); adequate respiratory rate (≤ 35 breaths/min); pressure support ≤ 20 cmH2O; absence of signiicant respiratory acidosis (pH > 7.30); and, for endotracheally intubated patients, adequate mental status (a Glasgow Coma Scale score > 10).
The exclusion criteria were as follows: tracheal stenosis; intracranial pressure > 20 mmHg; sedation; severe heart failure or hemodynamic instability; and signs of systemic infection/reinfection during the weaning process.
The following mechanical ventilators were used: eXtend (Air Liquide, Paris, France), Servo-s (Maquet, Rastatt, Germany), and Puritan Bennett™ 840 (Covidien Nellcor, Boulder, CO, USA). Before measurement of MV parameters on the ventilator display, all mechanical ventilators and their circuits were calibrated in order to prevent measurement bias.
Procedures
The RSBI was calculated after the aforementioned weaning criteria were met and before an SBT was performed. For all study participants, the RSBI was calculated by the traditional method (i.e., employing a spirometer) and directly from MV parameters (i.e., employing the parameters from the ventilator display). The choice of which method should be used irst was made by random sampling. All patients were on pressure support ventilation (PSV) at 12-20 cmH2O, without sedation, and with the head of the bed at 45°, having been preoxygenated with an FiO2 of 1.0 for 2 min and their airways having previously been aspirated.(20,21) After the RSBI was calculated by the two different methods, patients underwent an SBT with a T-piece and an FiO2 of 0.4 for 30 min, without the inluence of previous test results. All patients were continuously monitored by pulse oximetry and electrocardiography, under the supervision of a respiratory physiotherapist.(20,21)
In order to calculate the RSBI by the traditional method, the spirometer (Wright MK20; Ferraris Medical Ltd., Hertford, England) was connected to the artiicial airway and left in place for 1 min. Spontaneous VT was calculated by dividing minute ventilation by respiratory
rate, and the RSBI was calculated by dividing respiratory rate by VT in liters.(3,4)
In order to calculate the RSBI directly from ventilator data, respiratory rate and minute ventilation were obtained from the parameters from the ventilator display, with patients on PSV at 5 cmH2O and continuous positive airway pressure of 5 cmH2O. The RSBI was calculated after 5 min of ventilation as described above, and VT was calculated by dividing minute ventilation by respiratory rate.
The decision to place patients on MV again was made by a respiratory physiotherapist, the attending physician, or both (who were blinded to the RSBIs obtained), being based on signs of poor tolerance (described below). Weaning from MV was considered successful if patients were able to breathe spontaneously after the SBT.(2,4,8,9,16,22,23)
In order to be extubated, patients had to pass the SBT and meet the following criteria: an adequate level of consciousness; an effective cough; and a patent airway. Extubation was considered successful if patients were not reintubated within 48 h after extubation. In tracheostomized patients, extubation was considered successful if, after passing the SBT, patients were able to breathe spontaneously after ventilator disconnection, without the need for reconnection within 48 h after disconnection.(5)
The SBT was interrupted if patients met at least one of the following criteria: SaO2 < 90%; respiratory rate > 35 breaths/min; heart rate > 140 bpm, a sustained increase in heart rate, or a reduction in heart rate of more than 20%; mean arterial pressure > 130 mmHg or < 70 mmHg; or the presence of agitation, excessive sweating, disorientation, or depressed mental status. Patients who showed any of the aforementioned signs during the SBT or within 48 h after discontinuation of MV were considered to be cases of weaning failure, extubation failure, or both and were again placed on ventilatory support.(2,4,5,8,9,16,22,23)
Statistical analysis
Variables with normal distribution were expressed as means and standard deviations, whereas variables with non-normal distribution were expressed as medians and interquartile ranges. Categorical data were expressed as absolute and relative frequencies. The nonparametric Mann-Whitney test was used, and values of p < 0.05 were considered signiicant.
All statistical analyses were performed with MedCalc, version 11.4.2.0 (MedCalc Software, Mariakerke, Belgium).
RESULTS
Of the 109 patients who participated in the study, 60 were male, and the mean age was 62 ± 20 years (Table 1). Sixty-ive (59.6%) were successfully weaned from MV, and 36 (33%) died, 8 of whom had been successfully weaned from MV. The reintubation rate was 10.7%.
Table 2 shows the medians and interquartile ranges of the parameters used in order to calculate the RSBI, together with a comparison between the two different methods used in order to calculate f/VT. All variables showed statistically signiicant differences, with values of p < 0.001, the exception being minute ventilation (p = 0.132).
Quality indicators (sensitivity, speciicity, PPV, NPV, PLR, and NLR) and the cut-off points for the RSBIs calculated by the two different methods are shown in Table 3.
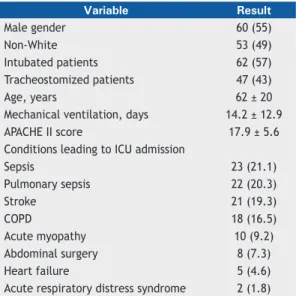
As can be seen in Figure 1, there were no statistically signiicant differences between the AUCs for the RSBIs calculated by the two different methods (0.81 ± 0.04 vs. 0.82 ± 0.04; p = 0.947). As can be seen in Figure 2, Pearson’s linear correlation between the two methods was 0.94 (0.92-0.96). As can be seen in Figure 3, the intra-observer variation coeficient was 11.16%.
DISCUSSION
The use of the RSBI as a predictor of weaning success has been widely studied in the intensive care setting.(24) The performance of the RSBI has been shown to range from moderate to good (AUC, 0.72-0.89).(3,4,11,25,26) This variation might be due to the heterogeneity of the study samples, given that the proportions of patients with neurological disease, neuromuscular disease, or prolonged ventilation vary across studies.(4,11-13) The use of different study designs, weaning protocols, measurements, and cut-off points also contributes to this variation.(4,6,15,26-29)
The RSBI and maximal inspiratory pressure (MIP) have historically been recommended by the American Thoracic Society/European Respiratory Society and are among the most widely used predictors of weaning outcome in clinical practice.(5,8) The superiority of f/V
T and MIP over other predictors has been reported in two different studies, in which the AUCs for f/VT and MIP were 0.89(3) and 0.80,(20) respectively. Promising new weaning indices include the integrative weaning index, the AUC for which was found to be 0.96 in a study from which neurological patients were excluded,(11) and the TIE index, the AUC for which was found to be 0.90 for a mixed population of intubated patients and 0.96 for patients with neurological or neuromuscular disease.(4,13)
In our sample of 109 patients, weaning failure occurred in approximately 40%, a proportion that is larger than that reported in the literature (i.e., 30%).(8) This can be explained by advanced age (mean age, 62 ± 20 years), a high prevalence of patients with prolonged ventilation (mean duration of MV, 14.2 days), a high proportion of tracheostomized patients (43%), and high Acute Physiology and Chronic Health Evaluation II scores.(9,17)
The performance of the RSBI calculated by the traditional method and that of the RSBI calculated directly from ventilator data were comparable with the RSBI performance reported in other studies.(4,11,20) It is of note that, regardless of how it was calculated, the RSBI was found to have low accuracy in identifying positive/negative cases (of patients who pass the SBT but cannot be weaned), as evidenced by its relatively low speciicity, NPV, and NLR.
Technological advances in patient monitoring and ventilation have made it easy to obtain real-time data that allow determination of the clinical status of patients on ventilatory support. This led to studies comparing the RSBI calculated by the traditional method with the RSBI calculated directly from ventilator data, signiicant
Table 1. General characteristics of the patients studied (N = 109).a
Variable Result
Male gender 60 (55)
Non-White 53 (49)
Intubated patients 62 (57) Tracheostomized patients 47 (43)
Age, years 62 ± 20
Mechanical ventilation, days 14.2 ± 12.9 APACHE II score 17.9 ± 5.6 Conditions leading to ICU admission
Sepsis 23 (21.1)
Pulmonary sepsis 22 (20.3)
Stroke 21 (19.3)
COPD 18 (16.5)
Acute myopathy 10 (9.2) Abdominal surgery 8 (7.3) Heart failure 5 (4.6) Acute respiratory distress syndrome 2 (1.8) APACHE II: Acute Physiology and Chronic Health Evaluation II. aValues expressed as n (%) or as mean ± SD.
Table 2. Medians and interquartile ranges of the study parameters.
Variable Rapid shallow breathing index calculated with the use of
p*
A spirometer Pressure support ventilation
differences being found between the two.(14,17,22,28-30) However, none of the aforementioned studies evaluated the performance of the RSBI (as calculated by each method) in predicting weaning success.
Unlike the aforementioned studies, the present study was aimed at comparing the RSBI calculated by the traditional method with the RSBI calculated directly from ventilator data in terms of their accuracy in predicting weaning outcome. As in previous studies, the two methods for calculating the RSBI were found to be signiicantly different in terms of median respiratory rate, VT, and f/VT. However, our most important inding was that the performance of the RSBI calculated by the traditional method was statistically similar to that of the RSBI calculated directly from ventilator data,
as evaluated by the AUCs (0.81 vs. 0.82; p = 0.19). In addition, the concordance—0.94 (0.92-0.96)—and the intra-observer variation coeficient (11.16%) were all within the recommended range for tests that are reproducible and reliable.
In the present study, the cut-off point for the RSBI calculated with the use of a spirometer was 88.5 breaths/L (as determined by the ROC curve), whereas in the original study it was 105 breaths/L.(3) The cut-off point for the RSBI calculated directly from ventilator data in the present study was even lower (i.e., 80.1 breaths/L). Although we cannot offer a deinitive
Table 3. Indicators of the accuracy of the rapid shallow breathing index (calculated with the use of a spirometer and directly from ventilator data) in predicting weaning outcomes.
Index CP Sensitivity Specificity PPV NPV PLR NLR
f/VT (spirometer) 88.5 0.82 0.62 78.3 70.6 3.91 0.25 f/VT (PSV) 80.1 0.80 0.65 76.9 71.2 4.40 0.24 CP: cut-off point for weaning outcome (as determined by the ROC curve); PPV: positive predictive value; NPV: negative predictive value; PLR: positive likelihood ratio; NLR: negative likelihood ratio; f/VT: ratio of respiratory rate to tidal volume (the rapid shallow breathing index); and PSV: pressure support ventilation.
Figure 3. Bland-Altman plots. Intra-observer variation
coeficient (11.16%) for f/VT calculated with the use of a spirometer (S) and f/VT calculated from the parameters from the mechanical ventilator (MV) display. f: respiratory rate; and VT: tidal volume.
100
80
60
40
20
0
100
80
60
40
20
0
0 20 40 60 80 100 0 20 40 60 80 100
Se
n
si
ti
v
it
y
Se
n
si
ti
v
it
y
1 − specificity 1 − specificity
0.82 PSV/CPAP 0.81
Spirometer
0 50 100 150 200 250
250
200
150
100
50
0
R = 0.94
f/VT (S)
f/
VT
(
M
V
)
0 50 100 150 200 250
50
40
30
20
10
0
-10
-20
-30
-40
-50
f/VT (S)
f/
VT
(
S)
−
f
/V
T
(
M
V
)/
f/
VT
(
S)
,
%
+ 1.96 SD 35.0
- 1.96 SD -15.9 Mean 9.6 Figure 1. Areas under the ROC curves for the rapid shallow breathing index (f/VT) calculated with the use of a spirometer and directly from ventilator data, showing no signiicant difference between the two in terms of their accuracy in predicting successful weaning from mechanical ventilation (p = 0.935; Hanley & McNeil test for pairwise comparisons). PSV: pressure support ventilation; and CPAP: continuous positive airway pressure.
explanation for these differences, they might be partly due to the characteristics of the study samples.
It is of note that the accuracy of the SBT, which is considered the gold standard for determining the success of weaning from MV and extubation, is approximately 85%.(2,23,25,31) Therefore, the use of predictors such as f/VT, MIP, the integrative weaning index, and the recently described TIE index can make the outcome of weaning from MV safer, especially in dificult-to-wean patients.(4,11,13,24)
One limitation of the present study is that we did not determine interobserver reproducibility or f/VT
after the SBT. However, the primary objective of the present study was to compare AUCs in terms of their accuracy in predicting weaning success. Therefore, we believe that the aforementioned limitation had little impact on the inal result.
In conclusion, the RSBI calculated directly from ventilator data can be easily incorporated into clinical practice, having no negative impact on the RSBI accuracy in predicting weaning outcome. However, our study shows that the cut-off point for the RSBI calculated directly from ventilator data should be approximately 80 breaths/L, which is lower than that for the RSBI calculated by the traditional method.
REFERENCES
1. Teixeira C, Maccari JG, Vieira SR, Oliveira RP, Savi A, Machado AS, et al. Impact of a mechanical ventilation weaning protocol on
the extubation failure rate in dificult-to-wean patients. J Bras
Pneumol. 2012;38(3):364-71. http://dx.doi.org/10.1590/S1806-37132012000300012
2. Epstein SK. Weaning from ventilatory support. Curr Opin Crit Care. 2009;15(1):36-43. http://dx.doi.org/10.1097/ MCC.0b013e3283220e07
3. Yang KL, Tobin MJ. A prospective study of indexes predicting the outcome of trials of weaning from mechanical ventilation. N Engl J Med. 1991;324(21):1445-50. http://dx.doi.org/10.1056/ NEJM199105233242101
4. de Souza LC, Guimarães FS, Lugon JR. Evaluation of a new index of mechanical ventilation weaning: the timed inspiratory effort. J Intensive Care Med. 2015;30(1):37-43. http://dx.doi. org/10.1177/0885066613483265
5. Barbas CS, Ísola AM, Farias AM, Cavalcanti AB, Gama AM, Duarte AC, et al. Brazilian recommendations of mechanical ventilation 2013. Part 2. Rev Bras Ter Intensiva. 2014;26(3):215-39. http://dx.doi. org/10.5935/0103-507X.20140034
6. Tanios MA, Nevins ML, Hendra KP, Cardinal P, Allan JE, Naumova EN, et al. A randomized, controlled trial of the role of weaning predictors in clinical decision making. Crit Care Med. 2006;34(10):2530-5. http:// dx.doi.org/10.1097/01.CCM.0000236546.98861.25
7. Conti G, Montini L, Pennisi MA, Cavaliere F, Arcangeli A, Bocci MG, et al. A prospective, blinded evaluation of indexes proposed to predict weaning from mechanical ventilation. Intensive Care Med. 2004;30(5):830-6. http://dx.doi.org/10.1007/s00134-004-2230-8
8. Boles JM, Bion J, Connors A, Herridge M, Marsh B, Melot C, et al. Weaning from mechanical ventilation. Eur Respir J. 2007;29(5):1033-56. http://dx.doi.org/10.1183/09031936.00010206
9. Goldwasser R, Farias A, Freitas EE, Saddy F, Amado V, Okamoto V. Mechanical ventilation of weaning interruption [Article in Portuguese]. J Bras Pneumol. 2007;33 Suppl 2S :S128-36. http:// dx.doi.org/10.1590/S1806-37132007000800008
10. Tobin MJ, Jubran A. Meta-analysis under the spotlight: focused on a meta-analysis of ventilator weaning. Crit Care Med. 2008;36(1):1-7. http://dx.doi.org/10.1097/01.CCM.0000297883.04634.11
11. Nemer SN, Barbas CS, Caldeira JB, Cárias TC, Santos RG, Almeida LC, et al. A new integrative weaning index of discontinuation from mechanical ventilation. Crit Care. 2009;13(5):R152. http://dx.doi. org/10.1186/cc8051
12. Ko R, Ramos L, Chalela JA. Conventional weaning parameters do not predict extubation failure in neurocritical care patients. Neurocrit Care. 2009;10(3):269-73. http://dx.doi.org/10.1007/s12028-008-9181-9
13. Souza LC, Guimarães FS, Lugon JR. The timed inspiratory effort: a promising index of mechanical ventilation weaning for patients with neurologic or neuromuscular diseases. Respir Care. 2015;60(2):231-8. http://dx.doi.org/10.4187/respcare.03393
14. Santos Lde O, Borges MR, Figueirêdo LC, Guedes CA, Vian BS, Kappaz K, et al. Comparison among three methods to measure the rapid shallow breathing index in patients submitted to weaning from mechanical ventilation [Article in Portuguese]. Rev Bras Ter Intensiva. 2007;19(3):331-6.
15. Shikora SA, Benotti PN, Johannigman JA. The oxygen cost of breathing may predict weaning from mechanical ventilation better than the respiratory rate to tidal volume ratio. Arch Surg. 1994;129(3):269-74. http://dx.doi.org/10.1001/archsurg.1994.01420270045011
16. Tobin MJ, Jubran A. Weaning from mechanical ventilation. In: Tobin MJ, editor. Principles and practice of mechanical ventilation. 2nd ed. New York: McGraw Hill; 2006. p. 1185-220.
17. Gonçalves EC, Silva EC, Basile Filho A, Auxiliadora-Martins M, Nicolini EA, Gastaldi AC. Low pressure support changes the rapid shallow breathing index (RSBI) in critically ill patients on mechanical ventilation. Rev Bras Fisioter, 2012;16(5):368-74. http://dx.doi. org/10.1590/S1413-35552012005000037
18. Navalesi P, Frigerio P, Moretti MP, Sommariva M, Vesconi S, Baiardi P, et al. Rate of reintubation in mechanically ventilated neurosurgical and neurologic patients: evaluation of a systematic approach to weaning and extubation. Crit Care Med. 2008;36(11):2986-92. http:// dx.doi.org/10.1097/CCM.0b013e31818b35f2
19. Namen AM, Ely EW, Tatter SB, Case LD, Lucia MA, Smith A, et al. Predictors of successful extubation in neurosurgical patients. Am J Respir Crit Care Med. 2001;163(3 Pt 1):658-64. http://dx.doi. org/10.1164/ajrccm.163.3.2003060
20. de Souza LC, da Silva CT Jr, Almeida JR, Lugon JR. Comparison of maximal inspiratory pressure, tracheal airway occlusion pressure, and its ratio in the prediction of weaning outcome: impact of the use of a digital vacuometer and the unidirectional valve. Respir Care. 2012;57(8):1285-90. http://dx.doi.org/10.4187/respcare.01489
21. de Souza LC, da Silva CT Jr, Lugon JR. Evaluation of the inspiratory pressure using a digital vacuometer in mechanically ventilated patients: analysis of the time to achieve the inspiratory peak. Respir Care. 2012;57(2):257-62.
22. Patel KN, Ganatra KD, Bates JH, Young MP. Variation in the rapid shallow breathing index associated with common measurement techniques and conditions. Respir Care. 2009;54(11):1462-6.
23. Hanley JA, McNeil BJ. A method of comparing the areas under receiver operating characteristic curves derived from the same cases. Radiology. 1983;148(3):839-43. http://dx.doi.org/10.1148/ radiology.148.3.6878708
24. Nemer SN, Barbas CS. Predictive parameters for weaning from mechanical ventilation. J Bras Pneumol. 2011;37(5):669-79. http:// dx.doi.org/10.1590/S1806-37132011000500016
25. Alam M, Jones G, Kahl W, Kamath MV. Modeling the weaning of intensive care unit patients from mechanical ventilation: a review. Crit Rev Biomed Eng. 2014;42(1):25-61. http://dx.doi.org/10.1615/ CritRevBiomedEng.2014011124
26. Khan N, Brown A, Venkataraman ST. Predictors of extubation success and failure in mechanically ventilated infants and children. Crit Care Med. 1996;24(9):1568-79. http://dx.doi.org/10.1097/00003246-199609000-00023
27. Soo Hoo GW, Park L. Variations in the measurement of weaning parameters: a survey of respiratory therapists. Chest. 2002;121(6):1947-55. http://dx.doi.org/10.1378/chest.121.6.1947
28. Kheir F, Myers L, Desai NR, Simeone F. The effect of low
29. El-Khatib MF, Jamaleddine GW, Khoury AR, Obeid MY. Effect of continuous positive airway pressure on the rapid shallow breathing index in patients following cardiac surgery. Chest. 2002;121(2):475-9. http://dx.doi.org/10.1378/chest.121.2.475
30. El-Khatib MF, Zeineldine SM, Jamaleddine GW. Effect of pressure support ventilation and positive end expiratory pressure on the rapid shallow breathing index in intensive care unit patients. Intensive
Care Med. 2008;34(3):505-10. http://dx.doi.org/10.1007/s00134-007-0939-x