Prognosis and Complications of Diabetic
Patients Undergoing Isolated Coronary Artery
Bypass Surgery
Karen Alcantara Queiroz Santos
1; Bharbara Berto
1; Alexandre Gonçalves Sousa
2, MD; Fernando Augusto Alves
da Costa
2, MSc
Abstract
Objective: Compare the prognosis and complications of diabetic and non-diabetic patients undergoing isolated coronary artery bypass surgery at a hospital with a high surgical volume.
Methods: Data of patients who underwent coronary artery bypass surgery from June 2009 to July 2010 were analyzed. We selected diabetic and non-diabetic patients and evaluated their postoperative and long-term prognosis based on clinical complications. To reduce the disparity within the sample, statistical analyses were performed using propensity scores.
Results: We included 2,688 patients who underwent coronary artery bypass surgery; 36% of them had diabetes, their mean age was 62.1±9.49 years and 70% (1,884) of them were men. Patients with diabetes were older (63±9 years vs. 61±10 years; P<0.001), more often obese (BMI>25 kg/m2: 70.7% vs. 64.5%; P<0.001), dyslipidemic (50.4% vs. 41.1%; P<0.001), hypertensive (89.2% vs. 78.7%; P<0.001), and presented chronic renal failure (8.3%
vs. 3.8%; P<0.001). They also presented higher rates of acute renal failure (5.6% vs. 2.7%, P<0.001), infection (11.4% vs. 7.2%, P<0.001) and mortality after one year (9.1% vs. 5.6%, P<0.001). Pneumonia was more common among patients with diabetes (7.7% vs. 4.0%, P<0.001). According to propensity scoring, 430 patients (215 diabetics and 215 non-diabetics) had a mean age of 61.3±8.97 years, and 21.2% (91 of 430) were women. However, diabetes was not an independent factor for poor prognosis.
Conclusion: Patients with diabetes were at higher risk for postoperative complications and mortality after undergoing coronary artery bypass surgery. However, diabetes did not explain the poor prognosis of these patients after pairing this factor with the propensity score.
Keywords: Diabetes Mellitus. Coronary Artery Bypass. Diabetes Complications. Cardiac Surgical Procedures. Comparative Study.
DOI: 10.5935/1678-9741.20160002
1Universidade Anhembi Morumbi, São Paulo, SP, Brazil.
2Hospital Beneficência Portuguesa de São Paulo, São Paulo, SP, Brazil.
This study was carried out at Hospital Beneficência Portuguesa de São Paulo, São Paulo, SP, Brazil.
No financial support. No conflict of interest.
Correspondence Address: Karen Alcantara Queiroz Santos
Hospital Beneficência Portuguesa de São Paulo
Rua Maestro Cardim, 769 – Bela Vista – São Paulo, SP, Brazil – Zip code: 01323-001 E-mail: [email protected]
Article received on September 21th, 2015
Article accepted on December 30th, 2015
INTRODUCTION
Diabetes mellitus (DM) is considered to be one of the most prevalent diseases in the western world, constituting a true epidemic in urbanized societies. Its importance is related not only to the increasing incidence of the disease, but also to its
Abbreviations, acronyms & symbols
AMI BMI CABG CHF CKD CVD DM HTN IOT-Re
= Acute myocardial infarction = Body mass index
= Coronary artery bypass grafting = Congestive heart failure = Chronic kidney disease = Cardiovascular disease = Diabetes mellitus = Hypertension = Reintubation rates
extremely close relationship with atherosclerotic disease, which has a great impact on morbidity and mortality worldwide. Estimates of the World Health Organization show that worldwide prevalence of this disease may have an increase of 114% during the next 20 years, leading to the emergence of 330 million new cases[1]. Brazil is following this global trend, and is included among
the 10 countries with the highest absolute number of individuals with DM[2]. In this context, it is necessary to remember that one
of the main causes of mortality related to DM is cardiovascular disease (CVD), especially coronary artery disease, accounting for 60% to 80% of deaths among adults.
In relation to surgical treatment, several studies revealed higher morbidity and perioperative mortality rates among patients with DM undergoing CABG. This finding is probably related to the occurrence of perioperative myocardial infarction, infections, respiratory failure, renal and cerebral complications, all of which prolong hospitalization in these patients[5-7]. Moreover,
the presence of DM is considered to be an independent risk factor for postoperative mortality after CABG, with an odds ratio of 1.73 for cardiovascular death and 2.94 for overall mortality[8,9]. In Brazil, a
study shows mortality as high as 11.8% in diabetic patients[10]. But
another one with octogenarian patients did not found differences in mortality[11].
This study aims to compare the prognosis and complications of diabetic patients with non-diabetic undergoing isolated CABG at a hospital with a high surgical volume.
METHODS
Patient evaluation was performed by collecting prospective data on patients undergoing CABG at our hospital from June 2009 to July 2010. Three senior nurses at the hospital were trained to collect these data using prespecified settings. Patients were included in the database if they fulfilled the following inclusion criteria: they were consecutive patients aged 18 years or older (no restrictions on sex or race) and had undergone CABG. Patients were excluded if they had undergone any other surgery, including cardiac surgery, in which isolated CABG or congenital cardiac surgery was not performed.
From this sample, patients who underwent isolated CABG were selected, and this population was then divided into those with DM and those without DM. For these groups, postoperative prognoses with clinical complications, as well as long-term outcomes, were evaluated by telephone interviews; these interviews were conducted from the 30th day after surgery to one
year after surgery.
Among the clinical complications that occurred following CABG, the following variables were analyzed: perioperative acute myocardial infarction (AMI), neurological complications, pulmonary complications, infectious complications, cardiac arrhythmias, and multiple organ failure occurring within 30 days after the surgery.
Clinical complications were defined as follows:
· Perioperative AMI was defined as: prolonged pain (> 20 minutes); typical pain not improved by nitrates; elevation of cardiac enzymes (CK-MB or troponin > 0.2 micrograms/ml); or a new alteration in cardiac mobility or electrocardiogram series (at least two) showing new changes in the ST/T segment or new Q waves of at least 0.03 seconds or more than one-third of QRS in at least two contiguous leads; · Stroke (cerebrovascular accident) was defined as the
persistence of motor deficit for more than 72 hours or coma for more than 24 hours;
· Acute renal failure was defined as serum creatinine level greater than 2.0 mg/dl, two times greater than the preoperative level, or the necessity of dialysis by any method;
· Infectious processes were defined as: Mediastinitis (defined as deep infection involving muscles, bone and/or mediastinum, fulfilling the following conditions: 1. open wound with tissue excision, 2. positive cultures and 3. treatment with antibiotics); surface of thoracotomy (infection involving thoracotomy and parasternal region fulfilling the following conditions: 1. open wound with tissue excision, 2. positive cultures and 3. treatment with antibiotics); superficial leg incision (infection involving the site of dissection of mediastinal veins fulfilling the following conditions: 1. open wound with tissue excision, 2. positive cultures and 3. treatment with antibiotics); and infections related to venous catheters and the urinary tract. ·Pulmonary complications were defined as prolonged
mechanical ventilation (i.e., the need for ventilation for more than 48 hours in the postoperative period), acute respiratory distress syndrome, pulmonary embolism or pneumonia (diagnosed by the following criteria: positive cultures of sputum, blood or pleural fluid; empyema; or chest X-ray with new infiltrates);
· Cardiac arrhythmias that required intervention comprised atrial fibrillation, atrial flutter, paroxysmal supraventricular tachycardia and bradyarrhythmias;
· Failure of multiple organs was defined as two or more systems with compromised functioning.
All the hospital’s cardiac surgery teams agreed to provide data for the development of the database. The logistic EuroSCORE was individually calculated for all patients (preoperative risk score) and expressed as the average of the groups.
The project was submitted and approved by the Ethics Committee of the Institution with CAEE number 43817015.2.0000.5483. Because this was a retrospective database survey, an informed consent form was not given to the patients. The data obtained from the database were confidentially treated by the research center.
Statistical considerations
Initially, all variables were descriptively analyzed. For quantitative variables, analyses were carried out by observing minimum and maximum values and calculating the mean and standard deviation. For qualitative variables, absolute and relative frequencies were calculated.
To compare the averages of the two groups, we used Student’s t test[12], and when the assumption of data normality
was rejected, we used the nonparametric Mann-Whitney U
test[12]. To test the homogeneity between proportions, we used
the chi-square test or the Fisher’s exact test[12].
Propensity Scoring
First, a logistic regression model[13] was created using the variable
group as the dependent variable. The most relevant confounders [sex, body mass index (BMI in kg/m2), chronic kidney disease
(CKD), hypertension (HTN), previous cerebrovascular accident, congestive heart failure (CHF), endotracheal reintubation, and cardiopulmonary bypass support] were used as predictive factors, and the corresponding tolerance margin was a 0.05 logit. Next, paired cases were selected based on the propensity logistic regression score. This model was built based on a sample of patients paired by a propensity of 01:01, without substitution or repetition. The significance level used for the tests was 5%.
RESULTS
The study included 2,688 diabetic and non-diabetic patients who underwent CABG, with an average age of 62.1 years and 70%
(1,884) males (Table 1). Patients with DM accounted for 36% (990 of 2,688) of the total population. Patients with DM were older on average (63±9 years vs. 61±10 years for non-diabetics; P<0.001),
more were men (64.6% diabetics vs. 73.3% non-diabetics; P<0.001), and more were overweight, with the majority having a
BMI>25 kg/m2 (70.7% diabetics vs. 64.5% non-diabetics, P<0.001).
In addition, patients with DM were more often former smokers (42.0% vs. 38.4% of non-diabetics; P<0.001), dyslipidemic (50.4% vs. 41.1% of non-diabetics; P<0.001) and presented CKD (8.3% vs.
3.8% non-diabetics, P<0.001). Of these, the majority of patients were being treated with dialysis (28.1% of patients with DM vs.
14.1% of non-diabetics; P<0.043), had HTN (89.2% of patients
with DM vs. 78.7% of non-diabetics; P<0.001), more often had a
history of cerebrovascular accident (7.4% of patients with DM vs.
4.0% of non-diabetics; P=0.001), peripheral arterial disease (6.0%
of patients with DM vs. 4.0% non-diabetics; P=0.017) and were
Table 1. Descriptive values [average ± standard deviation or n (%)] of preoperative variables according to the study group.
Original Cohort (n=2,688) Diabetes
P value
Variables No (n=1,698) Yes (n=990)
Age 61±10 63±9 <0.001[1]
Male sex 1,245 (73.3) 639 (64.6) <0.001[2]
Body mass index (kg/m2)
< 25 584 (35.5) 283 (29.3) <0.001[2]
25-30 774 (47.1) 427 (44.3)
>30 285 (17.4) 255 (26.4)
Smoking history:
Smokers 318 (18.7) 104 (10.5) <0.001[2]
Former smokers 652 (38.4) 416 (42.0) <0.001[2]
Never smoked 728 (42.9) 470 (47.5) <0.001[2]
Dyslipidemia 697 (41.1) 499 (50.4) <0.001[2]
Chronic kidney disease 64 (3.8) 82 (8.3) <0.001[2]
In dialysis (n=146) 9 (14.1) 23 (28.1) 0.043[2]
Hypertension 1,336 (78.7) 883 (89.2) <0.001[2]
Previous cerebrovascular accident 67 (4.0) 73 (7.4) 0.001[2]
Chronic obstructive pulmonary disease 128 (7.5) 56 (5.7) 0.062[2]
Peripheral arterial disease 67 (4.0) 59 (6.0) 0.017[2]
Cerebrovascular disease 27 (1.6) 21 (2.1) 0.316[2]
Serum creatinine 1.3±0.6 1.4±0.9 <0.001[1]
Prior CABG 20 (1.2) 18 (1.8) 0.175[2]
Prior acute myocardial infarction 801 (47.2) 442 (44.7) 0.205[2]
Congestive heart failure 21 (1.2) 33 (3.3) <0.001[2]
Arrhythmia 81 (4.8) 54 (5.5) 0.433[2]
Ejection fraction 65.6±11.9 63.5±12.4 0.005[1]
EuroSCORE logistics 2.2±2.0 2.6±2.4 <0.001[3]
[1]Descriptive level of probability determined by the Student’s t-test. [2]Descriptive level of probability determined by the chi-square test.
more likely to present CHF (3.3% of patients with DM vs. 1.2%
non-diabetics; P<0.001). The expected mortality rate calculated
by EuroSCORE was also higher in patients with DM: 2.6±2.4 compared with 2.2±2.0 in non-diabetics (P<0.001).
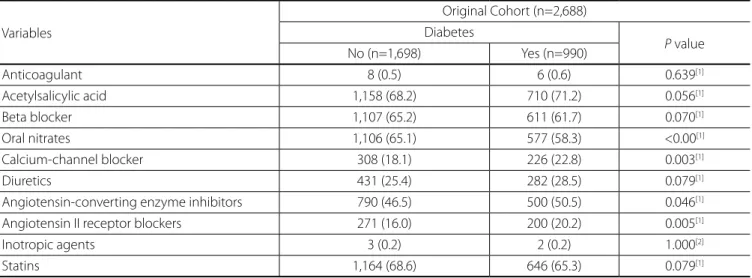
In relation to medical treatment, diabetics had the highest rates of previous use of medications such as calcium-channel blockers (22.8% of patients with DM vs. 18.1% of non-diabetic
patients; P=0.003), angiotensin-converting enzyme inhibitors
(50.5% of patients with DM vs. 46.5% of non-diabetic patients; P=0.046) and angiotensin II receptor blockers (20.2% of patients
with DM vs. 16.0% of non-diabetic patients; P=0.005), as shown in Table 2.
Intraoperatively, diabetic patients underwent more procedures with the support of extracorporeal circulation (88.9% of patients with DM vs. 85.6% of non-diabetic patients; P=0.016), and a
higher percentage of deaths occurred during surgery in patients with DM (0.5%) than in non-diabetic patients (0%; P=0.007) as
can be observed in Table 3.
In the postoperative phase, patients with DM required greater use of transfused blood products (66.6% vs. 60.4% of non-diabetic patients; P=0.001) and had higher reintubation
rates (IOT-Re) (6.5% of patients with DM vs. 3.4% of non-diabetic patients; P<0.001) (Table 4). Blood glucose was monitored during
the first 24 hours after surgery. Patients with DM had higher average levels of blood glucose (197.2±36.6 vs. 166.9±26.1 mg/
dL for non-diabetic patients; P<0.001) and used intravenous
insulin at higher rates (30.6% vs. 16.0% for non-diabetic patients; P<0.001).
In terms of complications, the DM patient group showed higher rates of CKD (5.6% vs. 2.7% for non-diabetic patients; P<0.001), greater dialysis rates (2.2% vs. 0.7% for non-diabetic
patients; P<0.001) and more infections (11.4% vs. 7.2% for non-diabetic patients; P<0.001), with mediastinitis (2.7% vs. 1.5%
for non-diabetic patients; P<0.031) and urinary tract infections
(3.2% vs. 1.2% for non-diabetic patients; P<0.001) being the
Table 2. Absolute and relative frequencies of the use of medications in the preoperative period according to the study group.
Variables
Original Cohort (n=2,688) Diabetes
P value
No (n=1,698) Yes (n=990)
Anticoagulant 8 (0.5) 6 (0.6) 0.639[1]
Acetylsalicylic acid 1,158 (68.2) 710 (71.2) 0.056[1]
Beta blocker 1,107 (65.2) 611 (61.7) 0.070[1]
Oral nitrates 1,106 (65.1) 577 (58.3) <0.00[1]
Calcium-channel blocker 308 (18.1) 226 (22.8) 0.003[1]
Diuretics 431 (25.4) 282 (28.5) 0.079[1]
Angiotensin-converting enzyme inhibitors 790 (46.5) 500 (50.5) 0.046[1]
Angiotensin II receptor blockers 271 (16.0) 200 (20.2) 0.005[1]
Inotropic agents 3 (0.2) 2 (0.2) 1.000[2]
Statins 1,164 (68.6) 646 (65.3) 0.079[1]
[1]Descriptive level of probability determined by the chi-square test. [2]Descriptive level of probability determined by the Fisher’s exact test.
most common (Table 5). Pneumonia was the most common postoperative infection, though it was not grouped in this study with the other infections: 7.7% of patients with DM vs. 4.0% of
non-diabetic patients (P<0.001). Patients with DM also showed higher rates of mortality after one year, with a death rate of 9.1% compared with 5.6% in the non-diabetic patient group (P<0.001).
To elucidate the role of DM in causing the complications found in this study, we performed a propensity score analysis, whose results are shown in Table 6. In this analysis, a total of 430 patients were analyzed (215 with DM and 215 without DM) with an average age of 61 years, of which 21.16% (91 of 430) were female. DM was not found to be a separate, independent risk factor for poor prognosis among these patients. In relation to postoperative complications, renal failure (occurring in 1.4% of DM patients vs. 0.9% of non-diabetic patients; P=1.0) was not found to be a significant factor after pairing. Infectious complications developed in 7.4% of patients with DM compared with 6.5% of non-diabetic patients (P=0.705). Finally, the mortality
rates in patients with DM were evaluated after 30 days and found to be 1.4% diabetics vs. 2.3% for non-diabetic patients (P=0.724);
after one year, mortality rates in patients with DM reached 3.3%
vs. 5.6% in non-diabetic patients (P=0.245).
DISCUSSION
In this study, patients with DM had higher rates of mortality and morbidity (mainly renal disease and infectious) after CABG. However, after performing propensity scoring, DM was not found to be an independent predictive factor for these findings.
Patients with DM who underwent CABG more often suffered from acute renal failure (5.6%). These data were confirmed by Adalsteinsson et al.[14] performed in their retrospective study,
Table 3. Descriptive values [average ± standard deviation or n (%)] of surgical variables according to the study group.
Variables
Original Cohort (n=2,688) Diabetes
P value
No (n=1,698) Yes (n=990)
Emergency surgery/emergency 16 (0.9) 10 (1.0) 0.862[3]
Extracorporeal circulation 1,454 (85.6) 880 (88.9) 0.016[2]
Clamping time 43.5±19.1 44.3±19.8 0.332[1]
Intraoperative death ____ 5 (0.5) 0.007[3]
[1]Descriptive level of probability by the Student’s t-test. [2]Descriptive level of probability by the chi-square test. [3]Descriptive level of probability by the Fisher’s exact test.
Table 4. Descriptive values [average ± standard deviation or n (%)] of postoperative variables according to the study group.
Variables
Original Cohort (n=2,688) Diabetes
P value
No (n=1,698) Yes (n=990)
Transfusion 1,025 (60.4) 659 (66.6) 0.001[2]
Orotracheal reintubation during hospitalization 58 (3.4) 64 (6.5) <0.001[2]
Average blood glucose (24 hours) 166.9±26.1 197.2±36.6 <0.001[1]
Higher value of blood glucose (24 hours) 216.1±46.1 274.2±60.6 <0.001[1]
Lower value of blood glucose (24 hours) 126.5±26.2 131.5±37.7 <0.001[1]
Use of intravenous insulin (24 hours) 272 (16.0) 303 (30.6) <0.001[2]
Readmission to the intensive care unit 117 (6.9) 70 (7.1) 0.856[2]
Time spent in intensive care unit 2.1±3.5 2.3±4.4 0.285[4]
Time of hospitalization 11.0±11.7 12.9±18.3 0.331[4]
[1]Descriptive level of probability of Student’s t-test. [2]Descriptive level of probability of chi-square test. [4]Descriptive level of probability of Mann-Whitney U-test.
Table 5.Absolute and relative frequencies of complications according to the study group.
Complications
Original cohort (n=2688) Diabetes
P value
No (n=1,698) Yes (n=990)
Operative 60 (3.5) 35 (3.5) 0.998[1]
Perioperative acute myocardial infarction 23 (1.4) 9 (0.9) 0.304[1]
Cerebrovascular accident 21 (1.2) 21 (2.1) 0.075[1]
Acute renal failure 46 (2.7) 55 (5.6) <0.001[1]
Dialysis 11 (0.7) 22 (2.2) <0.001[1]
Infections 123 (7.2) 113 (11.4) <0.001[1]
Mediastinitis 26 (1.5) 27 (2.7) 0.031[1]
Urinary tract infection 20 (1.2) 32 (3.2) <0.001[1]
Prolonged mechanical ventilation 32 (1.9) 20 (2.0) 0.806[1]
Pneumonia 67 (4.0) 76 (7.7) <0.001[1]
Arrhythmia 292 (17.2) 171 (17.3) 0.960[1]
Death within 30 days 49 (2.9) 40 (4.1) 0.105[1]
Death within 1 year 95 (5.6) 90 (9.1) <0.001[1]
Table 6.Descriptive values [mean ± standard deviation or n (%)] of the variables after pairing according to the study group.
Paired Cohort (n=430)
Diabetes
Variables No (n=215) Yes (n=215) P value
Age 61±10 62±9 0.700[1]
Male sex 169 (78.6) 170 (79.1) 0.906[2]
Body mass index (kg/m2)
< 25 69 (32.1) 69 (32.1) 0.959[2]
25-30 117 (54.4) 115 (53.5)
>30 29 (13.5) 31 (14.4)
Dyslipidemia 94 (43.7) 115 (53.5) 0.043[2]
Chronic kidney disease 1 (0.5) 2 (0.9) 1.000[3]
Hypertension 207 (96.3) 207 (96.3) 1.000[2]
Previous stroke 4 (1.9) 2 (0.9) 0.685[3]
Peripheral arterial disease 7 (3.3) 16 (7.4) 0.054[2]
Cerebrovascular disease 4 (1.9) 4 (1.9) 1.000[3]
Prior coronary artery bypass surgery 2 (0.9) 1 (0.5) 1.000[3]
Previous acute myocardial infarction 94 (43.7) 104 (48.4) 0.333[2]
Arrhythmia 11 (5.1) 7 (3.3) 0.336[2]
Ejection fraction 67.2±9.7 65.1±12.5 0.230[1]
EuroSCORE 2.1±1.7 1.9±1.4 0.811[4]
Average blood glucose (24 hours) 170.7±27.2 192.0±32.1 <0.001[1]
Higher value of blood glucose 219.5±49.4 263.1±52.8 <0.001[1]
Use of intravenous insulin (24 hours) 39 (18.1) 63 (29.3) 0.007[2]
Time spent in the intensive care unit 2.1±4.4 1.6±0.9 0.297[4]
Time of hospitalization 11.6±19.7 9.8±10.6 0.088[4]
Surgeries 5 (2.3) 2 (0.9) 0.449[3]
Perioperative acute myocardial infarction 3 (1.4) __ 0.248[3]
Cerebrovascular accident 1 (0.5) 3 (1.4) 0.623[3]
Acute renal failure 2 (0.9) 3 (1.4) 1.000[3]
Dialysis 1 (0.5) __ 1.000[3]
Infections 14 (6.5) 16 (7.4) 0.705[2]
Mediastinitis 4 (1.9) 3 (1.4) 1.000[3]
Urinary tract infection 3 (1.4) 6 (2.8) 0.503[3]
Prolonged mechanical ventilation 2 (0.9) __ 0.499[3]
Pneumonia 6 (2.8) 6 (2.8) 1.000[2]
Arrhythmia 32 (14.9) 31 (14.4) 0.892[2]
Death within 30 days 5 (2.3) 3 (1.4) 0.724[3]
Death within 1 year 12 (5.6) 7 (3.3) 0.245[2]
[1]Descriptive level of probability by the Student’s t-test. [2]Descriptive level of probability by the chi-square test. [3]Descriptive level of probability by the Fisher’s exact test.
(P=0.02). In other analyses, Kubal et al.[15] showed that
insulin-dependent DM was associated with an increased incidence of acute renal failure (adjusted odds ratio, 4.15; P=0.002).
The predisposition of patients with DM to infectious complications after cardiac surgery has frequently been suggested by different authors[16-21] but with some exceptions[6,14,17,22], in which no trend of
incidence was detectable. The main reasons for the predisposition to the cited infections are due to the strong association between DM and angiopathy, neuropathy and hyperglycemia. Diabetic patients present an increased risk for postoperative infections due to depreciated host defense mechanisms, such as impaired as wound healing and granulocyte function, decreased cellular immunity, impaired complement function, and reduced immune response, which may be influenced by the glycemic control[20-24].
In addition to increasing the risk for postoperative infections in CABG, DM was associated with a significantly higher incidence of late mortality (up to one year) and related cardiac events. In our study, intraoperative mortality was also higher in patients with DM compared with non-diabetic patients (0.5% vs. 0%; P=0.007). Recent studies by Szabo et al.[25] e Kubal et al.[15] concur with our
findings, reporting an intrahospital mortality of 2.6% and 2.4% for their DM patient populations, respectively. However, Kubal et al.[15], after adjusting the propensity score, showed that there
was no longer a significant association between DM and hospital mortality, as in our study. Therefore, the 30-day mortality rate in our study was 4.1% in patients with DM vs. 2.9% in non-diabetic
patients (P=0.105). Similar findings were also obtained by Szabo
et al.[25], who reported a mortality rate 2.6% for DM patients vs.
1.6% for non-diabetic patients (P=0.15).
Our study did not assess subtypes of DM patients, because DM type I (DM1) may have a higher severity, as demonstrated in another study[26], in which patients with DM1 presented
a two-fold increase in the risk of death compared to that in non-diabetic patients, and DM type 2 patients had a small but significant increased risk of death than that of the same population. Another possible explanation for the null association between DM and mortality may be the low number of patients used in the comparison.
The mortality rate did not remain an independent risk factor after the propensity score analysis. In our analysis, patients with DM presented more comorbidities, such as more-severe atherosclerotic disease and more complications. Therefore, they had a more urgent indication for surgery and a significantly higher usage of extracorporeal circulation, which can contribute to a greater chance of complications after surgery.
This study had several limitations. First, this was an observational study, and we can speak of causality only in terms of association. At the time of data collection, this analysis had not been planned, and for this reason, this study was not able to evaluate the outcomes for specific types of DM. The fact that the data were collected from medical records may have affected the quality and completeness of the data, which depended on notes from health professionals. In addition, this study used a database from a single institution (one center), and although compiled by different surgical teams, this method limits the generalizability of our results.
CONCLUSION
Finally, we found that patients with diabetes were at higher risk for postoperative complications and mortality after undergoing CABG, however, in our study, diabetes did not explain the poor prognosis of these patients after pairing this factor with the propensity score.
Authors’ roles & responsibilities
KAQS
BB
AGS
FAAC
Conception and design study; realization of operations and/or trials; statistical analysis; analysis and/or data interpretation; manuscript writing or critical review of its content; final manuscript approval
Conception and design study; realization of operations and/or trials; statistical analysis; analysis and/or data interpretation; manuscript writing or critical review of its content; final manuscript approval
Manuscript writing or critical review of its content; final manuscript approval
Manuscript writing or critical review of its content; final manuscript approval
REFERENCES
1. Wild S, Roglic G, Green A, Sicree R, King H. Global prevalence of diabetes: estimates for the year 2000 and projections for 2030. Diabetes Care. 2004;27(5):1047-53.
2. Centemero MP, Cherobin JC, Conti KVF, Ohe LN, Mallmann N, Abizaid A, et al. Doença arterial coronária e diabetes: do tratamento farmacológico aos procedimentos de revascularização. Rev Bras Cardiol Invas. 2009;17(3):398-413.
3. Farkouh ME, Domanski M, Sleeper LA, Siami FS, Dangas G, Mack M, et al. Strategies for multivessel revascularization in patients with diabetes. N Engl J Med. 2012;367(25):2375-84.
4. Deb S, Wijeysundera HC, Ko DT, Tsubota H, Hill S, Fremes SE. Coronary artery bypass graft surgery vs percutaneous interventions in coronary revascularization: a systematic review. JAMA. 2013;310(19):2086-95. 5. Luciani N, Nasso G, Gaudino M, Abbate A, Glieca F, Alessandrini F,
et al. Coronary artery bypass grafting in type II diabetic patients: a comparison between insulin-dependent and non-insulin-dependent patients at short- and mid-term follow-up. Ann Thorac Surg. 2003;76(4):1149-54.
6. Van den Berghe G, Wouters P, Weekers F, Verwaest C, Bruyninckx F, Schetz M, et al. Intensive insulin therapy in critically ill patients. N Engl J Med. 2001;345(19):1359-67.
7. Kappetein AP, Head SJ, Morice MC, Banning AP, Serruys PW, Mohr FW, et al. Treatment of complex coronary artery disease in patients with diabetes: 5-year results comparing outcomes of bypass surgery and percutaneous coronary intervention in the SYNTAX trial. Eur J Cardiothorac Surg. 2013;43(5):1006-13.
9. Kannel WB. Lipids, diabetes, and coronary heart disease: insights from the Framingham Study. Am Heart J. 1985;110(5):1100-7. 10. Sá MPBO, Soares EF, Santos CA, Figueiredo OJ, Lima ROA, Escobar RR,
et al. Mortalidade perioperatória em diabéticos submetidos à cirurgia de revascularização miocárdica. Rev Col Bras Cir. 2012;39(1):22-7. 11. Pivatto Júnior F, Pereira EMC, Valle FH, Teixeira Filho GF, Nesralla IA,
Sant’Anna JRM, et al. Does diabetes mellitus increase immediate surgical risk in octogenarian patients submitted to coronary artery bypass graft surgery? Rev Bras Cir Cardiovasc. 2012;27(4):600-6. 12. Rosner B. Fundamentals of biostatistics. 2nd ed. Boston: PWS
Publishers; 1986. 584p.
13. Hosmer DW, Lemeshow S. Applied logistic regression. New York: John Wiley & Sons; 1989. 307p.
14. Adalsteinsson JA, Axelsson TA, Helgason D, Arnadottir LO, Johannesdottir H, Geirsson A, et al. Early outcome in diabetic patients following coronary artery bypass grafting. Laeknabladid. 2014;100(10):507-12.
15. Kubal C, Srinivasan AK, Grayson AD, Fabri BM, Chalmers JA. Effect of risk-adjusted diabetes on mortality and morbidity after coronary artery bypass surgery. Ann Thorac Surg. 2005;79(5):1570-6.
16. Bucerius J, Gummert JF, Walther T, Doll N, Falk V, Onnasch JF, et al. Impact of diabetes mellitus on cardiac surgery outcome. Thorac Cardiovasc Surg. 2003;51(1):11-6.
17. Crabtree TD, Codd JE, Fraser VJ, Bailey MS, Olsen MA, Damiano RJ Jr. Multivariate analysis of risk factors for deep and superficial sternal infection after coronary artery bypass grafting at a tertiary care medical center. Semin Thorac Cardiovasc Surg. 2004;16(1):53-61. 18. Fish LH, Weaver TW, Moore AL, Steel LG. Value of postoperative
blood glucose in predicting complications and length of stay after coronary artery bypass grafting. Am J Cardiol. 2003;92(1):74-6. 19. Golden SH, Peart-Vigilance C, Kao WH, Brancati FL. Perioperative
glycemic control and the risk of infectious complications in a cohort of adults with diabetes. Diabetes Care. 1999;22(9):1408-14.
20. Guvener M, Pasaoglu I, Demircin M, Oc M. Perioperative hyperglycemia is a strong correlate of postoperative infection in type II diabetic patients after coronary artery bypass grafting. Endocr J. 2002;49(5):531-7. 21. McMahon MM, Bistrian BR. Host defenses and susceptibility to
infection in patients with diabetes mellitus. Infect Dis Clin North Am. 1995;9(1):1-9.
22. Leibovici L, Yehezkelli Y, Porter A, Regev A, Krauze I, Harell D. Influence of diabetes mellitus and glycaemic control on the characteristics and outcome of common infections. Diabet Med. 1996;13(5):457-63. 23. Gallagher S, Kapur A, Lovell MJ, Jones DA, Kirkwood A, Hassan S, et al.
Impact of diabetes mellitus and renal insufficiency on 5-year mortality following coronary artery bypass graft surgery: a cohort study of 4869 UK patients. Eur J Cardiothorac Surg. 2014;45(6):1075-81.
24. Baker RA, Hallsworth LJ, Knight JL. Stroke after coronary artery bypass grafting. Ann Thorac Surg. 2005;80(5):1746-50.
25. Szabo Z, Hakanson E, Svedjeholm R. Early postoperative outcome and medium-term survival in 540 diabetic and 2239 nondiabetic patients undergoing coronary artery bypass grafting. Ann Thorac Surg. 2002;74(3):712-9.
![Table 1. Descriptive values [average ± standard deviation or n (%)] of preoperative variables according to the study group.](https://thumb-eu.123doks.com/thumbv2/123dok_br/15421279.590437/3.914.95.848.453.1053/table-descriptive-average-standard-deviation-preoperative-variables-according.webp)
![Table 4. Descriptive values [average ± standard deviation or n (%)] of postoperative variables according to the study group.](https://thumb-eu.123doks.com/thumbv2/123dok_br/15421279.590437/5.914.89.848.388.644/table-descriptive-average-standard-deviation-postoperative-variables-according.webp)
![Table 6. Descriptive values [mean ± standard deviation or n (%)] of the variables after pairing according to the study group.](https://thumb-eu.123doks.com/thumbv2/123dok_br/15421279.590437/6.914.68.823.157.1049/table-descriptive-values-standard-deviation-variables-pairing-according.webp)
