Centro de Competências de Ciências Exactas e da Engenharia
Neide Miriam Figueira Correia de Freitas
Encapsulation of Single hMSCs
in Polyelectrolyte Shells
Preliminary Studies
Tese de Mestrado em Bioquímica Aplicada
Trabalho efectuado sob a orientação da
Prof. Doutora Helena Tomás
Co-Orientador:
Prof. Doutor João Rodrigues
ACKNOWLEDGEMENTS
I am grateful to everyone that directly or indirectly contributed to the execution of this work, especially to my supervisor Prof. Helena Tomás and to my co-supervisor Prof. João Rodrigues, for the collaboration and the guidance in my research and for providing the materials and facilities for the development of this project.
My gratitude to Dr. Luís Santos, not only for all his support and guidance during the all work, but also for his friendship.
I would like to thank also to all members of Centro de Química da Madeira (CQM), for the friendship and support, not only in the lab, but also in the meetings and gatherings. Special thanks to the members of the Molecular Materials Research Group, namely to Manuel Jardim and to João Figueira for their support in the Laboratory of Chemistry of Coordination and Molecular Materials, and to Alireza Nouri for his willingness, sympathy and also for help in the lab.
I appreciated the attention and the assistance of the lab technicians (Ana Paula Tem-tem and Ana Paula Andrade) from Centro de Competências de Ciências Exactas e da Engenharia, for the supply of lab materials and reagents.
I acknowledge the University of Madeira and CQM for providing me the possibility to perform my master project.
This Master Thesis was the first research work conducted at CQM - Centro de Química da Madeira (Universidade da Madeira) which explored the LbL technique. In this context, it allowed the gaining of experience in the method and, even if many questions remained to be answered (the presented results resume the experimental work that was possible to be done in the available period of 12 months), it will certainly serve as a basis for the launching of other research works in the field at CQM. For the Student, it was an opportunity to learn how to access and analyse research literature, design a research project, interpret experimental data and communicate science. In terms of laboratory skills, the Student learned the basic techniques of animal cell culture, procedures of chemical synthesis used to label polymers with fluorescent dyes, how to use the optical inverted microscope (including the fluorescence microscope) and the microplate reader (fluorescence spectroscopy, UV/vis spectroscopy), as well as several biochemical assays used to analyse cell viability.
Work presentations in Scientific Meetings in the scope of the Master Project:
1. Neide Freitas, José L. Santos, João Rodrigues, Helena Tomás. Encapsulation of Single Mesenchymal Stem Cells in Polyelectrolyte Shells – Preliminary Results. Poster presentation in the 5th Annual International Meeting of the Portuguese Society for Stem Cells and Cellular Therapies (SPCE-TC); 20-21 May 2010; Guimarães (Portugal).
2. Neide Freitas, José L. Santos, João Rodrigues, Helena Tomás. Encapsulation of stem cells using the Layer-by-Layer technique. Oral presentation in the 5th Materials Group Meeting of CQM. 29 January 2010; Funchal (Portugal).
ABSTRACT
The main objective of this Thesis was to encapsulate single viable cells within polyelectrolyte films using the Layer-by-Layer (LbL) technique. Most of the experiments used human mesenchymal stem cells (MSCs) whose characteristics (capacity of self-renewal and potential to differentiate into several types of cells) make them particularly interesting to be used in biomedical applications. Also, most of the experiments used alginate (ALG) as the anionic polyelectrolyte and chitosan (CHI) or poly(allylamine hydrochloride) (PAH) as the cationic polyelectrolyte. Hyaluronic acid (HA) was also tested as an anionic polyelectrolyte.
At the beginning of the work, the experimental conditions necessary to obtain the encapsulation of individual cells were studied and established. Through fluorescence microscopy visualization by staining the cell nucleus and using polyelectrolytes conjugated to fluorescent dyes, it was possible to prove the obtainment of capsules containing one single cell inside. Capsules aggregation was an observed problem which, despite the efforts to design an experimental process to avoid this situation (namely, by playing with cell concentration and different means of re-suspending and stirring the cells), was not completely overcome.
In a second part of the project, single cells were encapsulated within polyelectrolyte layers made of CHI/ALG, PAH/ALG and PAH/HA and their viability was evaluated through the resazurin reduction assay and the Live/Dead assay. In these experiments, during the LbL process, polyelectrolyte solutions were used at a concentration of 1mg/mL based on literature. In general, the viability of the encapsulated cells was shown to be very low/absent.
Then, as a consequence of the lack of viability of cells encapsulated within polyelectrolyte layers, the LbL technique was applied in cells growing adherent to the surface of cell culture plates. The cells were cultured like in a sandwich, between the surface of the cell culture dish and the polyelectrolyte layers. Also here, the polyelectrolyte solutions were used at a concentration of 1mg/mL during the LbL process. Surprisingly, cell viability was also absent in these systems.
Finally, using alginate and chitosan solutions with adequate concentrations (low concentrations: 50ng/mL and 1µg/mL), the encapsulation of single viable cells was again attempted. Once again, the encapsulated cells were not shown to be viable.
In conclusion, the viability of the encapsulated cells is not only dependent on the cytotoxic characteristics (or combined cytotoxic characteristics) of the polyelectrolytes but it seems that, when detached from the culture plates, the cells become too fragile and lose their viability very easily.
RESUMO
O principal objectivo deste projecto foi o encapsulamento individual de células viáveis no interior de camadas formadas por polielectrólitos usando a técnica “Layer-by-Layer” (LbL). As células estaminais mesenquimatosas humanas foram utilizadas na maioria dos procedimentos, uma vez que apresentam características únicas de auto-renovação e diferenciação. A maioria das experiências usaram, sobretudo, o alginato (ALG) como polielectrólito negativo e o quitosano (CHI) e o poli(hidrocloreto de alilamina) (PAH) como polielectrólitos positivos. O ácido hialurónico (HA) também foi testado como polielectrólito negativo.
No início do trabalho, foram estudadas as condições experimentais para a formação de cápsulas com uma única célula no seu interior. Usando a Microscopia de Fluorescência, através da marcação com sondas fluorescentes dos polielectrólitos e dos núcleos celulares, foi possível provar que se obtiveram cápsulas com uma única célula no seu interior. Um dos problemas observados durante o processo foi a agregação das cápsulas. Apesar dos esforços desenvolvidos para desenhar um procedimento experimental que evitasse esta situação (por exemplo, variando a concentração celular e os diferentes modos de ressuspender e agitar as células), não foi possível ultrapassar completamente este problema.
Na segunda parte do trabalho, as células encapsuladas foram submetidas a testes de viabilidade, nomeadamente ao teste de redução da resazurina e ao teste “Live/Dead”. Nestas experiências, foram usadas cápsulas constituídas por CHI/ALG, PAH/ALG e PAH/HA, utilizando-se sempre uma concentração de 1mg/mL, com base em valores da literatura. Em geral, a viabilidade das células encapsuladas foi bastante baixa/nula.
Seguidamente, em consequência da baixa viabilidade obtida nos ensaios anteriores, o método foi aplicado em células aderentes a uma placa de cultura. As células foram cultivadas, como numa “sandwich”, entre a superfície da placa de cultura e as camadas de polielectrólitos. Neste procedimento, foi também utilizada uma concentração de 1mg/mL para as soluções poliméricas. Surpreendentemente, também neste caso as células não se mostraram viáveis.
Finalmente, usando soluções de alginato e quitosano com concentrações adequadas (concentrações baixas: 50ng/mL e 1µg/mL), foi novamente efectuado o encapsulamento de células individuais. Verificou-se que, tal como anteriormente, as células encapsuladas não se mantiveram vivas.
Concluindo, a viabilidade das células encapsuladas não depende apenas das características citotóxicas dos polielectrólitos (ou da combinação das suas características citotóxicas), mas parece que, uma vez retiradas da superfície da placa de cultura, as células ficam demasiado frágeis e perdem a sua viabilidade muito facilmente.
CONTENTS
ACKNOWLEDGEMENTS ... i
ABSTRACT ... iii
RESUMO ... v
LIST OF ACRONYMS ... x
LIST OF FIGURES ... xi
LIST OF TABLES ... xv
CHAPTER 1 – Introduction ... 1
1.1 The Layer-by-layer technique ... 1
1.2 Cell Encapsulation ... 3
1.3 Encapsulation of single cells via the Layer-by-layer technique ... 5
1.4 Polyelectrolytes used in the LbL technique (special emphasis for those used in the Thesis) ... 7
1.4.1 ALGINATE AND CHITOSAN ... 8
1.4.2 HYALURONIC ACID ... 11
1.4.3 COLLAGEN ... 12
1.4.4 POLY(ALLYLAMINE HYDROCHLORIDE) ... 14
1.5 Mesenchymal Stem Cells (MSCs) ... 14
1.6 Objectives & General Strategy of the Thesis ... 16
CHAPTER 2 – Materials and Methods ... 20
2.1 Cells and cell culture ... 20
2.2 Equipments, materials and reagents ... 20
2.3 Preparation of solutions ... 21
2.4 Alginate and chitosan fluorescent labelling ... 22
2.5 Cell encapsulation ... 23
2.7.1 Live/Dead Assay ... 26
2.7.2 MTT reduction assay ... 28
2.7.3 Resazurin reduction assay ... 28
2.8 Cells cultured over the 2D-surface of the cell culture dish but under polyelectrolyte layers – evaluation of cell viability ... 30
2.9 Evaluation of the polymers cytotoxicity ... 31
CHAPTER 3 – Results and Discussion ... 32
3.1 Establishment of the best experimental conditions to obtain the encapsulation of single cells ... 32
3.2 Evaluation of the viability of cells encapsulated within CHI/ALG bilayers ... 36
3.3 Evaluation of the viability of cells encapsulated within PAH/ALG bilayers . 38 3.4 Evaluation of the viability of cells encapsulated within PAH/HA bilayers .... 41
3.5 Evaluation of the viability of cells cultured over the 2D-surface of the cell culture dish but under polyelectrolyte layers ... 43
3.6 Evaluation of polyelectrolyte cytotoxicity ... 49
3.7 Cell encapsulation using polyelectrolyte solutions of lower concentration . 56 Chapter 4 – General Conclusions ... 58
REFERENCES ... 59
Credits List ... 70
APPENDICES ... 71
Animal cell culture (technical aspects) ... 71
1.1 Introductory aspects ... 71
1.2 Cell Culture ... 73
1.2.1 Primary Culture and Subculture, Primary Explant ... 77
1.2.2 Cell Lines ... 80
1.2.3 Cell Growth Curve ... 81
1.2.4 Cell Medium ... 82
1.2.5 Cell Counting ... 83
1.3 Aseptic technique ... 84
1.4.1 Autoclave ... 85
1.4.2 Laminar flow hood ... 86
1.4.3 CO2 Incubator ... 87
1.5 Cryopreservation ... 87
1.6 Inverted Fluorescence Microscope ... 88
References ... 90
LIST OF ACRONYMS
ALG – Alginate
ALS - Amyotrophic Lateral Sclerosis
CHI – Chitosan
DAPI – 4',6-diamidino-2-phenylindole
DASPMI - Dimethylaminostyrylmethylpyridiniumiodine
DTAF – Fluorescein dichlorotriazine
D-pepep - Dimethylpepep
ESCs - Embryonic stem cells
FDA – Fluorescein diacetate
HA – Hyaluronic acid
HBSS - Hank's Balanced Salt Solution
hMSCs – human Mesenchymal Stem Cells
LbL – Layer-by-layer
MMW – Medium molecular weight
MW – Molecular weight
MTT – (3-(4,5-dimethylthiazol-2-yl)-2,5-diphenyltetrazolium bromide)
PAH – Poly (allylamine)-hydroclroride
PBS – Phosphate Buffered Saline
PI – Propidium iodide
PLL – Poly-L-Lysine
PSS – Poly(sodium 4-styrenesulfonate)
LIST OF FIGURES
Figure 1 - Schematic of polyelectrolyte capsule fabrication by layer-by-layer (LbL) assembly
[4]. ... 3
Figure 2 - Schematic representation of conjugating nanoparticles to bone marrow-derived MSCs via high molecular weight polyelectrolyte chains: poly-L-lysine, chitosan and hyaluronan [68]. ... 6
Figure 3 - Schematic illustration of the encapsulation process [13]. ... 7
Figure 4 - Alginate and Chitosan structures [8]. ... 9
Figure 5 - Alginate composition: A - Mannuronic acid residues chain; B - Guluronic acid residues chain; C - both residues (randomly) [80]. ... 10
Figure 6 - Scheme showing the deacetylation of chitin to produce chitosan. The deacetylated units are marked with a purple circle; the acetyl group is marked with a blue circle and the acetylated units with a green one. ... 11
Figure 7 - Hyaluronic acid structure. ... 12
Figure 8 - Collagen structure. ... 13
Figure 9 - Poly(allylamine hydrochloride) structure (Mw~56,000Da). ... 14
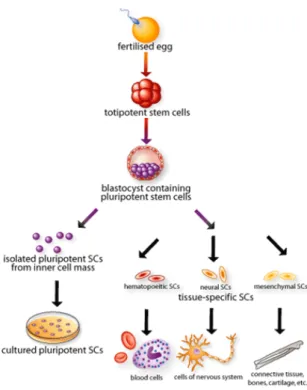
Figure 10 - The origin, isolation, and specialization of stem cells. ... 15
Figure 11 - Culture-expanded human mesenchymal stem cells exhibit a spindle-shaped fibroblastic morphology following culture expansion ex vivo. Under appropriate inducing conditions, the culture will demonstrate adipogenic differentiation, chondrogenic differentiation or osteogenesis [99]. ... 16
Figure 12 - General strategy followed in the work. ... 19
Figure 13 - DTAF structure [107]. ... 24
Figure 14 - RITC structure. ... 25
Figure 15 - Left: DAPI structure; Right: DAPI bounded to DNA. ... 25
Figure 16 - Fluorescence excitation and emission profiles of DAPI bound to dsDNA [110]. ... 26
Figure 17 - FDA (on the left)) and PI (on the right) structures. ... 27
Figure 18 - Confocal images of rat lung slice co-stained with the LIVE/DEAD® viability/cytotoxicity assay kit for animal cells [113]. ... 27
Figure 19 - MTT is reduced to formazan (s) by a mitochondrial reductase. ... 28
Figure 20 - Conversion of resazurin to resorufin by metabolically active cells results in the generation of a fluorescent product [114]. ... 29
Figure 21 - The CellTiter-Blue® Cell Viability Assay protocol [114]. ... 30
Figure 33 - Evaluation of the viability of hMSCs cultured under 1 (A) and 2 (B) bilayers of PAH/ALG using the Live/Dead assay after 0h, 1 day, 3 days and 7 days in culture. Dead
cells are red and live cells are green under the fluorescence microscope. ... 47
Figure 34 - Evaluation of the viability of hMSCs cultured under 4 (C) bilayers of PAH/ALG using the Live/Dead assay after 0h, 1 day, 3 days and 7 days in culture. Dead cells are red and live cells are green under the fluorescence microscope. ... 48
Figure 35 - Bright field images of cells cultured under 2 (A) and 4 (B) bilayers of PAH/ALG. The skinny arrows exemplify the nuclei of the cells and thick ones the extracellular membrane. ... 48
Figure 36 - Effect of polyelectrolyte concentration on hMSCs viability (“dose-effect” studies) obtained through the resazurin reduction assay. Cell viability was analysed along 7 days. The value of RFU for control is highlighted with a pink circle. The same control was used for the three polymers study, thus there is an overlap of values. ... 52
Figure 37 - Effect of PAH concentration on hMSCs viability obtained through the Live/Dead assay. Cell viability was analysed along 7 days. Red cells are dead; green cells are alive. ... 53
Figure 38 - Effect of ALG concentration on hMSCs viability obtained through the Live/Dead assay. Cell viability was analysed along 7 days. Red cells are dead; green cells are alive. ... 54
Figure 39 - Effect of CHI concentration on hMSCs viability obtained through the Live/Dead assay. Cell viability was analysed along 7 days. Red cells are dead; green cells are alive. ... 55
Figure 40 - Evaluation of the viability of hMSCs encapsulated within 1 bilayer of CHI/ALG using the Live/Dead assay after 0h, 1 day and 3 days in culture. Experiments were done with solutions with concentrations of CHI and ALG of 50ng/mL and 1µg/mL. Red cells are dead. ... 57
Figure 41 - Cell culture. The cells spread over the Petri dish surface. ... 73
Figure 42 - Substrate-cell and cell-cell interactions. ... 74
Figure 43 - Cell Cycle phases. ... 74
Figure 44 - Mitosis phases. ... 75
Figure 45 - Mitosis of a fibroblast (skin cell). ... 75
Figure 46 - Scheme about Culture of animal cells. ... 78
Figure 47 - Schematic procedure of an explants (human bronchial epithelial cells grown from explants). ... 79
Figure 48 - How can a cell line be derived? ... 80
Figure 51 - Neubauer chamber. ... 84
Figure 52 - Scheme where it is possible to see the counting area. The blue cells are non-viable (when stained with trypan blue, and visualized in a Microscope), the other ones are viable [6]. ... 84
Figure 53 - Autoclave Equipment. ... 86
Figure 54 - Laminar Flow Chamber. ... 87
Figure 55 - Incubator representation. ... 87
Figure 56 - N2 (l) bottle. ... 88
LIST OF TABLES
CHAPTER 1 – INTRODUCTION
1.1 The Layer-by-layer technique
The classical layer-by-layer technique (LbL) was proposed by G. Decher in 1997 [1] and is based on the alternating adsorption of oppositely charged species (usually polyelectrolyte species) onto a charged template which can be a surface (2-dimensional template) or a particle (3-dimensional template; usually, a nano or microparticle). The process is illustrated in Figure 1 using a 3-dimensional template. Basically, for a positive template, the process begins with the initial electrostatic adsorption of a negatively charged polymer, followed by the adsorption of a positively charged one [2-31]. By repeating this procedure, a multilayer growth is possible, thus creating a film or a shell over the template with precision of thickness and roughness of less than 1 nm [2, 32].
The driving force of multilayer assembly has been extended to non-electrostatic interactions, including hydrogen bonding, covalent bonding, hydrophobic interactions, between others [3, 33-36]. The creation of multilayered polymer structures is a very versatile process and depends on the ability of the charged species to be adsorbed onto the top of an oppositely charged layer [1, 3-5, 37, 38]. Therefore, the templates and the polyelectrolyte pairs are very important components in the layer-by-layer technique [1, 3-5, 37, 38].
ethanol, which makes the shell permeable to larger molecules (“permeability regulation” technique) [27, 47]. Other reagents can be used for core template dissolution, such as: tetrahydrofuran (THF), hydrochloric acid (HCl) and hydrofluoric acid (HF) [4, 27, 30]. The hollow capsules wall properties, like thickness, permeability, stability and biocompatibility can be designed and adjusted, as it is desired [5, 7, 24, 36, 38, 48].
These hollow capsules have attracted interest to be used as encapsulation systems, for example, as drug carrier systems (for instance dexamethasone [49, 50], insulin, vitamin K3 [51]), reaction vessels and nanoreactors (to prepare organic/inorganic hollow materials) [3, 15, 26, 27, 30, 38, 40, 43, 45, 48, 52], catalysis [3, 5, 26, 30, 36] and biosensing [5].
Other applications of hollow capsules include tools for implants and diagnostics [5]. Sometimes, a serious problem arises: the cytotoxicity of polyelectrolytes or of their metabolic products, after degradation [53, 54].
According to the literature, the polyions’ functional groups influence the cytotoxicity [54]. However, the literature also refers that there is a strong difference in toxicity if the polymer is inside the cell [54] or is only in contact with the membrane [55]. So, the same polyelectrolyte can induce both cell death or provide the adhesion of the cells to surfaces [55]. Furthermore, the investigations of de Rosa et al. [55] gave evidence that the surface charge also plays a crucial role in cell survival and adhesion of cells.
Thanks to versatility of this technique, the two compartments of the capsules (shells and cavity) can be easily manipulated in order to create different types of systems, according to the specific requirements for a certain application [56, 57]. Compared to other traditional strategies, the LbL adsorption technique is an easy and inexpensive process for multilayer formation, and allows the incorporation of different types of materials in the film structures. Thus, this method can be regarded as a versatile bottom-up nanofabrication technique [57].
Figure 1 - Schematic of polyelectrolyte capsule fabrication by layer-by-layer (LbL) assembly [4].
1.2 Cell Encapsulation
Cell encapsulation has the goal of entrapping viable cells within semi-permeable ‘membranes’, which should be permeable for transport of molecules essential for cell survival [59-61]. This membrane must protect the inner cells from both mechanical stress and host’s immune system, while allowing the diffusion of oxygen, nutrients and waste [59, 62].
Bioencapsulation is a great method to create the appropriate interaction between cells and the microenvironment, leading to desired assemblies [6, 63]. Depending on the choice of material to create the capsule, and whether membranes are prefabricated or fabricated around viable cells, the cells will be submitted to different entrapment conditions [60]. An optimal equilibrium must be maintained among the several capsule properties to hold cell survival in a certain set of experimental conditions. As different types of cells have different metabolic requirements, the permeability of the capsules can depend on the choice of the cells [60]. In this way, the microenvironment of the all system can mimic the extracellular matrix or the culture conditions, where the cells to be encapsulated normally live [62].
Parkinson’s disease [59, 64], kidney failure [60, 64], hepatic failure [59] and amyotrophic lateral sclerosis (ALS) [64]. Other applications are related to cartilage replacement [59, 64], construction of replacement heart [64] and urinary valves [64], and artificial organs [62, 64].
The cell encapsulation systems are also denominated as “immunoprotective devices”, which means that these systems can protect the cells from immunodestruction caused by host antibodies and T-cells [60, 62, 64]. Encapsulation is not only a method for supporting/immobilizing and protecting cells, but can be also used has a vehicle for drug delivery. Each of these applications demands materials with specific physical, chemical, biomechanical, biological and degradation properties to provide an efficient therapy [59]. These encapsulation devices can constitute physically environments for study and control of biochemical processes [7, 12, 42, 63, 65].
Several methods for cell encapsulation, entrapment and coating within polymers and hydrogels have been investigated in the past. Beyond the LbL method, there are many others: “Gelation” or solidification, “Chemical Crosslinking”, “Ionic Crosslinking”, “Formation of an insoluble complex”, “One-stage Process”, between others [64].
There are two different strategies for cell encapsulation: (i) microencapsulation and (ii) macroencapsulation. The first one is defined as the involucre of individual cells or small cell aggregates in a semipermeable membrane while the second corresponds to the utilization of hollow materials to deliver bigger aggregates of cells or multiple cells. The microencapsulation systems are usually small in its size and they are not taken from the patient, the devices are eliminated by the kidneys or by alternative ways. The macroencapsulation, on the other hand, has a superior mechanical integrity, but the obtained structures are not available for transport. Besides, these systems have a big disadvantage, because they can create problems from host proteins aggregating on their surfaces [60, 64].
1.3 Encapsulation of single cells via the Layer-by-layer technique
The LbL technique can be very useful and attractive for cell encapsulation applications, because it requires mild conditions and can be combined with shells functionalization [6, 67]. In particular, the encapsulation of living single cells inside polyelectrolyte layers can be very challenging has recognized by the few papers that were published in this subject.
Alberto Diaspro and his colleagues [12] used the LbL method to encapsulate single yeasts (Saccharomyces cerevisiae, the common baker’s yeast). Their goals were to encapsulate living yeasts inside polymeric shells (made by poly(allylamine hydrochloride), PAH, and poly(sodium styrene sulfonate), PSS), using the LbL method. They used the fluorescent lipophilic cationic dye dimethylaminostyrylmethylpyridiniumiodine (DASPMI) to verify the metabolic activity of the yeasts and the Flow Cytometry technique to check the efficiency of cell encapsulation. They concluded that the polyelectrolyte coating didn’t influence cell metabolism and, in addition, that yeasts could even suffer division.
T. Svaldo-Lanero and his co-workers [14] also used yeasts (Saccharomyces cerevisiae) and the LbL technique for encapsulation. They studied yeasts viability, mechanical properties and duplication capability, when encapsulated in polymeric shells made of PAH and PSS. To evaluate cell viability, they used dimethylpepep (D-pepep), a red dye which stains nuclear and mitochondrial DNA in living cells. In their study, they concluded that the internal cell structure was preserved and the duplication capability was verified.
The encapsulation of animal cells using the LbL technique was also attempted. Nalinkanth G. Veerabadran and his co-workers [6] reported the encapsulation of rat Mesenchymal Stem Cells (MSCs) by using the LbL method. The polyelectrolyte shells were made of hyaluronic acid and poly(L-lisine). In this study, they demonstrated the ability to individually encapsulate animal cells within polymeric shells, as well as their capacity to survive until 7 days (by the MTT assay and the two-colour fluorescence Live/Dead Assay, assays that were also used in the present Master thesis). Before encapsulation, the PLL/HA capsules were characterized using Atomic Force Microscopy (AFM), ζ-potential measurements, Crystal Microbalance (QCM) monitoring and contact-angle measurements.
A very recent publication of Boon C. Heng and co-workers [68] described the partial coating of MSCs with polyelectrolytes (Figure 2). It is known that the binding of nanoparticles directly to the cell membrane can influence the cellular function by obstructing cell surface receptors. So, their goals were to investigate the use of polymer bilayers (hyaluronan (HA), poly-L-lysine(PLL) and chitosan (CHI); several concentrations were tested) to bind nanoparticles to MSCs, thus they developed a technique to obtain only half of the cell surface conjugated with nanoparticles via polyelectrolyte chains. They investigated both PLL/HA and CHI/HA pairs (used to create the polyelectrolyte bilayers) and verified that the best results were obtained by the chitosan/hyaluronan pair.
Furthermore, they investigated the re-attachment and proliferation of the trypsin-dissociated nanoparticle-conjugated MSCs. They concluded that they were able to re-attach and proliferate cells over a period of 7 days after the freeze-thawing process.
However, nanoparticles distribution was not uniform among the daughters.
Figure 2 - Schematic representation of conjugating nanoparticles to bone marrow-derived MSCs via high molecular weight polyelectrolyte chains: poly-L-lysine, chitosan and hyaluronan [68].
the capsules were impermeable to DNA and HSA at the beginning (a) but, during drying, the permeability was ‘switched on’ and both compounds accumulated in the capsule interior and precipitated upon total drying (b, c); after re-suspension, the filled capsules were impermeable again (d) (Figure 3).
Figure 3 - Schematic illustration of the encapsulation process [13].
1.4 Polyelectrolytes used in the LbL technique (special emphasis
for those used in the Thesis)
A polymer is a large molecule composed by repeating structural units, usually linked by covalent bonds. They can be synthetic for instance, such as polystyrene, PVB, PVC [69], between others, or called biopolymers, which include polysaccharides, polypeptides and polynucleotides [13, 42, 47, 56, 58, 61, 70-72]. Polymers can work as polyelectrolytes - species with charged or chargeable groups, when dissolved in polar solvents [73].
Additionally, these materials can be divided into those where the charge density depends on pH (weak polyelectrolytes) and those for which the charge density is independent of pH (strong polelectrolytes) (see examples in Table 1) [64].
In the biomedical area, many polymers have been investigated, like PAH, PSS, HA, PLL, CHI, alginate (ALG), between others (see examples in Table 1) [5, 9, 31, 58, 64, 74].
The capsules can also, beyond polysaccharides, polypeptides and polynucleotides, be made by lipids, dyes and inorganic nanoparticles, proteins [11, 13, 25, 28, 29, 33, 39, 40, 42, 43, 45-48, 58, 74, 75]. The capsule wall composition has a relevant role for the creation of functional capsules, because their permeability depends on the chemical structure and the molecular weight of the polyelectrolyte layers [4].
Table 1 - Characteristics of some polyelectrolytes used for cell encapsulation [64].
System Notes Alginate Strong polyanion
Carrageenan Strong polyanion
Poly(styrene sulfonate) Strong polyanion
Carboximethylcelluose Polyanion Cellulose sulphate Polyanion
Heparin Polyanion Poly(methylene-co-guanidine) Polyanion
Poly(diallyldimethyl ammonium chloride) Strong polyanion
Chitosan Weak polycation, pKa of primary amine 6,3 – 6,8
Poly(L-lysine) Weak polycation, pKa of primary amine ~10,5
Poly(allylamine) Hydrochloride Weak polycation, pKa of amine group ~8,5
Poly(vinylamine) Hydrochloride Weak polycation
1.4.1
ALGINATE AND CHITOSAN
Since 1998, polyelectrolyte microcapsules have attracted a great interest, because their properties, including size, composition, shape, thickness, permeability, stability and stiffness can be tailored easily [7, 33, 37, 47, 56]. Polysaccharides are particularly used due to their hydrophilic and protective properties and to their biodegradable and compatible capacities as well [30, 61, 76].
The negatively charged carboxylic acid groups of manuronic and guluronic acid units present in alginate molecule can interact electrostatically with the positively charged amino groups of chitosan, producing a polyelectrolyte complex. Alginate is one of the most studied anionic polyelectrolytes in assemble with chitosan, because the formed complex is still biodegradable and biocompatible [76, 79].
Figure 4 - Alginate and Chitosan structures [8].
Alginate is an anionic polymer obtained from marine brown algae [8, 61, 79]. It is a linear binary copolymer composed by two kinds of residues: (1J4)−linked
Figure 5 - Alginate composition: A - Mannuronic acid residues chain; B - Guluronic acid residues chain; C - both residues (randomly) [80].
Chitosan (Figure 6) is a natural cationic polymer obtained from the deacetylation of chitin (a copolymer of β(1→4) linked N-acetyl-D-glucosamine [81]) [8, 30, 65, 79, 82, 83], which is a product found in crustacean shells [30, 65, 68, 76, 81, 83]. In this reaction (made by chitin-deacetylase enzyme), some units of chitin lost their acetyl group, creating deacetylated units. So, it is a linear binary copolymer composed by β-(1-4)-D-glucosamine (deacetylated unit) and N-acetyl-D-glucosamine (acetylated unit). Both residues are randomly distributed along the chitosan chain [65, 76, 79, 84].
Figure 6 - Scheme showing the deacetylation of chitin to produce chitosan. The deacetylated units are marked with a purple circle; the acetyl group is marked with a blue circle and the acetylated units with a green one1.
Chitosan shows great biological properties such as: biocompatibility, biodegradation in the human body, and immunological, antibacterial and wound-healing activity. In recent studies, chitosan has shown capacities to be used as a support material for many applications: gene delivery, cell culture, and tissue engineering. Therefore, chitosan is receiving a huge attention as a new functional material [65, 79, 81, 82, 85, 86].
1.4.2
HYALURONIC ACID
Hyaluronic acid (HA) is also a polysaccharide. It is a glycosaminoglycan (GAG), because one of the sugars used in its structure is modified with an amino group (-NH2). It is a polymer of disaccharides, themselves composed by D-glucuronic acid and D-N-acetylglucosamine, linked together via alternating β-(1,4) and β-(1,3) glycosidic bonds (Figure 7) [6, 15, 87]. HA is present in almost all biological tissues and body fluids. HA presents important physiological functions in living organisms, which make it an attractive biomaterial for many medical purposes [87]. It presents a good biocompatibility and biodegradability, therefore, it can be used for several drug delivery applications [15].
1
The references of all figures are presented in the Credits List (at the end of this thesis), except for those which were taken
Figure 7 - Hyaluronic acid structure.
In clinical medicine, HA is used as a diagnostic marker for many diseases, such as rheumatoid arthritis, cancer and liver disorders. It is also used in ophthalmological and ontological surgeries and cosmetic regeneration and reconstruction of tissue. This polymer can immobilize water in tissue and change dermal volume and compressibility. It can also influence cell proliferation, differentiation, and tissue repair, between other biological functions [87].
1.4.3
COLLAGEN
Collagen represents the most common structural protein in the vertebrate body (approximately 30%). There are at least 13 types of collagen, which have been isolated in respect to the length of the helix and the nature and size of the non-helical areas (Table 2) [88].
Type I collagen is the most found in animals, namely in the skin, tendon, and bone. Structurally, it is a compound of three chains, two of which are identical: α1(I), and one α2(I) chain with different amino acid composition. Basically, the collagen molecule contains three polypeptide α-chains, each with more than 1000 amino acids (Figure 8) [88].
Table 2 - Chain composition and body distribution of collagen types [88].
Collagen
Type Chain composition Tissue distribution
I (α1(I))2α2(I), trimer (α1(I))3
Skin tendon, bone, cornea, dentin, fibrocartilage, large vessels, intestine, uterus, dermis
II (α1(II))3
Hyaline cartilage, vitreous, nucleus pulposus, notochord
III (α1(III))3
Large vessels, uterine wall, dermis, intestine, heart valve, gingival (usually coexists with type I except in bone, tendon, cornea)
IV (α1(IV))2α2(IV) Basement membranes V α1(V)α2(V)(3(V)) or
(α1(V))2α2(V) or (α1(V))3
Cornea, placental membranes, bone, large vessels, hyaline cartilage, gingiva
VI α1(VI)α2(VI)α3(VI) Descemet’s membrane, skin, nucleus pulposus, heart muscle
VII (α1(VII))3 Skin, placenta, lung, cartilage, cornea VIII
α1(VIII) α2(VIII) chain organization of helix
unknown
Produced by endothelial cells, Descemet’s membrane
IX α1(IX)α2(IX)α3(IX) Cartilage
X (α1(X))3 Hypertrophic and mineralizing cartilage XI α 1α2α3α1 or
1(XI)α2(XI)α3(XI)
Cartilage, intervertebral disc, vitreous humour
XII (α1(XII))3
Chicken embryo tendon, bovine periodontal ligament
XIII Unknown Cetal skin, bone, intestinal mucosa
1.4.4
POLY(ALLYLAMINE HYDROCHLORIDE)
The PAH (poly(allylamine hydrochloride)) is another polyelectrolyte which can be used in the encapsulation field [8-10, 58, 64]. The PAH, also denominated as PAA or PAAH is a cationic polyelectrolyte prepared by the polymerization of allylamine (Figure 9) [10].
Figure 9 - Poly(allylamine hydrochloride) structure (Mw~56,000Da).
The PAH is one of the most used polymer for the fabrication of capsules [10-14, 70]. In particular, PAH has been used as a model cationic polyelectrolyte for DNA and proteins for preparation of hollow microcapsules using the Layer-by-layer method [89].
It is a weak polycation, with a pKa of amine group ∼ 8.5 [64, 90, 91]. Being a weak polycation, the change of pH or ionic strength will alter the PAH conformation [64, 92, 93].
Not only the conformation, but also the thickness (of the layers or capsules made by this polymer) is sensitive to solution pH, due to the fact that the charge density of a weak polyelectrolyte can be varied by the changing of pH. The PAH is positively charged at low and neutral pH, but at high pH, it leads to the dissociation of H+ ions and forms a structure with uncharged amine groups [94].
1.5 Mesenchymal Stem Cells (MSCs)
Figure 10 - The origin, isolation, and specialization of stem cells.
These cells are usually classified in embryonic stem cells (ESCs) and adult stem cells. The first ones are pluripotent due to their capability to origin all kinds of cells. The ESCs can be obtained from the early mammalian embryo at the blastocyst stage and using specific culture conditions, they have the capacity to expand unlimited in vitro and differentiate. On the other hand, adult stem cells are multipotent and are derived from many tissues such as bone, brain, adipose tissue, umbilical cord blood, blood vessels, blood, between others [95, 97].
The “mesenchymal stem cells” (a term used by Arnold Caplan for the first time in 1991) often receive other designations such as “marrow stromal cells”, “precursors of non-hematopoietic tissue”, “colony forming unit fibroblasts” or “multipotent adult progenitor cells” [98]. MSCs are multipotent adult stem cells, nonhematopoietic which can be derived from mesoderm and neuroectoderm. This cell type can be found in most postnatal organs and tissues, namely in the bone marrow (BM). They are able to differentiate not only into cells of mesodermal origin such adipocytes, chondrocytes, osteocytes (Figure 11), tenocytes, skeletal and myocytes, but also into representative lineages of the three embryonic layers, such as neurons (from ectoderm) and hepatocytes (from endoderm) [97, 99-101].
present an optimal expansion potential and genetic stability; there are well established protocols for their isolation and new sources keep on showing up, beyond the already existing ones. In addition, MSCs are able to migrate to areas of tissue damage in immune privileged conditions, presenting immunosuppressive properties. All these advantages have provided many successful MSCs transplantations [97, 99, 100]. Other applications are bone, cartilage, tendon and skeletal muscle repair [101].
Figure 11 - Culture-expanded human mesenchymal stem cells exhibit a spindle-shaped fibroblastic morphology following culture expansion ex vivo. Under appropriate inducing conditions, the culture will demonstrate adipogenic differentiation, chondrogenic differentiation or osteogenesis [99].
1.6 Objectives & General Strategy of the Thesis
Figure 12 shows the general strategy followed in the present Thesis. First, the experimental conditions necessary to obtain the encapsulation of individual cells were studied and established.
Several type of cells were used in these studies (NIH 3T3, rMSCs and hMSCs) and polyelectrolyte solutions of 1mg/mL (this concentration was chosen based on literature) were used in the encapsulation process. Single cell encapsulation was assessed by fluorescence microscopy.
Second, the viability of cells encapsulated within CHI/ALG layers was evaluated (assessed both by the resazurin reduction assay and the Live/Dead assay) and, as the results were not satisfactory, cells were also encapsulated the pairs of polyelectrolytes PAH/ALG and PAH/HA. NIH 3T3 and hMSCs were used in these experiments, together with polyelectrolyte solutions of 1mg/mL.
Once again, cell viability was very low/absent. The LbL technique was then applied in cells growing adherent to the surface of cell culture plates. The cells (hMSCs) were cultured like in a sandwich, between the surface of the cell culture dish and the polyelectrolyte layers made of PAH/ALG. Also here, the polyelectrolyte solutions were used at a concentration of 1mg/mL during the LbL process. Surprisingly, cell viability was also absent in these systems. This set of results pointed out the need for a systematic study (dose-effect study) concerned with the evaluation of the effect of the concentration of the individual polyelectrolytes (ALG, CHI and PAH were studied) in cell viability. Experiments were performed using cells (hMSCs) growing adherent to the surface of cell culture plates and polyelectrolyte concentrations varying from 0 to 500µg/mL. As a conclusion from these studies, very high (cytotoxic) concentration of polyelectrolytes had been in use. Also, in general, PAH was much more cytotoxic than CHI, whereas ALG was the less cytotoxic polyelectrolyte. So, as a last experiment, alginate and chitosan solutions with adequate concentrations (low concentrations: 50ng/mL and 1µg/mL), were applied in the encapsulation of single hMSCs. Once again, the encapsulated cells were not shown to be viable.
Cells in CHI/ALG capsules CHI/ALG 1mg/mL MTT assay Resazurin method Live/Dead Assay NIH 3T3 cells
hMSCs
CHI/ALG
1mg/mL
Cells in PAH/ALG capsules
hMSCs
PAH/ALG
1mg/mL Resazurin method
Live/Dead Assay
Cells in PAH/HA capsules
hMSCs
PAH/HA
1mg/mL
Cell viability problems
Resazurin method
Live/Dead Assay
New
Strategy
3 Evaluation of cell
viability
2 Establishment of the best experimental conditions
to obtain the encapsulation of single cells in CHI/ALG capsules
NIH 3T3 cells
rMSCs
hMSCs
1
+
Figure 12 - General strategy followed in the work. Cells cultured in the 2D surface of the culture plate and below polyelectrolyte
layers hMSCs
PAH/ALG
1mg/mL
Cell viability problems
Evaluation of polyelectrolyte cytoxicity (dose-effect studies)
hMSCs
PAH/CHI/ALG
0ng/mL-500µg/mL
Need to use ↓[polyelectrolyte]
Encapsulation of cells in CHI/ALG capsules (again)
Cell viability problems hMSCs
CHI/ALG
50ng/mL
1µg/mL
4
5
Resazurin method
Live/Dead Assay Resazurin method
Live/Dead Assay
Resazurin method
CHAPTER 2 – MATERIALS AND METHODS
2.1 Cells and cell culture
Fibroblasts (NIH 3T3) and mesenchymal stem cells (MSCs) derived from the bone marrow of rats and humans were used in the experiments. The NIH 3T3 cell line was gently offered by INEB (University of Porto). Rat MSCs were isolated from the femora of 8-week-old male Wistar rats (Charles River Laboratories, Spain). Following euthanasia by pentobarbital 20% (v/v), the bones were aseptically excised, cleaned of soft tissue, and washed in a saline solution. The bone metaphyseal ends were cut off and the marrow was flushed out from the mid shaft with α-Minimum Essential Medium (α-MEM) using a syringe.
The human cells were isolated from the bone marrow present in the trabecular bone of healthy adults which was obtained during surgery interventions after trauma. Only tissue that would have been discarded was used, with the approval of the Ethical Local Committee. After establishment of a primary culture and expansion of the cells in culture (cell passages were done using trypsin-EDTA from GIBCO®), cells were frozen using the standard procedures [66]. After, when needed, cells were thawed and placed in culture also using the normal procedures [66].
All cell cultures were incubated at 37ºC, in a humidified atmosphere of 95% air and 5% carbon dioxide. NIH 3T3 cells were cultured in D-MEM (by GIBCO®) and the MSCs (both from rat and human origin) were cultured in α-Minimum Essential Medium Eagle (α -MEM, GIBCO®) with 10% Fetal Bovine Serum (FBS, GIBCO® ) and 2% of an antibiotic-antimycotic solution (GIBCO®, with 10,000 units penicillin/ml, 10mg streptomycin/ml and 25μg amphotericin B/ml). All cell culture dishes were from NUNC.
2.2 Equipments, materials and reagents
The dialysis membranes were from Spectrum®labs and the filters used for solution sterilization were from VWR™ with a pore size of 0.22µm.
Five different polymers were used in this work: alginate (MMW (50-120kDa), SIGMA®); chitosan (85% deacetylated, SIGMA®), PAH (MW ∼ 56000Da, Aldrich®), hyaluronic acid (MW=1.63x10⁶kDa, BioChemika®,) and collagen (Native Calf Skin Collagen Type I, IBFB, Germany).
PBS (GIBCO®, without calcium or magnesium), calcium chloride (ACROS®), magnesium chloride (MERCK®), magnesium sulphate (MERCK®), potassium chloride (Riedel-de Haën®), potassium phosphate monobasic (MERCK®), sodium bicarbonate (MERCK®), sodium chloride (MERCK®), sodium phosphate dibasic (Riedel-de Haën®), glucose (MERCK®), acetic acid (Riedel-de Haën®), EDTA (MERCK®) were used in the preparation of several solutions during the experimental work.
DAPI (SIGMA®), DTAF (SIGMA-ALDRICH®) and RITC (FLUKA®) were used in the staining procedures.
The methods applied in the evaluation of cell viability used resazurin (ALDRICH®), the MTT reagent (SIGMA®), PI (SIGMA-ALDRICH®) and FDA (SIGMA®).
2.3 Preparation of solutions
The polymeric solutions (of alginate, PAH and HA) were prepared in NaCl 0.15M at 1mg/mL. The pH of each of these solutions was between 7 and 8 (alginate: pH=7.4; PAH: pH=7.2; HA: pH=7.28). The CHI was dissolved (1%) (w/v) in a solution containing acetic acid (0.1M) and NaCl (0.15M). The CHI was allowed to dissolve overnight with a gentle stirring. Then, the pH of the solution was adjusted to 4.1 (without suspended particles formation) and the solution was filtrated under vacuum. All the polymer solutions were sterilized (with a 0.22 µm membrane and a syringe, inside the laminar flow chamber) and kept in the fridge at 4ºC. All the glassware and other materials were sterilized in an autoclave, to avoid any kind of contamination.
The collagen was prepared from a mother solution (2mg/mL, prepared in 0.1M acetic acid) using a NaCl solution (0.15M) and sterilized as well, with a final concentration of 100µg/mL.
solution, 20mL of serum and 178mL of α-MEM (stock). This mixture was maintained in the fridge at 4ºC.
For the Phosphate Buffered Saline (PBS) solution preparation, 9.55g of PBS powder was dissolved in 1L of distilled water. The pH was checked and the solution was sterilized.
The Hank’s Balanced Salt Solution (HBSS, 1x) was prepared by adding the following reagents (with their final concentrations in solution): calcium chloride (140mg/mL); magnesium chloride (100mg/mL); magnesium sulphate (100mg/mL); potassium chloride (400mg/mL); potassium phosphate monobasic (60mg/mL); sodium bicarbonate (350mg/mL); sodium chloride (8000mg/mL); sodium phosphate dibasic (48mg/mL) and glucose (1000mg/mL) [102]. The pH was established to 6.65 and the solution was sterilized with a 0.22µm membrane.
The resazurin reagent was prepared by mixing 0.02g of resazurin with 200mL of PBS (1x). This solution was sterilized (with a 0.22µm membrane and a syringe, inside de laminar flow hood chamber), distributed in smaller tubes and kept at -20ºC.
The MTT reagent was prepared adding 100mg of MTT to 20mL of PBS. This solution was sterilized (with a 0.22µm membrane and a syringe inside de chamber), distributed in smaller tubes and kept at -20ºC.
For the Live/Dead assay, two specific dyes were used: the PI and the FDA. The first one was used at 1mg/mL (it was not prepare in the lab) and FDA with a concentration of 5mg/mL in acetone.
2.4 Alginate and chitosan fluorescent labelling
To prepare the DTAF-labelled ALG solution, 15.0mL of ALG solution (1mg/mL) was mixed with 8mg of DTAF (the pH was adjusted to a value superior than 11 with NaOH) and it was allowed to react overnight, at room temperature, with gentle stirring, covered with foil. The DTAF-labelled ALG was separated from free DTAF by extensive dialysis against water. The solvent of the final solution was evaporated in the rotary evaporator, during 1 hour, approximately. Then, the obtained material was dissolved in 14mL of NaCl (0.15M) and distributed in several 1mL eppendorfs (the final concentration in solution was 1mg/mL). These tubes were kept at -20ºC, covered with foil [103].
(0.5M) was added to increase the pH to 10 (pH=10.56) in order to obtain a precipitate. Then, the solution was transferred to eppendorfs and centrifuged during 15 minutes at 15000g; the supernatant was removed and the pellet was washed with distilled water, and centrifuged again. This procedure was repeated until obtaining no fluorescence in the supernatant (6-7 centrifugations were done). After the centrifugations, the pellet was dissolved in 20mL of acetic acid (0.1M) and submitted to a dialysis process (against water, during three days, protected from the light; the water was changed daily). The dialysis used a cellulose membrane previously treated according to the manufacturer instructions (a solution of sodium bicarbonate 2% and EDTA 1mM was used; the membrane was put inside a reservoir with a high volume of this solution, during 30 minutes, at 80ºC). After the dialysis, the solution was dried in a rotary evaporator and dissolved in 40mL of a solution containing acetic acid (0.1M) and NaCl (0.15M) [104, 105]. The final solution had a concentration of 5mg/mL and it was kept at 4ºC, distributed in eppendorfs. To use this solution for cell encapsulation, it was necessary to dilute it to 1mg/mL.
2.5 Cell encapsulation
First, cells were trypsinised (during 10 minutes) from the cell culture plates where they were growing and counted in the inverted optical microscope using a hematocytometer (dilution 3:1, when necessary). After counting, depending on the amount of cells needed in the experiment, the suitable volume of cell suspension was transferred to an eppendorf, the suspension was centrifuged, cells were washed with a NaCl solution (0.15M) and centrifuged again (2500rpm, 8 min, 25°C).
respectively. Another counting was done using the hematocytometer to confirm the number of cells (encapsulated cells) in solution.
In part of the experiments, collagen was also used as a first conditioning layer before deposition of the first layer of the cationic polyelectrolyte. The idea behind collagen use was that the cell-matrix interactions could be mimetized (supplying survival signals), thus improving cell viability [106].
2.6
Observation of the encapsulated cells in the inverted
fluorescence microscope
Cells were observed in the inverted fluorescence microscope to verify if single cell encapsulation was achieved. As a tool to observe the contour of the polyelectrolyte layers surrounding the cells, DTAF-labelled alginate was used as the anionic polymer. DTAF (fluorescein dichlorotriazine) is a “green” dye which reacts with amino groups, but also with thiol groups and hydroxyl groups present in polysaccharides (covalent links) or other alcohols in aqueous solution at a pH above 9 (Figure 13). DTAF presents an λAbsorption = 492nm and λEmission = 517 nm [107].
As an alternative, RITC-labelled chitosan was used as the cationic polymer. RITC (rhodamine-B-isothiocyanate) is a “red” dye (Figure 14).
The synthesis of RITC-labelled chitosan was based on the reaction between the isothiocyanate group of RITC and the primary amino groups of chitosan. The RITC compound presents an λexcitation = 570 nm and λEmission = 595 nm [108, 109].
Figure 14 - RITC structure.
On the other hand, the cell nucleus was stained with DAPI. DAPI (4',6-diamidino-2-phenylindole) molecule is a low molecular weight fluorescent dye (Figure 15), which has the capacity to penetrate easily in the polyelectrolyte capsule and in the cell membrane and link to the nuclear and mitochondrial DNA. It is the most famous dye used in experiments involving cells. When it is bounded to a double-stranded DNA, DAPI has its absorption at 358 nm (ultraviolet) and its emission at 461 nm (blue) (Figure 16) [12].
Figure 16 - Fluorescence excitation and emission profiles of DAPI bound to dsDNA [110].
The use of this dye is very advantageous to verify the cell structure preservation, which means that the intact cells will exhibit areas with a well-defined bright fluorescent, while the corrupt ones will show a diffuse blue emission [12].
A stock solution 5mg/mL of DAPI was prepared in distilled water and kept at 4ºC, protected from light. 1µL of a 2500x dilution of the stock DAPI solution was added to the 500μL of medium used in the wells of 48 wells culture plates containing the encapsulated cells. After 10 minutes at room temperature, the mixture was centrifuged and 500μL of NaCl solution (0.15M) was added for washing and re-suspension. Finally, the sample was observed in the inverted fluorescence microscope (λabsorption = 358 nm; λemission = 461 nm [12].
2.7 Evaluation of the viability of the encapsulated cells
The viability of the encapsulated cells was evaluated by qualitative (Live/Dead assay) and quantitative means (the MTT reduction assay and the Resazurin reduction assay). The viability tests done with the encapsulated cells were performed after 0h, 1day and 3 days in culture; in some cases after 7 days.
2.7.1
Live/Dead Assay
In this method, two different dyes are used: fluorescein diacetate (FDA) and propidium iodide (PI) (Figure 17).
intracellular esterases. This cleavage results in the fluorescent compound “fluorescein”, which emits in the green range, when the stained cells are metabolically active. Fluorescein (which is a polar compound) stays accumulated inside the cell, exhibiting green fluorescence, when irradiated with blue light in a fluorescence microscope (Figure 18) [111, 112].
The PI passes through damaged cell membranes, having the capacity to intercalate with the DNA and RNA, creating a bright red fluorescent complex, visualized in the nuclei of dead cells, when seen in the fluorescence microscope. If the cells are alive, this dye is excluded by their healthy membrane. The intensity of the red fluorescence observed can depend on the degree of nuclear membrane disruption (Figure 18). The PI and other dyes (like trypan blue), are considered DNA-intercalating dyes, and they estimate cell membrane transport properties [111, 112].
Figure 17 -FDA (on the left)) and PI (on the right) structures.
For the Live/Dead assay, 1µL of FDA and 10µL of PI were added to the encapsulated cells present in 500μL of NaCl 0.15M. After 10 minutes, the mixture was centrifuged and the pellet was washed twice with NaCl 0.15M. The final sample was observed in the inverted fluorescence microscope.
2.7.2
MTT reduction assay
The MTT (3-(4,5-dimethylthiazol-2-yl)-2,5-diphenyltetrazolium bromide) method also informs about the metabolic state of the cells. This dye presents a yellow colour and, if the cells are alive, there will be a reduction reaction by the mitochondrial reductases present inside the cells, resulting in a solid compound with purple colour, called formazan (Figure 19) (λ = 570nm) [6]. The obtained compound, being solid, must be dissolved in a suitable solvent, for instance, DMSO (dimethyl sulfoxide). After the dissolution, the amount of the formazan produced can be determined with a spectrophotometer [66].
Figure 19 - MTT is reduced to formazan (s) by a mitochondrial reductase.
In the experiments, the MTT reagent was added directly to each well (50µL for
500µL of cell culture medium containing the encapsulated cells). After 3-4 hours, cells were
disrupted with DMSO (dimethyl sulfoxide) and absorbance was measured using a
microplate reader at 570nm (100µL of each solution was added to a well of a transparent
96 wells culture plate).
2.7.3
Resazurin reduction assay
If the cells are viable, they become able to reduce resazurin into resorufin (as a result of the action of several different redox enzymes), which is highly fluorescent (Figure 20). The nonviable cells lose their metabolic capacity, so they do not reduce the indicator dye, and because of that, there is not a fluorescent signal. Resazurin presents a dark blue color and has a little intrinsic fluorescence until it is reduced to resorufin, which is pink and highly fluorescent (λExcitation = 579 nm, λEmission = 584nm) [114].
Figure 20 - Conversion of resazurin to resorufin by metabolically active cells results in the generation of a fluorescent product [114].
Figure 21 - The CellTiter-Blue® Cell Viability Assay protocol [114].
In the experiments, 10µL of resazurin solution (prepared at a concentration of 0.1% in PBS) was added per 100µL of medium present in the well containing the encapsulated cells. Then, the plates were incubated at 37°C, during 3-4 hours, to allow cells to convert resazurin to resorufin. The fluorescent signal was measured in a microplate reader (100µL
of each solution was added to a well of an opaque 96 wells culture plate).
2.8 Cells cultured over the 2D-surface of the cell culture dish but
under polyelectrolyte layers – evaluation of cell viability
Only human MSCs were used in these studies, as well as the pair of polyelectrolytes PAH/ALG. Cells were seeded in the surface of cell culture wells at the desired cell density. After 24h in culture, the cell culture medium was removed and a solution containing the cationic polyelectrolyte was putted in contact with cells during 10 minutes, at 37ºC. Then, the culture was washed twice with 0.15M NaCl and the process was repeated with the anionic polyelectrolyte. This process was repeated until a layering scheme of cells/(P+/P-)n, was produced, where n represented the number of bilayers and P+ and P- the cationic polymer and anionic polymer, respectively. For the control, 0.15M NaCl without polyelectrolytes was used throughout the process.
to the procedures above described. In the Resazurin test, the solution of resazurin is added at each time point. In some experiments, resazurin was only added at 0h, but resorufin florescence was still measured at different time points (as the low/absence of cell viability could be associated with difficulties in the diffusion of resazurin throughout the polyelectrolyte layers, this assay allowed us to put aside this possibility).
2.9 Evaluation of the polymers cytotoxicity
The low/absence of cell viability leaded us to make a systematic study (dose-effect study) of the effect of polyelectrolyte concentration on cell viability. This study was done with human MSCs and using the Live/Dead assay and the Resazurin reduction assay (along 0h, 1 day, 4 days and 7 days). The concentrations investigated were: 500μg/mL, 100μg/mL, 50μg/mL, 10μg/mL, 1μg/mL, 500ng/mL, 250ng/mL and 50ng/mL (dilution from a ‘mother solution’ of 1mg/ml). The assays were done for PAH, CHI and ALG.
CHAPTER 3 – RESULTS AND DISCUSSION
3.1 Establishment of the best experimental conditions to obtain
the encapsulation of single cells
The first part of the work consisted in the establishment of adequate experimental conditions to achieve the encapsulation of individual cells. The general procedure used for cell encapsulation was based on the Layer-by-Layer technique and is schematised in Figure 22. Mesenchymal stem cells and the fibroblastic line NIH 3T3 were used in these initial experiments. The pair of electrolytes chosen was chitosan and alginate and, based on the work of Xia Tao and co-workers [8], solutions of 1mg/mL were used in the LbL process. To visualize the capsules in the fluorescence microscope, DTAF-labelled alginate (which emits in the green area of the spectrum) was used or, in alternative, RITC-labelled chitosan (which emits in the red area of the spectrum). The nuclei of the cells were visualized in the samples by staining them with the fluorescent dye DAPI (which emits in the blue area of the spectrum). The DAPI, being a low-molecular-weight dye, had the capacity to pass through the capsule easily, and to bind to the nuclear and mitochondrial DNA present in the cell [12]. The objective was to have only one cell inside one capsule.
Figure 22 - General procedure used in the encapsulation of cells.
The tested times of contact between cells and polyelectrolytes were 5 minutes and 10 minutes but no influence was noted in the obtainment of encapsulated single cells. Based on these results, a 10 minutes contact time was chosen to be used in all other experiments.
The washing step just after polyelectrolyte adsorption is a normal step in the LbL technique [6, 12, 115]. This washing is used to remove the excess of polyelectrolyte (not absorbed) and will, in principle, improve the observation of the samples in the Fluorescence Microscope by minimizing blur.
In the present work, three procedures were tested: (i) cells were not washed between polyelectrolytes deposition; (ii) washing was done with a solution of NaCl at 0.15M; and (iii) washing was done with Hank’s Balanced Salt Solution. NaCl at 0.15M was used because it is a very simple solution having an isotonic concentration [66]. HBSS was used based on the work of Verrabadran and co-workers [6]. The results obtained with these three approaches were similar but, anyway, it was decided to keep the step of washing with NaCl 0.15M between polyelectrolytes deposition.
Trypsinization (10’, 37ºC) Centrifugation (2500rpm, 8’) + NaCl (0.15M) washing 10 Minutes with stirring Centrifugation (2500rpm, 5’) + NaCl (0.15M) washing 10 Minutes with stirring Centrifugation (5000rpm, 5’) + NaCl (0.15M) washing NaCl (0.15M)
α‐MEM
(10%)
Cationic
polyelectrolyte
solution (500µL)
Anionic
polyelectrolyte
solution (500µL)
Cell Suspension Pellet (cells)
Cells with 1
layer
Cells with 2
layers (1
bilayer)
Fluorescence Microscopy
Viabilitytests
Figure 23 illustrates the type of images obtained with these systems using fluorescence microscopy. Here, rat MSCs were encapsulated within 1 bilayer of CHI/ALG-DTAF. The step of washing between polyelectrolytes adsorption was done with NaCl 0.15M and the time of contact between the cells and the polyelectrolyte solutions was 10 minutes. The blue fluorescence signals emitted by cell nuclei are clearly seen and their co-localization with the green fluorescence signals arising from the polyelectrolyte capsules is evident.
Figure 23 - Images obtained in the Fluorescence Microscope. Rat MSCs were encapsulated within 1 bilayer of CHI/ALG-DTAF; A: Green fluorescence from ALG-DTAF; B: Blue fluorescence from DAPI; C: merged images of both A, B. The nuclei (in blue) are inside the capsules (green).
These first set of experiments were done without measuring the number of cells in solution. As many aggregates were noticed in the observed samples, we hypothesized that maybe this problem could be related with a high cell concentration. An experiment was then done using different amounts of cells in the encapsulation process (Figure 24). The initial quantity of cells placed in the eppendorfs was 1.5x10⁵, 3.0x10⁵ and 7.5x10⁵ cells. At the end of the encapsulation process, as the capsules containing the cells were re-suspended in 500μL of NaCl 0.15M, the encapsulated cell concentrations were 3.0x10⁵cells/mL, 6.0x10⁵cells/mL and 15.0x10⁵cells/mL, respectively. Results showed that capsules aggregation increased with the number of initial cells used.
(A)
(C)
Figure 24 - Images of NIH 3T3 cells were encapsulated within 1 bilayer of CHI/ALG-DTAF. The images were obtained in the Fluorescence Microscope for an initial number of cells of A: 1.5x10⁵, B: 3.0x10⁵ and C: 7.5x10⁵. Green fluorescence from ALG-DTAF is observed. The step of washing between polyelectrolytes adsorption was done with NaCl 0.15M and the time of contact between the cells and the polyelectrolyte solutions was 10 min.
However, the mentioned aggregation problem was not completely solved by decreasing the cell number. In fact, Veerabadran and co-workers [6] used a much higher starting quantity of cells (5x10⁶ cells in 1mL) in their encapsulation studies and obtained the capsules more or less isolated. It must be said, however, that the experimental procedure used by Veerabadran and co-workers is not presented in detail in their publication, not allowing a full comparison of the results. For instance, they do not refer how much volume of polyelectrolyte solution was added to the cell suspension.
Therefore, believing that the cell concentration was not the unique factor affecting the aggregation of the encapsulated cells, several experiments were done to evaluate the effect of the type of stirring used during the cell re-suspension steps inherent to the process. Table 3 resumes the results obtained in experiments done with initial cell numbers of 1.5x10⁵ and 5.0x10⁵ and by encapsulating NIH 3T3 cells within 1 and 2 bilayers of polyelectrolytes. Stirring was performed by simply passing the cell suspension through the small tip of a micropipette several times, or by using a vortex mixer, an orbital mixer or a spinning magnet inside the tube containing the cell suspension. Moderate levels of cell aggregation were obtained with the use of a micropipette or the vortex mixer. In all other situations, the level of cell aggregation was high. Although the use of a vortex mixer seemed to be one of the best strategies to obtain separated encapsulated cells, due to concerns related with cell viability (cells could not resist to the strong forces generated during vortexing), the micropipette was used for stirring in all the following experiments.
Table 3 - Effect of the type of stirring used in the cell re-suspension steps on cell aggregation (+++, ++ and + represents high, moderate and low levels of cell aggregation, respectively).
Micropipette
(during ‘min,
until 10’)
Vortex (10s) Orbital mixer (37ºC, 300rpm)
Spinning
magnet
(10’, 750rpm)
1.5x10⁵cells
(3x10⁵ cells/mL) 1 bilayer
++ ++ * *
5.0x10⁵cells
(1x10⁶ cells/mL) 2 bilayers
++ * +++ +++
* Not studied
3.2 Evaluation of the viability of cells encapsulated within
CHI/ALG bilayers
After knowing that it was possible to obtain single encapsulated cells through the LbL technique, the next step was to verify if cells remained viable inside the capsules.
The first set of experiments used NIH 3T3 cells encapsulated within 1 and 2 bilayers consisting of CHI and ALG. A low cell concentration was used to minimize aggregation (4x10⁴ cells in each well of a 48-well culture dish) and cell viability was studied using the MTT test. Cell viability just after the cell encapsulation process (at 0h of cell culture) was 0% in relation to the values obtained with non-encapsulated cells. The treatment applied to non-encapsulated cells was equal to the one applied to the encapsulated cells, except that no polymers were present in the solutions. Thinking that, for some reason, the MTT test was not suitable to evaluate the metabolic activity of the encapsulated cells, two other cell viability tests were used: the resazurin reduction assay and the Live/Dead assay. Figure 25 shows the results obtained with the first method. Cell viability was extremely low at the beginning of cell culture (0h) and, after 3 days, decreased to 0%.
Figure 25 – Evaluation of the metabolic activity of NIH 3T3 cells encapsulated within 1 and 2 bilayers of CHI/ALG using the resazurin reduction assay after 0h (A) and 3 days (B) of cell culture.
Figure 26 – Evaluation of the viability of NIH 3T3 cells encapsulated within 1 (A) and 2 bilayers (B) of CHI/ALG using the Live/Dead assay at the beginning of cell culture (0h). Dead cells are red under the fluorescence microscope. 0,0 0,2 0,4 0,6 0,8 1,0 1,2 1,4 1,6 0h Control (2l) 2 layers Control (4l) 4 layers RFU (/ 10 5) 100% 100% 7.0% 4.1% 0,0 2,0 4,0 6,0 8,0 10,0 12,0 14,0 16,0 3 days Control 2 layers 4 layers
RFU (/
10 5) 0% 100% 0%
![Figure 1 - Schematic of polyelectrolyte capsule fabrication by layer-by-layer (LbL) assembly [4]](https://thumb-eu.123doks.com/thumbv2/123dok_br/15682731.625961/19.892.200.717.127.492/figure-schematic-polyelectrolyte-capsule-fabrication-layer-layer-assembly.webp)
![Figure 2 - Schematic representation of conjugating nanoparticles to bone marrow-derived MSCs via high molecular weight polyelectrolyte chains: poly-L-lysine, chitosan and hyaluronan [68]](https://thumb-eu.123doks.com/thumbv2/123dok_br/15682731.625961/22.892.155.768.516.874/schematic-representation-conjugating-nanoparticles-molecular-polyelectrolyte-chitosan-hyaluronan.webp)
![Figure 4 - Alginate and Chitosan structures [8].](https://thumb-eu.123doks.com/thumbv2/123dok_br/15682731.625961/25.892.218.740.296.581/figure-alginate-chitosan-structures.webp)
![Figure 5 - Alginate composition: A - Mannuronic acid residues chain; B - Guluronic acid residues chain; C - both residues (randomly) [80]](https://thumb-eu.123doks.com/thumbv2/123dok_br/15682731.625961/26.892.261.649.130.530/alginate-composition-mannuronic-residues-guluronic-residues-residues-randomly.webp)


![Figure 16 - Fluorescence excitation and emission profiles of DAPI bound to dsDNA [110]](https://thumb-eu.123doks.com/thumbv2/123dok_br/15682731.625961/42.892.350.565.147.329/figure-fluorescence-excitation-emission-profiles-dapi-bound-dsdna.webp)
![Figure 18 - Confocal images of rat lung slice co-stained with the LIVE/DEAD ® viability/cytotoxicity assay kit for animal cells [113]](https://thumb-eu.123doks.com/thumbv2/123dok_br/15682731.625961/43.892.274.651.772.1061/figure-confocal-images-slice-stained-viability-cytotoxicity-animal.webp)
![Figure 20 - Conversion of resazurin to resorufin by metabolically active cells results in the generation of a fluorescent product [114]](https://thumb-eu.123doks.com/thumbv2/123dok_br/15682731.625961/45.892.250.669.339.651/figure-conversion-resazurin-resorufin-metabolically-results-generation-fluorescent.webp)
