DOI: http://dx.doi.org/10.5007/1980-0037.2014v16s1p79
original article
Licence Creative Commom
CC
RBCDH
1 Federal University of Santa Cata-rina. Sports Center. Florianópolis, Santa Catarina, Brazil.
2 State University of Santa Cata-rina. Center for Health Sciences and Sports. Florianópolis, Santa Catarina, Brazil.
3 University of Pernambuco. Scho-ol of Physical Education. Recife, Pernambuco, Brazil.
Received: 25 February 2014 Accepted: 02 April 2014
Changes in health-related behaviors and
their efect on dissatisfaction with body
weight in youths
Mudanças nas condutas de saúde e o seu efeito na
insatisfação com peso corporal em adolescentes
Diego Augusto Santos Silva1
Andreia Pelegrini2
Adair da Silva Lopes1
Rildo de Souza Wanderley Júnior3
Simone Storino Honda Barros3
Mauro Virgílio Gomes de Barros3
Abstract– he aim of the present study was to establish whether changes in
health-related behaviors are associated with changes in the satisfaction/dissatisfaction with body weight in youths. It was a prospective study that performed a secondary analysis of data from Project “Saúde na Boa”, which included youths attending night classes in second-ary public schools in Recife in the state of Pernambuco and Florianópolis in the state of Santa Catarina. Data on the youths’ body type (thinness or excess weight) and degree of satisfaction/dissatisfaction with body weight and lifestyle (level of physical activity, par-ticipation in physical education classes, sedentary behavior and snacks, soda and alcohol intake) were collected at 10 schools from each town (ive in the intervention group and ive in the control group). he percentages of youths dissatisied with their body weight were 50.5% and 48.6% at baseline and ater intervention, respectively. he percentage of youths with body dissatisfaction due to thinness decreased (21.4% vs. 16.5%), while the percentage of youths with body dissatisfaction due to excess weight increased (29.1% vs. 32.1%). Approximately 41.2% of the youths with body dissatisfaction due to thinness and 18.3% of those dissatisied due to excess weight became satisied with their body weight ater intervention. he intervention targeting health-related behaviors induced changes in the youths’ degree of satisfaction with their body weight.
Key words: Body image; Interventional studies ; Healthy behaviors; Youths.
INTRODUCTION
Self-perception of body weight is an important component of body image, as
it is related to a person’s feelings and behavior towards his or her body1. As a
function of prevailing sociocultural inluences, beauty is associated by females
with a thin body, while males associate it with a large and muscular body2.
Excessive concern with body weight might alter the everyday behav-ior of adolescents, resulting in use of laxatives and other drugs without a medical prescription, excessive exercise and inappropriate diets, eventually
giving rise to suicidal thoughts3-6. An inability to meet the culturally ideal
esthetic standards might result in distortions of body image, which in turn might lead to eating disorders, failed attempts at controlling body weight
and the use of anabolic steroids5.
According to some studies, adolescents’ satisfaction with their body weight varies among diferent cultural settings, as also do the factors
as-sociated with it1,3,6. In China5, for instance, a study found that more than
25% of the investigated adolescents described themselves as thin, and more than 30% described themselves as overweight. hat study further found that factors such as the degree of exposure to mass media, attitudes towards physical appearance and the adoption of health-risk behaviors were
associ-ated with body dissatisfaction5. One study conducted on adolescents in
Ro-mania6 found that 22.6% of the participants with normal weight perceived
themselves as overweight. In addition, the students from both genders who perceived themselves as overweight were more likely to exercise, exhibit inadequate dietary habits, take diet pills, vomit or take laxatives compared
to the ones who did not perceive themselves as overweight6.
In addition to family, schools are also considered responsible for youth education. Particular eforts are constantly undertaken by schools to moti-vate youths to develop healthy habits, as these habits are likely to persist into
adulthood7. However, similarly, risk behaviors acquired by this time are also
likely to persist in the future. For these reasons, schools are one of the main
agencies involved in the formation of life habits and behaviors in adolescents7.
Several interventions aimed at reducing unhealthy behaviors among
adolescents have been developed worldwide7-10, some of which exhibited
satisfactory results, such as an increase in physical activity level, the devel-opment of appropriate dietary habits, smoking cessation and a reduction in stress. However, the impact of such interventions on adolescents’ satisfac-tion/dissatisfaction with their body weight is still unknown, although this indirect efect is likely, as changes in health-related behaviors are associ-ated with the satisfaction with body weight among adolescents. he data available in Brazil derive from cross-sectional studies that investigated the distribution of adolescents’ dissatisfaction with their self-image, as well as
its association with several factors11-13.
to modulate those behaviors among youths into educational and health policies. If evidence shows that positive changes in health-related behaviors induce positive changes in body weight perception, then interventions targeting the youths’ life habits might simultaneously stimulate the devel-opment of healthy behaviors and relect a greater awareness of body weight perception. In addition, the existence of that relationship would allow the illing of current gaps in the understanding of the causal network that links some health-related behaviors with body weight satisfaction/dissatisfac-tion among youths. For those reasons, the aim of the present study was to investigate whether changes in health-related behaviors are associated with changes in the satisfaction/dissatisfaction with body weight among youths.
METHODOLOGICAL PROCEDURES
Population and sample
he present study consisted of a secondary analysis of the data collected
in the randomized-controlled study “Saúde na Boa”14-16. In that study, the
aim of the intervention was to promote the development of healthy behav-iors among youths attending night classes in public secondary schools at two Brazilian state capitals, Florianópolis (state of Santa Catarina - SC) and Recife (state of Pernambuco - PE) in the Southern and Northeastern regions of Brazil, respectively.
Approximately 2,000 youths aged 14 to 24 years old attending 20 ran-domly selected schools were assessed in March 2006 (baseline). Ten schools from each town were selected, ive corresponding to the experimental group and ive to the control group. he schools were matched in geographical location and size (small: up to 200 students; medium: 200 to 499 students; large: 500 or more students). A second assessment was performed nine months later (December 2006), and the response rate at follow up was 45.9% (989 participants were assessed). Detailed data related to the selected towns, target population and procedures for sample selection were described in a
previous article14. he analysis of the participants lost to follow-up
accord-ing to demographic, socioeconomic and behavioral features is provided
by another article in the present supplement15. he present study included
only the youths for whom valid data on body weight perception were available. herefore, the sample of the present study comprised 771 high school students. Further detail on the sampling and study procedures are
available in other published articles14-16.
Dependent variable
he dependent variable was dissatisfaction with body weight, which was created from other two variables included the data collection as follows.
he participants were irst asked the question “Are you satisied with your
body weight?”, to which the answer options were “Yes”, “No” and “I don’t
know”. he participants who answered “Yes” were classiied as satisied
the ones who answered “I don’t know” were excluded from the analysis
(5.5% and 3.1% of the participants at baseline and ater intervention,
re-spectively). In addition, as the literature recommends investigating whether
dissatisfaction with the body weight is due to thinness or excess weight17,
the participants were then asked the question “How do you rate your body
weight?”, the answer options being: “I’m too thin”, “I’m somewhat thin”,
“My body weight is adequate (normal)”, “I’m somewhat fat”, and “I’m very
fat”. he participants who reported dissatisfaction in question 1 and rated
themselves somewhat or very thin in question 2 were classiied as “
dis-satisied due to perceived thinness”; the ones who reported dissatisfaction
in question 1 and rated themselves as somewhat or very fat in question
2 were classiied as “dissatisied due to perceived excess weight”; the ones
who reported dissatisfaction in question 1 and rated themselves as having adequate weight (4.0%) in question 2 were excluded from analysis, as the answers were considered to be inconsistent.
Independent variables
he independent variables were changes in health-related behaviors. he physical activity section assessed the number of days in a typical week the participants performed physical activity for at least 60 minutes. Additionally, the performance of localized muscular strength/resistance exercises – LMR - (number of days/week) and the participation of the volunteers in physical education classes (number of days/week) were assessed. Sedentary behavior was estimated based on the time spent every day watching TV (hours/day) and at the computer or playing video games (hours/day). he dietary habits section included the frequency of snacks and soda intake (number of days/ week) and the monthly alcohol consumption (number of days/month).
he diference between the values at baseline and ater intervention was
calculated for each health-related behavior, and the results were classiied as reduced, unchanged or increased. In the description of the results, the categories were ordered from the best to the worst possible scenario.
Control variables
he following demographic and socioeconomic variables were included in analysis as potential confounding factors: gender (male or female), age, skin color (black, white, brown or other), town (Florianópolis or Recife), marital status (single or other), occupation (employed, intern or not working), lives with the family (yes or no) and housing type (house, apartment or other).
Statistical analysis
the end of the study. Adjusted multinomial logistic regression was used to calculate the odds ratio and 95% conidence interval corresponding to the relationship between the changes introduced in the health-related behav-iors and the changes in the degree of satisfaction/dissatisfaction with body weight (the category “improved”, which comprised the participants who reported dissatisfaction at baseline and satisfaction ater intervention, was used as a reference). As the variable gender did not exhibit an association with the changes in the dissatisfaction with body weight and did not afect the results, the analysis was performed relative to the total sample. All the analyses were adjusted for potential confounding factors (gender, age, skin color, town, marital status, occupation, lives with the family, household type and behavior at baseline). he analysis was performed using the Stata sotware, v. 11 (Stata Corp., College Station, TX, USA), and the signiicance level was established as 5%.
Ethical issues
All the procedures performed in the present study were approved by the ethics committees of the Federal University of Santa Catarina (Universi-dade Federal de Santa Catarina – UFSC; 031/2005) and the Mother-Child Institute (Instituto Materno Infantil) of Pernambuco (587/2005). Passive consent forms were signed by the parents or guardians of the volunteers younger than 18 years old, as well as by students aged 18 years or older.
RESULTS
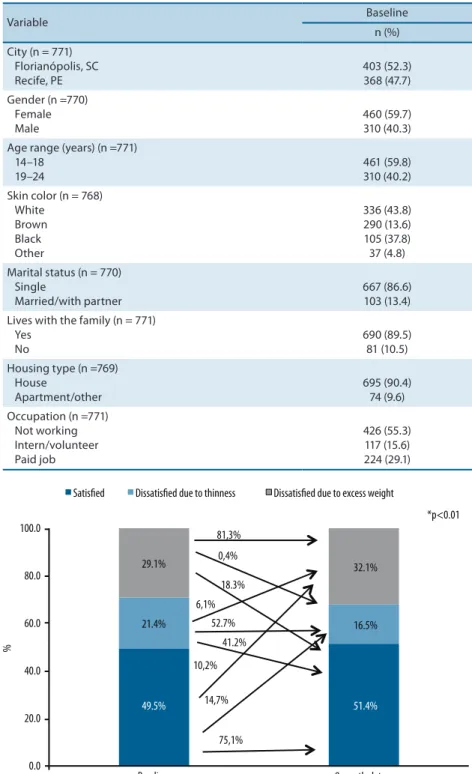
he sample comprised participants from Florianópolis, SC (52.3%) and Recife, PE (47.7%). Most of the participants were female, aged 14 to 18 years old, self-reported to be white, single, lived with their families, did not work and lived in houses (Table 1).
he prevalence of participants dissatisied with their body weight at baseline was 50.5%, and it exhibited little variation ater nine months of intervention (48.6%). Approximately 29.1% of the participants reported dis-satisfaction due to excess weight at baseline, and 81.3% of them remained dissatisied ater intervention, whereas 18.3% became satisied with their body weight (p < 0.01). Approximately 21.4% of the participants reported dissatisfaction due to thinness at baseline, and a little more than half of them remained dissatisied ater intervention, while 41.2% became satisied with their body weight (p < 0.01). Approximately 10.2% of the participants who reported to be satisied with their body weight at baseline (49.5%) were dissatisied due to excess weight at the end of the study, while 14.7% reported to be dissatisied due to thinness (Figure 1).
Table 1. Characterization of the participants at baseline with valid data for the present study (n = 771)
Variable Baseline
n (%) City (n = 771)
Florianópolis, SC Recife, PE
403 (52.3) 368 (47.7) Gender (n =770)
Female Male
460 (59.7) 310 (40.3) Age range (years) (n =771)
14–18 19–24
461 (59.8) 310 (40.2) Skin color (n = 768)
White Brown Black Other
336 (43.8) 290 (13.6) 105 (37.8) 37 (4.8) Marital status (n = 770)
Single
Married/with partner
667 (86.6) 103 (13.4) Lives with the family (n = 771)
Yes No
690 (89.5) 81 (10.5) Housing type (n =769)
House
Apartment/other
695 (90.4) 74 (9.6) Occupation (n =771)
Not working Intern/volunteer Paid job
426 (55.3) 117 (15.6) 224 (29.1)
Figure 1. Prevalence of and changes in body weight perception at baseline and at nine-month follow up as assessed in youths attending secondary school (n = 771); * chi-square test
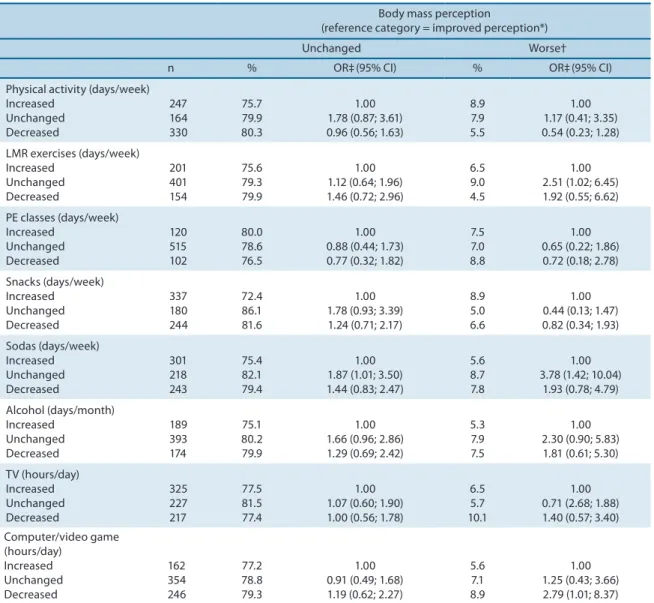
of LMR exercises and of soda intake exhibited a signiicant association with negative changes in body weight perception. An increase in the number of hours spent each day at the computer or playing video games exhibited a signiicant association with a higher odds ratio for becoming dissatisied with body weight.
Table 2. Frequencies of health-related behaviors at baseline and after nine months of intervention (n = 771)
Variable Baseline After 9 months p* n (%) n (%)
Physical activity (days/week) (n = 765) ≥ 5
< 5
347 (45.4) 418 (54.6)
250 (32.7) 515 (67.3)
< 0.01 LMR exercises (days/week) (n = 756)
≥ 1 None
266 (35.2) 490 (64.8)
326 (43.1) 430 (56.9)
< 0.01 PE classes (days/week) (n = 737)
≥ 1 None
398 (54.0) 339 (46.0)
397 (53.9) 340 (46.1)
1.00 Snacks (days/week) (n = 761)
< 5 ≥ 5
542 (71.2) 219 (28.8)
598 (78.6) 163 (21.4)
< 0.01 Sodas (days/week) (n = 762)
< 5 ≥ 5
485 (63.6) 277 (36.4)
524 (68.8) 238 (31.2)
0.04 Alcohol (days/months) (n = 756)
None ≥ 1
390 (51.6) 366 (48.4)
405 (53.6) 351 (46.4)
0.02 TV (hours/day) (n = 769)
< 2 ≥ 2
289 (37.6) 480 (62.4)
320 (41.6) 449 (58.4)
0.12 Computer/Video games (hours/day)
< 2 ≥ 2
577 (75.7) 185 (24.3)
535 (70.2)
227 (29.8) 0.02
LMR: localized muscular resistance; *chi-square test
DISCUSSION
association between the youths’ satisfaction/dissatisfaction with their body weight and their dietary habits and performance of physical activity (the
main components of the intervention program)18,19.
he subjectivity characterizing the measures used to assess the health-related behaviors might account for the lack of an association between those variables and the participants’ satisfaction/dissatisfaction with their body weight found at some moments, and consequently, this subjectivity is a limita-tion of the present study. One addilimita-tional limitalimita-tion derives from the duralimita-tion of the follow-up period, nine months, which might have been too short to allow the detection of signiicant associations with some of the assessed vari-ables. Finally, the loss of more than 50% of the sample is another limitation. he prevalence rates of youths dissatisied with their body weight were 50.5% and 48.6% at baseline and ater intervention, respectively.
Approxi-Table 3. Association between body weight perception (reference category: improved perception) and health-related behaviors in youths.
Body mass perception
(reference category = improved perception*) Unchanged Worse† n % OR‡(95% CI) % OR‡(95% CI) Physical activity (days/week)
Increased Unchanged Decreased 247 164 330 75.7 79.9 80.3 1.00 1.78 (0.87; 3.61) 0.96 (0.56; 1.63)
8.9 7.9 5.5
1.00 1.17 (0.41; 3.35) 0.54 (0.23; 1.28) LMR exercises (days/week)
Increased Unchanged Decreased 201 401 154 75.6 79.3 79.9 1.00 1.12 (0.64; 1.96) 1.46 (0.72; 2.96)
6.5 9.0 4.5
1.00 2.51 (1.02; 6.45) 1.92 (0.55; 6.62) PE classes (days/week)
Increased Unchanged Decreased 120 515 102 80.0 78.6 76.5 1.00 0.88 (0.44; 1.73) 0.77 (0.32; 1.82)
7.5 7.0 8.8
1.00 0.65 (0.22; 1.86) 0.72 (0.18; 2.78) Snacks (days/week) Increased Unchanged Decreased 337 180 244 72.4 86.1 81.6 1.00 1.78 (0.93; 3.39) 1.24 (0.71; 2.17)
8.9 5.0 6.6
1.00 0.44 (0.13; 1.47) 0.82 (0.34; 1.93) Sodas (days/week) Increased Unchanged Decreased 301 218 243 75.4 82.1 79.4 1.00 1.87 (1.01; 3.50) 1.44 (0.83; 2.47)
5.6 8.7 7.8
1.00 3.78 (1.42; 10.04)
1.93 (0.78; 4.79) Alcohol (days/month) Increased Unchanged Decreased 189 393 174 75.1 80.2 79.9 1.00 1.66 (0.96; 2.86) 1.29 (0.69; 2.42)
5.3 7.9 7.5
1.00 2.30 (0.90; 5.83) 1.81 (0.61; 5.30) TV (hours/day) Increased Unchanged Decreased 325 227 217 77.5 81.5 77.4 1.00 1.07 (0.60; 1.90) 1.00 (0.56; 1.78)
6.5 5.7 10.1
1.00 0.71 (2.68; 1.88) 1.40 (0.57; 3.40) Computer/video game (hours/day) Increased Unchanged Decreased 162 354 246 77.2 78.8 79.3 1.00 0.91 (0.49; 1.68) 1.19 (0.62; 2.27)
5.6 7.1 8.9
1.00 1.25 (0.43; 3.66) 2.79 (1.01; 8.37)
mately 29.1% of the sample reported dissatisfaction due to excess weight at baseline, and almost one ith of the participants became satisied with their body weight ater intervention. Approximately 21.4% of the sample reported dissatisfaction due to thinness, and 41.2% of these participants became satisied with their body weight ater intervention. hese ind-ings show that the investigated intervention changed the perception and satisfaction/dissatisfaction of the youths with their body weight, and thus, they disagree with the results of studies that did not ind positive changes
in the degree of satisfaction of youths with their body weight20. One
lon-gitudinal study that followed youths from Minnesota, USA over 10 years found that the female and male participants’ body dissatisfaction increased between middle and high school, that the body dissatisfaction increased further during the transition to young adulthood and that this increase
was associated with an increase in the body mass index (BMI) over time21.
One study that investigated the relationships between longitudinal weight status, body dissatisfaction and the attitude toward weight loss among South Korean children from the ages of 7–8 to 13–14 years old found that the girls favored thinner shapes than the boys did, regardless of weight status or changes in BMI. In contrast, in the boys, the desire to lose weight was related only to weight loss attempts and was independent of the weight
status, BMI changes and level of body dissatisfaction22.
he studies conducted in Brazil with a cross-sectional design show
that youths exhibit high levels of body dissatisfaction11,12. hose indings
are a source of concern, as dissatisfaction with body image is associated
with eating disorders13.
In the present study, the participants who did not change their fre-quency of soda intake exhibited a higher likelihood of maintaining a negative perception of their body weight compared to those who reduced it. hese indings agree with the results of a study conducted on Spanish teenagers (12 to 17 years old), which found greater soda intake among overweight participants dissatisied with their body image compared
to the overweight participants satisied with their body image19. In the
present study, unchanged frequencies of LMR exercises and soda intake exhibited a signiicant association with negative changes in body weight perception. One study conducted on college students found that body image was a signiicant factor in determining the amount of exercise for a
major-ity of the participants (58.3%)23. According to the literature, adolescents
who perceive themselves as overweight are more likely to exercise to lose
weight compared to those who do not perceive themselves as overweight24.
Dissatisfaction with body image might both motivate the participants to
exercise24 and facilitate exercise25.
predictors of body dissatisfaction20. Adolescents are vulnerable to the
messages and images conveyed by the mass media, and some of them are unable to discriminate these images from reality; they are oten unaware of the manipulation of images by digital technologies that oten results in
unrealistic body ideals, which are impossible to attain18.
he following strong points of the present study stand out. First, its prospective design allowed the analysis of changes in the participants’ health-related behaviors and their association with changes in the satis-faction/dissatisfaction with body weight. Second, the inclusion of various types of health-related behaviors allowed for the analysis of several fac-tors potentially associated with body dissatisfaction, thus denoting that the scope of this subject should be more comprehensive when it relates to youths. Finally, the sample comprised participants from two towns located in Brazilian areas exhibiting diferent sociocultural proiles, which allows for a broader extrapolation of the results.
CONCLUSIONS
he intervention investigated in the present study changed the degree of dissatisfaction of the assessed youths with their body weight. A fraction of the participants who reported dissatisfaction due to thinness (41.2%) or excess weight (18.3%) became satisied with their body weight ater intervention. he factors that exhibited signiicant associations with the shit from initial satisfaction to dissatisfaction with body weight at the end of the study were a lack of an increase in the frequency of LMR exercises, a lack of a reduction in the frequency of soda intake and an increase in the time spent every day at the computer or playing video games. Future interventional studies, including those on strategies designed to induce changes in body weight perception, might improve the degree of satisfac-tion of youths with their body image and consequently promote changes in a series of health-related behaviors.
Acknowledgments
REFERENCES
1. Pauline M, Selvam S, Swaminathan S, Vaz M. Body weight perception is associ-ated with socio-economic status and current body weight in selected urban and rural South Indian school-going children. Public Health Nutr 2012;15(12):2348-56.
2. Neighbors LA, Sobal J. Prevalence and magnitude of body weight and shape dis-satisfaction among university students. Eat Behav. 2007; 8(4):429-39.
3. Cheung PC, Ip PL, Lam ST, Bibby H. A study on body weight perception and weight control behaviours among adolescents in Hong Kong. Hong Kong Med J 2007;13(1):16-21.
4. Fidelix YL, Silva DAS, Pelegrini A, Silva AF, Petroski EL. Body image dissatisfac-tion among adolescents from a small town: Associadissatisfac-tion with gender, age, and area of residence. Rev Bras Cineantropom Desempenho Hum 2011;13(3):202-7.
5. Xie B, Chou CP, Spruijt-Metz D, Reynolds K, Clark F, Palmer PH, et al. Weight perception and weight-related sociocultural and behavioral factors in Chinese adolescents. Prev Med 2006;42(3):229-34.
6. Ursoniu S, Putnoky S, Vlaicu B. Body weight perception among high school students and its inluence on weight management behaviors in normal weight students: a cross-sectional study. Wien KlinWochenschr 2011;123(11-12):327-33.
7. Nahas MV, Barros MV, Assis MA, Hallal PC, Florindo AA, Konrad L. Methods and participant characteristics of a randomized intervention to promote physical activity and healthy eating among brazilian high school students: the Saúde na Boa project. J Phys Act Health 2009;6(2):153-62.
8. Muth ND, Chatterjee A, Williams D, Cross A, Flower K. Making an IMPACT: efect of a school-based pilot intervention. N C Med J 2008;69(6):432-40.
9. Gortmaker SL, Cheung LW, Peterson KE, Chomitz G, Cradle JH, Dart H, et al. Impact of a school-based interdisciplinary intervention on diet and physical activ-ity among urban primary school children: eat well and keep moving. Arch Pediatr Adolesc Med 1999;153(9):975-83.
10. Barros MV, Nahas MV, Hallal PC, Farias Júnior JC, Florindo AA, Barros SSH. Efectiveness of a school-based intervention on physical activity for high school students in Brazil: the Saúde na Boa project. J Phys Act Health 2009;6(2):163-9.
11. Glaner MF, Pelegrini A, Cordoba CL, Pozzobon ME. Associação entre insatisfação com a imagem corporal e indicadores antropométricos em adolescentes. Rev Bras Educ Fís Esporte 2013;27(1):129-36.
12. Petroski EL, Pelegrini A, Glaner MF. Motivos e prevalência de insatisfação com a imagem corporal em adolescentes. Cien Saude Colet 2011;17(4):1071-7.
13. Martins CR, Pelegrini A, Matheus SC, Petroski EL. Insatisfação com a imagem corporal e sua relação com estado nutricional, adiposidade corporal e sintomas de anorexia e bulimia em adolescentes. Rev Psiquiatr Rio Gd Sul 2010;32(1):19-23.
14. Nahas MV, Barros MV, Assis MAA, Hallal PC, Florindo AA, Konrad L. Methods and participant characteristics of a randomized intervention to promote physical activity and healthy eating among brazilian high school students: the Saude na Boa project. J Phys Act Health 2009;6(2):153-62.
15. Silva KS, Barros MVG, Barbosa Filho VC, Garcia LMT, Wanderley Júnior RS, Beck, CC, et al. Implementation of the “Saúde na Boa” intervention: process evaluation and characteristics of participants and dropouts. Rev Bras Cineantropom Desem-penho Hum 2014; 16(Supl.1)1-12.
16. Nahas MV, Barros MVG, Florindo AA, Hallal PC, Konrad L, Barros SSH, Assis MAA. Reprodutibilidade e validade do questionário saúde na boa para avaliar atividade física e hábitos alimentares em escolares do ensino médio. Rev Bras Ativ Fís Saúde 2012;12:12-20.
Corresponding author
Diego Augusto Santos Silva Campus Universitário Reitor João David Ferreira Lima, Centro de Desportos, Departamento de Educação Física, Bairro Trindade, Florianópolis, Santa Catarina, Brasil, CEP: 88040-900.
E-mail: [email protected]
18. Morris AM, MBBS MPH FRACP, Katzman DB, MD FRCPC. he impact of the media on eating disorders in children and adolescents. Pediatr Child Health 2003;8(5):287-9.
19. Bibiloni MM, Pich J, Pons A, Tur JA. Body image and eating patterns among ado-lescents. BMC Public Health 2013;13:1104.
20. Stice E, Whitenton K. Risk factors for body dissatisfaction in adolescent girls: a longitudinal investigation. Dev Psychol 2002;38(5):669-78.
21. Bucchianeri MM, Arikian AJ, Hannan PJ, Eisenberg ME, Neumark-Sztainer D. Body dissatisfaction from adolescence to young adulthood: indings from a 10-year longitudinal study. Body Image 2013;10(1):1-7.
22. Lee K, Sohn H, Lee S, Lee J. Weight and BMI over 6 years in Korean children: re-lationships to body image and weight loss eforts. Obes Res 2004;12(12):1959-1966.
23. Brudzynski L, Ebben WP. Body image as a motivator and barrier to exercise par-ticipation. Int J Exerc Sci 2010;3(1):14-24.
24. Ingledew DK, Sullivan G. Efects of body mass and body image on exercise motives in adolescence. Psychol Sport Exerc 2002;3(1):323-38.