Introduction
Match analysis is an area of sports science that describes the analysis of sports competition. In conventional tennis, using match statistics data, it is possible to better deine player’s performance and individual characteristics (e.g. gender and age)1, winning or losing of matches2, playing patterns on dif-ferent surfaces3, or against different opponents (right and left handers)4. A statistical analysis of match characteristics allows us to increase the knowledge about winning or losing a match5. There is not much information about the tactical wheelchair ten-nis competition, so the training system is based on information from conventional tennis.
The main difference compared to conventional tennis rules and wheelchair tennis is that the ball can bounce twice before being hit6. This rule allows players to hit balls far as its ability to displacement from conventional tennis is lower7. The dis-placement capacity is determined largely by the type of injury the player, so players with less severe injury will be faster than players with a more severe injury8. The type of injury will al-low the player to sit higher or al-lower in his chair, although the height of hit the ball will always be lower than a conventional tennis player7. This lower position the wheelchair tennis player, could affect the action mainly serve, performing as many double
faults and fewer aces9. These differences with conventional tennis affect the dynamics of the game. Therefore, the aspects and the values that differentiate winning players from the losers in conventional tennis, such as numbers of aces, double faults, errors, point won on irst and second serve, winner, break points won, etc.10, could not be applicable in wheelchair tennis. The aim of the present study was to analyze the differences in game statistics of wheelchair tennis between winning and losing sets.
Methods
Samples
Data from 139 sets of 64 single male matches played on the 2012 Paralympics Games were analyzed. All the matches were played on hard court. The sample represents 100% of all matches played by 64 male players. In this tournament played the best international ranking players with qualifying through competi-tion system. Data for the study were gathered from the oficial website of the Paralympics Games (accessed 13th October 2012). All matches were played best of three set with tie break in all sets. The criteria for matches to be included in the study were that the match had to be a completed match. The studied Original Article (short paper)
Differences in game statistics between winning
and losing for male wheelchair tennis players in
Paralympics Games
Alejandro Sánchez-Pay
University of Murcia, Murcia, Spain
Gema Torres-Luque
University of Jaen, Jaen, Spain
Ángel Iván Fernandéz-Garcia
University of Granada, Granada, Spain
David Sanz-Rivas
Royal Spanish Tennis Federation, Madrid, Spain
José Manuel Palao Andrés
University of Wisconsin-Parkside, Wisconsin, United States
Abstract — Aims: The aim of the present study was to analyze the differences in wheelchair tennis game statistics between winning and losing sets. Methods: Data were collected from the 139 sets of 64 matches played by 64 males’
players in the 2012 Paralympics Games. The variables studied were grouped in four groups: variables related to serve, to return, to winners and errors, and to net point. Data was collected from oficial website of the Paralympics Games. A univariate (Wilcoxon test) and multivariate (discriminant) analysis of data was done to the study the four groups of variable in relation to the result of the set (win or lose). Results: The result showed that winning players commit fewer errors and achieved more winning shots than losing players. Conclusion: The values presented could be used as a reference for practice and competition in wheelchair tennis players.
variables were divided into four groups (Table 1). The study was undertaken according to the Helsinki declaration, and all
procedures were approved by the Bioethics Commissions of the University of Murcia (1431/2017).
Procedure
The data were obtained from the oficial statistics of the tourna-ment. The data were recorded in a speciic spreadsheet for pro-cessing. The unit of analysis was the set. From the spreadsheet, data was exported to SPSS 19.0 for its analysis.
Statistical analysis
Firstly, a descriptive analysis of the data was done (average values and standard deviations). Secondly, a Wilcoxon test (non-parametric) was carried out with the goal of analyzing the differ-ences between winning and losing players. Finally, a discriminant analysis11 was done to ind those statistical variables that best differentiate winning and losing players. Structural Coeficients (SC) greater than or equal to |.30|12 were considered relevant for the interpretation of the linear vectors. All of the statistical analyses were done with a level of signiicance of p ≤ 0.05.
Results
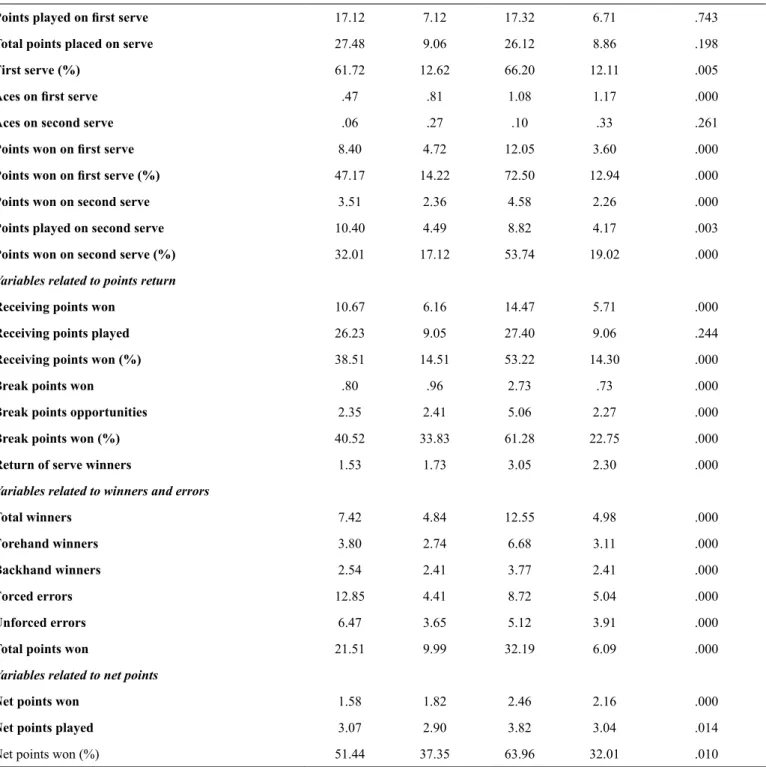
Regarding to point serve variables (Table 2), winning players had signiicantly higher values for the following variables: total aces, percentage of irst serve, aces on irst serve, points won on
irst serve, percentage of points won on irst serve, points won on second serve, and percentage of points won on second serve. On the other hand, losing players had signiicantly higher values for the variables: double faults, and points played on second serve, and non-signiicantly for the points played on serve. For the rest of variables, no signiicant differences were found.
For the variables regarding the return points, winning play-ers had signiicantly higher averages values in the following variables: receiving points won, percentage of receiving points won, break points won, break point opportunities, percentage of break points won, and returns on serve winners. No signiicance differences were found in the variable receiving points played.
For the variables regarding the winners and errors, signiicant differences were found in all variables. Winning players had sig-niicantly higher averages for the following variables: total winners, forehand winners, backhand winners, and total points won. Losing players had signiicantly higher averages for the variables forced errors, and unforced errors. For the net points variables, winning players had signiicantly higher averages values in all variables: net points won, net points played, percentage on net points won.
The multivariate analysis showed that the discriminant function obtained was signiicant (p < 0.001), and it correctly classiied 99.6% of winning and losing players (Table 3). The variables which allow us to better discriminate the category
winners or losers were the break points won (SC = 0.35), and percentage of points won on irst serve (SC = 0.35).
Table 1. Variables studied in the wheelchair tennis competition from the Paralympics Games London 2012.
Group of variables Variables or game statistics or performance indicators
Variables related to points serve
Total aces, double faults, points played on irst serve, total points played on serve, percentage of irst serves in, aces on irst service, aces on second service, points won on irst serve, percent -age of points won on irst serve, points played on second serve, points won on second serve and percentage of points won on second serve.
Variables related to points return Receiving points won, receiving points played, percentage of receiving points won, break points
won, break point opportunities, percentage of break points won, and returns of serve winners.
Variables related to winners and errors Total winners, forehand winners, backhand winners, forced errors, unforced errors, and total
points won.
Variables related to net points Net points won, net points played and percentage of net points won.
Note: Data was obtained from the oficial statistics of the Paralympics Games (http://www.london2012.com/paralympics).
Table 2. Differences between winning and losing wheelchair tennis players in game statistics from the 2012 Paralympics Games. Media (M) and Standard Deviation (SD).
Variables
Loser set Winner set
p1 value
M SD M SD
Variables related to points serve
Total aces .54 .92 1.18 1.23 .000
Points played on irst serve 17.12 7.12 17.32 6.71 .743
Total points placed on serve 27.48 9.06 26.12 8.86 .198
First serve (%) 61.72 12.62 66.20 12.11 .005
Aces on irst serve .47 .81 1.08 1.17 .000
Aces on second serve .06 .27 .10 .33 .261
Points won on irst serve 8.40 4.72 12.05 3.60 .000
Points won on irst serve (%) 47.17 14.22 72.50 12.94 .000
Points won on second serve 3.51 2.36 4.58 2.26 .000
Points played on second serve 10.40 4.49 8.82 4.17 .003
Points won on second serve (%) 32.01 17.12 53.74 19.02 .000
Variables related to points return
Receiving points won 10.67 6.16 14.47 5.71 .000
Receiving points played 26.23 9.05 27.40 9.06 .244
Receiving points won (%) 38.51 14.51 53.22 14.30 .000
Break points won .80 .96 2.73 .73 .000
Break points opportunities 2.35 2.41 5.06 2.27 .000
Break points won (%) 40.52 33.83 61.28 22.75 .000
Return of serve winners 1.53 1.73 3.05 2.30 .000
Variables related to winners and errors
Total winners 7.42 4.84 12.55 4.98 .000
Forehand winners 3.80 2.74 6.68 3.11 .000
Backhand winners 2.54 2.41 3.77 2.41 .000
Forced errors 12.85 4.41 8.72 5.04 .000
Unforced errors 6.47 3.65 5.12 3.91 .000
Total points won 21.51 9.99 32.19 6.09 .000
Variables related to net points
Net points won 1.58 1.82 2.46 2.16 .000
Net points played 3.07 2.90 3.82 3.04 .014
Net points won (%) 51.44 37.35 63.96 32.01 .010
1 Wilcoxon test.
Table 3. Standardized coeficients from the discriminant analysis of the game statistics between winning and losing wheelchair tennis players in the 2012 Paralympics Games.
Game statistics variable Winner-Loser
Break points won -.35*
Points won on irst serve (%) -.35*
Break points won (%) -.22
Receiving points won (%) -.22
Points won on second serve (%) -.21
Total points won -.17
Forced errors .16
Total aces -.13
Points won on irst serve -.12
Total winners -.12
Net points played -.12
Net points won (%) -.11
Aces on irst serve -.11
Points played on second serve .10
Unforced errors .10
Aces on second serve -.09
Break point opportunities -.09
Returns on serve winners -.08
Points played on serve .07
Receiving points won -.07
Backhand winners -.07
First serve (%) -.07
Double faults .06
Points won on second serve -.04
Receiving points played .03
Points played on irst serve .03
Forehand winners -.01
Eigenvalue 6.67
Wilks’ Lambda .13
Canonical Correlation .93
Chi-square 406.67
Signiicance .00
Reclassiication 99.6%
* SC discriminant value ≥|.30|
Discussion
The purpose of this study was to analyze the differences in wheelchair tennis game statistics between winning and losing sets. The winner of a set seems to be more offensive (winning shots) and make fewer errors. These indings provide new knowledge that may help to understand wheelchair tennis more comprehensively and could be used to design training drills. The results of this study show that winning players have better game statistics in a serve situation, both in the number of aces per set, and points won on irst and second serve. The percent-age of irst serves for the winner is similar to previous studies9. These values are also similar to conventional tennis3,13. This could indicate that the winners of the set have a better control of the serve situation than losing players, with better control of
effects, direction and hitting power in the serve, as happens in conventional tennis14.
Regarding the return, winners had a signiicantly higher number of points than losers. These differences may be due to two aspects. Firstly, the loser does not dominate with his serve so does not gain winning points, and secondly, the winner makes more offensive returns with the intention to have the initiative. The values found in wheelchair tennis were higher than in conventional tennis10,16. The reason for the differences between wheelchair tennis players and conventional tennis players could be that the wheelchair or the player’s injury does not allow the player to use the entire kinetic chain (lower body). Additionally, the contact height is lower, and the server, after serving, has to move quickly from a static to a dynamic situation7.
Winners convert more break points than the loser. The values found are higher than in conventional tennis10,16. These differ-ences, close to 20%, show that wheelchair tennis players are more likely to break serve than in conventional tennis. The cause, as mentioned previously, is properly related to the serve being less aggressive in wheelchair tennis than in conventional tennis.
Winning players presented almost twice as many winning returns and more winning shots than the loser. This could be because winning players have a better technical-tactical control in hitting (direction, distance, spin, and power), are more offensive/ aggressive, and/or competence with the wheelchair (recoveries, movement speed, and position). The ratio of winning shot per points is slightly better in wheelchair tennis than in conventional tennis16, 1:2.56 and 1:2.75, respectively.
Winning players presented better outcomes than losing player in all variables. Losing players had a similar number of net points than winning players (about 3-3.8 times per set), but wining players had better effectiveness than losing players (64% vs 51). These values are lower than in conventional tennis2,13, which seems to indicate than net points are less common in the wheelchair tennis game.
Considering together all the actions studied, two variables were found to best represent the difference between winning or losing, break points won and percentage of points won on irst serve. Therefore, winning players have the capacity with their irst serve to dificult returner´s action and they are more aggressive or effective returning the serve, making lower number of errors during the match.
Future studies are need in wheelchair tennis to increase the knowledge about this sport. The kind of injury and physical ca-pacities and skills may have an inluence on the serve, concerning the impact point, the people with more stability could produce and hit the ball with a greater angle from the top7. Therefore, this relationship must be studied in order to know their relationship with technical-tactical actions and with the result of the set.
Wheelchair tennis is one of the adapted sports which has most grown competitively in the last decade. In search of pro-fessionalism, it is necessary to know what the differences are that determine the possibility to win or lose a match. Winner gets the greatest number of aces, percentage of points won on irst and second serve, and return points and break points won. The winning wheelchair tennis player is a more offensive player (greater number of winning shots) and does fewer errors) than the loser. The differences in the role of the serve, the impor-tance of the return actions, or the eficacy percentage must be
considered when working with male WT players. With this study it has been advanced that match statistics may be used to distinguish players results. Wheelchair tennis coach’s can used these values to establish goal setting in its exercises and to achieve high performance levels playing wheelchair tennis. Our data may contribute to a better understanding of wheelchair tennis and may help to design training drills according the real needs from the game situation.
References
1. Hizan H, Whipp P, Reid M. Gender differences in the spatial distributions of the tennis serve. Int J Sport Sci Coach. 2015; 10(1): 87-96.
2. O ’Donoghue P, Ingram B. A notational analysis of elite tennis strategy. J Sports Sci. 2001; 19(2): 107-115. doi:10.1080/026404101300036299.
3. Barnett T, Meyer D, Pollard G. Applying match statistics to in-crease serving performance. J Med Sci Tennis. 2008; 13(2): 24-27. 4. Lofing F, Hagemann N, Strauss B. Automated processes in
tennis: do left-handed players beneit from the tactical prefer -ences of their opponents? J Sports Sci. 2010; 28(4): 435-443. doi:10.1080/02640410903536459.
5. Filipčič A, Caks K, Filipčič T. A comparison of selected match characteristics of female tennis player. Kinesiol Slov. 2011; 17(2): 14-24.
6. ITF. Rules of Tennis. London; 2012.
7. Sanz D. Wheelchair Tennis. Barcelona: Paidotribo; 2003. 8. Goosey-Tolfrey VL, Moss AD. Wheelchair velocity of tennis
players during propulsion with and without the use of racquets. Adapt Phys Act Q. 2005; 22: 291-301.
9. Sánchez-Pay A, Torres-Luque G, Fernandez-García ÁI, Sanz-Rivas D. Análisis de la inluencia de la supericie de juego en individual masculino en el tenis en silla de ruedas. CCD. 2013; 8(9): 217-222.
10. Katić R, Milat S, Zagorac N, Durović N. Impact of game elements on tennis match outcome in Wimbledon and Roland Garros 2009. Coll Antropol. 2011; 35(2): 341-346. http://www.ncbi.nlm.nih. gov/pubmed/21755700.
11. Ntoumanis N. A Step-by-Step Guide to SPSS for Sport and Exercise Studies. London: Routledge; 2001.
12. Tabachnick BG, Fidell LS. Using Multivariate Statistics (3rd Edition). New York: Harper Collins; 2001.
13. Brown E, O’Donoghue P. Gender and Surface Effect on Elite Tennis Strategy. Coach Sport Sci Rev. 2008; 46(15): 9-11. 14. Gillet E, Leroy D, Thouvarecq R, Stein J-F. A notational analysis
of elite tennis serve and serve-return strategies on slow sur-face. J Strength Cond Res. 2009; 23(2): 532-539. doi:10.1519/ JSC.0b013e31818efe29.
15. Cross R, Pollard G. Grand Slam men’s singles tennis 1991-2009. Serve speeds and other related data. Coach Sport Sci Rev. 2009; 16(49): 8-10.
Corresponding author
Alejandro Sánchez-Pay
Universidad de Murcia, Murcia, Spain Email: [email protected]
Manuscript received on April 28, 2017
Manuscript accepted on May 27, 2017