Self-perception of oral health among schoolchildren in a city of Amazonas,
Brazil: related factors
Autopercepção em saúde bucal em escolares de uma cidade do Amazonas: fatores relacionados
Fabio RODRIGUES1
Adriana Gama REBOUÇAS1
Flávia Martão FLÓRIO1
ABSTRACT
Objective
The association between self-perception in oral health, history of caries and sex was evaluated in students from São Gabriel da Cachoeira, in the Brazilian state of Amazonas.
Methods
The sample was composed of 509 students enrolled in six public schools of the municipal and state education system. The epidemiological study was performed by a calibrated examiner (Kappa=0.98) using the DMF-T and dmf-t indices. Self-perception in oral health was measured using the CPQ8-10 Child Perceptions Questionnaire for children aged between 8 and 10 and the CPQ11-14 for children aged between 11 and 14, in which the domains were oral symptoms, functional limitation, emotional well-being and social well-being.
Results
The signiicance of the associations between the variables was tested using bivariate analysis, and the associations that presented p-values lower than 0.20 (p<0.20) were tested using multiple logistic regression models, the intention being to keep those with p≤0.05. The group aged between 8 and 10 years showed a mean DMF-T of 0.82 (± 1.33) and dmf-t of 2.54 (± 2.59), whilst the group aged between 11 and 14 had a DMF-T of 2.08 (± 2.41) and dmf-t of 1.5 (± 1.77).
Conclusion
Sex was the variable that most inluenced the dimensions evaluated, followed by the oral condition. The presence of decayed teeth did not inluence the children's self-perception about their oral health.
Indexing terms: Dental caries. Oral health. Quality of life. Self-concept.
RESUMO
Objetivo
Avaliar a associação entre a autopercepção em saúde bucal com a experiência de cárie e sexo em estudantes do município de São Gabriel da Cachoeira, Amazonas - Brasil.
Métodos
A amostra foi composta por 509 alunos matriculados nas seis escolas públicas da rede municipal e estadual de ensino do município. O exame epidemiológico foi realizado por examinador calibrado (Kappa=0,98), utilizando-se os índices CPO-D e ceo-d e a autopercepção em saúde foi aferida utilizando-se os instrumentos Child Perceptions Questionnaire CPQ8-10 para as crianças entre 8 a 10 anos e CPQ11-14 para as crianças entre 11 a 14 anos, considerando-se os domínios sintomas orais, limitação funcional, bem-estar emocional e bem-estar social.
Resultados
As signiicâncias das associações entre as variáveis foram testadas pela análise bivariada e as associações que apresentaram p-valor inferior a 0,20 (p<0,20) foram testadas nos modelos de regressão logística múltipla, permanecendo aquelas com p≤0,05. O grupo de 08 a 10 anos apresentou valor médio do CPO-D de 0,82 (± 1,33) e o ceo-d 2,54 (± 2,59), enquanto o grupo de 11 a 14 anos o CPO-D foi de 2,08 (± 2,41) e o ceo-d 1,5 (± 1,77).
Conclusão
Conclui-se que o sexo foi a variável que mais inluenciou nas dimensões avaliadas, seguida da condição bucal e que a presença de dentes cariados não inluenciou a autopercepção das crianças sobre a sua saúde bucal.
Termos de indexação: Cárie dentária. Saúde bucal. Qualidade de vida. Autoimagem.
INTRODUCTION
Clinical indicators can be used to measure the population’s health, however, the use of subjective indicators that evaluate the impact on quality of life, by means of self-perception, encompassing psychological and social aspects, adds new understanding of how diseases affect the individual as a whole1-2.
In this context, there are speciic, validated questionnaires that make it possible to measure the impact
of these problems on individuals’ quality of life3. Although
the perceptions of adults and children are different, as children and teenagers have a singular perspective of themselves and the world, due to the stage of physical and emotional development in which they ind themselves4. So
speciic tools have been developed for these publics5-7, which
include the CPQ8-105,8 and the CPQ11-145,9 recommended
Examiner training and calibration
Prior to carrying out the epidemiological survey, the researcher was calibrated in the Professor Olintho de Oliveira state elementary school (in Porto Alegre, in the state of Rio Grande do Sul), with the participation in the process of 30 children aged between 8 and 14. The steps proposed in the SBBrasil2010 Field Staff Manual13 for
examiner calibration were followed and the intra-examiner Kappa value was equal to 0.98.
Evaluation of self-perception
In order to verify the children’s self-perception of oral health, the validated Brazilian version8 of the
CPQ8-10 Child Perceptions Questionnaire5 was used, for children
from 8 to 10-years-old, with 29 questions divided into four domains (oral symptoms, functional limitation, emotional well-being and social well-being) and the validated Brazilian version9 of the CPQ11-14 Child Perceptions Questionnaire5
for 11 to 14-year-olds, with 41 questions divided into the aforementioned four domains. The questionnaires were individually applied by a trained assistant in a reserved classroom. After the children answered the questionnaire, they were led to the clinical examination area separate from the classroom.
Evaluation of experience of dental caries
The evaluation was conducted by a team composed of a coordinator/monitor, an examiner, a note taker and an interpreter (some parents and/or guardians could only speak the native dialect) and the clinical examination was carried out in a spacious room with good natural lighting and with the examiners seated on school chairs. Experience of dental caries with crowns in the permanent dentition was estimated for all ages by means of the DMF-T index (Decayed, Missing and Filled Teeth)14-15. Immediately after
the application of the questionnaire and the performance of the clinical examination, the participants watched a lecture about prevention and dental education, and were subsequently instructed on proper oral hygiene methods. Those children who needed dental treatment were referred for treatment at the Garrison Hospital in São Gabriel da Cachoeira.
Data analysis technique
The epidemiological data were arranged into (absolute and relative) frequency distribution tables, descriptive statistics (mean, standard deviation, median, minimum and maximum values). Data related to quality of São Gabriel da Cachoeira is the third largest municipality
in Brazil in terms of size of territory, with a population composed of around 76% native Indians and their descendants, and is thus the city with the largest proportion of people declared as being native in Brazil10 and with
more than 6,350 enrolled schoolchildren having severe shortcomings in terms of their general and oral health11.
It has already been shown that there have not been enough studies using the proper methodology addressing the oral health of indigenous peoples in Latin America, affording this population an epidemiological invisibility that adversely affects the production of knowledge of oral health conditions as well as the production of strategies for prevention and health promotion12.
Carrying out for the irst time an epidemiological survey of dental caries in schoolchildren in this locality, together with an evaluation of the disease’s impact on these children’s quality of life, could help to redirect the type of approach used by health managers, providing guidance on the use of resources, treatment and behavior for better integrated health care for the individuals and the promotion of citizenship.
METHODS
Population, study sample and inclusion/exclusion criteria
This was a quantitative, analytical, cross-sectional study approved by the Ethics Committee at the São Leopoldo Mandic Dental Research Unit, under reference no. 2011/0004, and it was performed in accordance with the principles deined in the Ministry of Health’s National Health Council Resolution 196/96.
The study population was composed of 1,240 children who were born between 01/01/1997 and 12/31/2003 and were enrolled in 2011 in 6 schools in the municipality of São Gabriel da Cachoeira, in the Brazilian state of Amazonas, two of which were part of the municipal system and 4 were state schools.
of life tools were analyzed by linking each independent variable to the response variables (tool dimensions and total value). Variables with p≤0.20 in the individual analyses were tested in multiple logistic regression models, those with p≤0.05 remaining in the model. The dependent variables were dichotomized at the median. The response categories for questions related to the child’s perception of his/her oral health condition and to perception of the harm that oral conditions cause on a day-to-day basis were dichotomized in order to avoid data imbalance. The analyses were carried out using the SAS statistical program (SAS Institute Inc., Cary, NC, USA, Release 8.2, 2001)16.
Table 1. Descriptive analysis of variances related to the experience of caries. São Gabriel da Cachoeira (Amazonas), 2011.
Variable Mean Standard deviation Median Minimum Maximum 8 to 10 age group (n=256)
Component D 0.66 (80.5%) 1.21 0.00 0.00 10.00
Component M 0.02 (2.4%) 0.16 0.00 0.00 2.00
Component F 0.15 (18.3%) 0.49 0.00 0.00 3.00
DMF 0.82 1.33 0.00 0.00 10.00
11 to 14 age group (n=253)
Component D 1.30 (62.5%) 2.06 0.00 0.00 12.00
Component M 0.09 (4.3%) 0.30 0.00 0.00 2.00
Component F 0.68 (32.7%) 1.21 0.00 0.00 7.00
DMF 2.08 2.41 1.00 0.00 12.00
RESULTS
Epidemiological data
The frequency of children without caries was 23% for the 8 to 10-year-old group and 53.4% for the 11 to 14 age group. Table 1 presents a descriptive analysis of the variables related to the severity of the dental caries, highlighting the high proportion of the decayed component, particularly in the group of younger children, as the 11 to 14 age group shows a higher proportion of restored components in the composition of the index.
Impact on quality of life
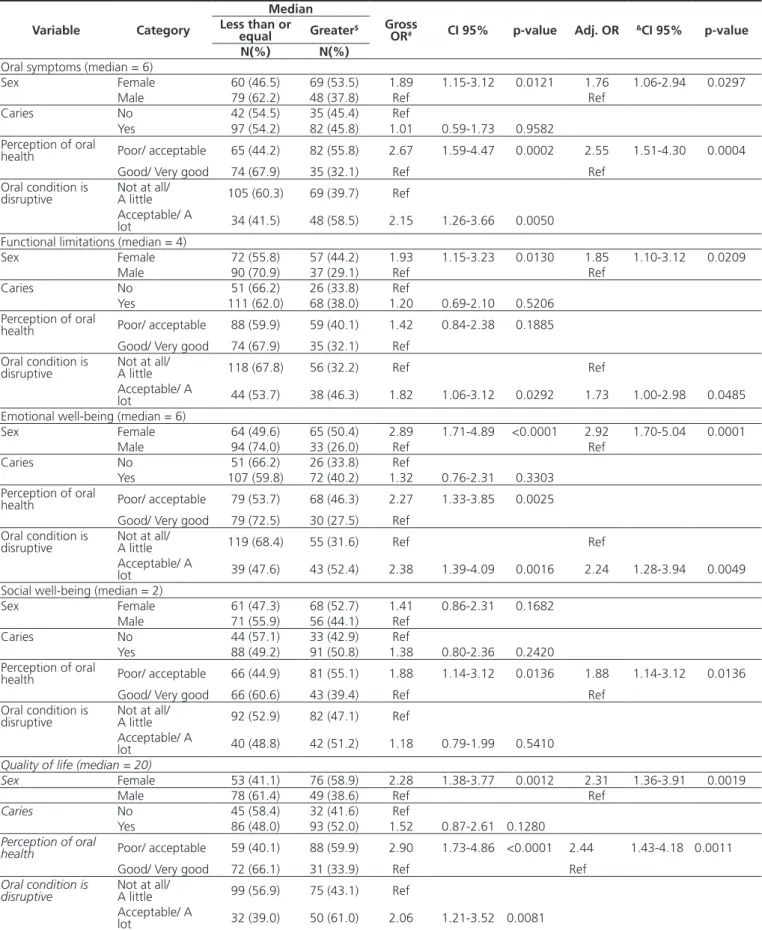
Table 2 shows the associations between the variables studied and the dependent variables dichotomized at the median, for the group of 8 to 10-year-olds. Taking into consideration the individually assessed dimensions, it can be seen that with the female children, the oral health condition negatively impacted (highest score) all the dimensions, except for “social well-being”. Having dental caries, at an epidemiological level, did not have an impact on any of the dimensions. Children who perceive their oral health situation as poor or acceptable showed a negative impact in the oral symptoms and social well-being dimensions and children who reported that their oral condition interferes with their day-to-day routine, showed an impact in the functional limitation and emotional well-being dimensions. As for quality of life, a signiicant association was found in the individual analyses with gender, child’s perception with regard to their oral health situation and harm to daily activities as a result of their oral health condition (p≤0.05). Multiple analysis showed
that female children who perceive their oral health to be poor or acceptable are 2.31 (CI 95%:1.36-3.91) and 2.44 (CI 95%:1.43-4.18) times more likely to present a more negative impact (highest score) on quality of life (p≤0.05).
Table 2. Results of the individual and multiple logistic regression analyses taking into account separately the dimensions and quality of life of children between 8 and 10 years of age. São Gabriel da Cachoeira (Amazonas), 2011.
Median
Variable Category Less than or equal Greater$ Gross
OR# CI 95% p-value Adj. OR &CI 95% p-value
N(%) N(%)
Oral symptoms (median = 6)
Sex Female 60 (46.5) 69 (53.5) 1.89 1.15-3.12 0.0121 1.76 1.06-2.94 0.0297 Male 79 (62.2) 48 (37.8) Ref Ref
Caries No 42 (54.5) 35 (45.4) Ref
Yes 97 (54.2) 82 (45.8) 1.01 0.59-1.73 0.9582 Perception of oral
health Poor/ acceptable 65 (44.2) 82 (55.8) 2.67 1.59-4.47 0.0002 2.55 1.51-4.30 0.0004 Good/ Very good 74 (67.9) 35 (32.1) Ref Ref
Oral condition is
disruptive Not at all/ A little 105 (60.3) 69 (39.7) Ref Acceptable/ A
lot 34 (41.5) 48 (58.5) 2.15 1.26-3.66 0.0050 Functional limitations (median = 4)
Sex Female 72 (55.8) 57 (44.2) 1.93 1.15-3.23 0.0130 1.85 1.10-3.12 0.0209 Male 90 (70.9) 37 (29.1) Ref Ref
Caries No 51 (66.2) 26 (33.8) Ref
Yes 111 (62.0) 68 (38.0) 1.20 0.69-2.10 0.5206 Perception of oral
health Poor/ acceptable 88 (59.9) 59 (40.1) 1.42 0.84-2.38 0.1885 Good/ Very good 74 (67.9) 35 (32.1) Ref
Oral condition is
disruptive Not at all/ A little 118 (67.8) 56 (32.2) Ref Ref Acceptable/ A
lot 44 (53.7) 38 (46.3) 1.82 1.06-3.12 0.0292 1.73 1.00-2.98 0.0485 Emotional well-being (median = 6)
Sex Female 64 (49.6) 65 (50.4) 2.89 1.71-4.89 <0.0001 2.92 1.70-5.04 0.0001 Male 94 (74.0) 33 (26.0) Ref Ref
Caries No 51 (66.2) 26 (33.8) Ref
Yes 107 (59.8) 72 (40.2) 1.32 0.76-2.31 0.3303 Perception of oral
health Poor/ acceptable 79 (53.7) 68 (46.3) 2.27 1.33-3.85 0.0025 Good/ Very good 79 (72.5) 30 (27.5) Ref
Oral condition is
disruptive Not at all/ A little 119 (68.4) 55 (31.6) Ref Ref Acceptable/ A
lot 39 (47.6) 43 (52.4) 2.38 1.39-4.09 0.0016 2.24 1.28-3.94 0.0049 Social well-being (median = 2)
Sex Female 61 (47.3) 68 (52.7) 1.41 0.86-2.31 0.1682 Male 71 (55.9) 56 (44.1) Ref
Caries No 44 (57.1) 33 (42.9) Ref
Yes 88 (49.2) 91 (50.8) 1.38 0.80-2.36 0.2420 Perception of oral
health Poor/ acceptable 66 (44.9) 81 (55.1) 1.88 1.14-3.12 0.0136 1.88 1.14-3.12 0.0136 Good/ Very good 66 (60.6) 43 (39.4) Ref Ref
Oral condition is
disruptive Not at all/ A little 92 (52.9) 82 (47.1) Ref Acceptable/ A
lot 40 (48.8) 42 (51.2) 1.18 0.79-1.99 0.5410
Quality of life (median = 20)
Sex Female 53 (41.1) 76 (58.9) 2.28 1.38-3.77 0.0012 2.31 1.36-3.91 0.0019 Male 78 (61.4) 49 (38.6) Ref Ref
Caries No 45 (58.4) 32 (41.6) Ref
Yes 86 (48.0) 93 (52.0) 1.52 0.87-2.61 0.1280
Perception of oral
health Poor/ acceptable 59 (40.1) 88 (59.9) 2.90 1.73-4.86 <0.0001 2.44 1.43-4.18 0.0011
Good/ Very good 72 (66.1) 31 (33.9) Ref Ref
Oral condition is
disruptive Not at all/ A little 99 (56.9) 75 (43.1) Ref Acceptable/ A
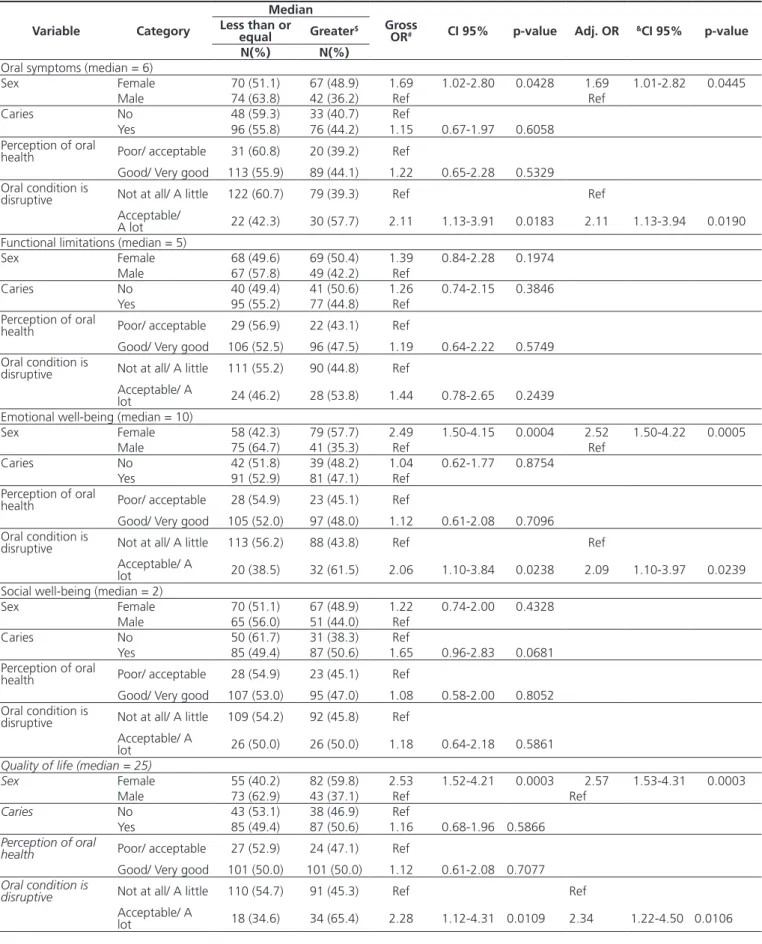
Table 3. Results of the individual and multiple logistic regression analyses separately taking into account the dimensions and quality of life of children between 11 and 14 years of age. São Gabriel da Cachoeira (Amazonas), 2011.
Median
Variable Category Less than or equal Greater$ Gross
OR# CI 95% p-value Adj. OR &CI 95% p-value
N(%) N(%)
Oral symptoms (median = 6)
Sex Female 70 (51.1) 67 (48.9) 1.69 1.02-2.80 0.0428 1.69 1.01-2.82 0.0445 Male 74 (63.8) 42 (36.2) Ref Ref
Caries No 48 (59.3) 33 (40.7) Ref
Yes 96 (55.8) 76 (44.2) 1.15 0.67-1.97 0.6058 Perception of oral
health Poor/ acceptable 31 (60.8) 20 (39.2) Ref
Good/ Very good 113 (55.9) 89 (44.1) 1.22 0.65-2.28 0.5329 Oral condition is
disruptive Not at all/ A little 122 (60.7) 79 (39.3) Ref Ref Acceptable/
A lot 22 (42.3) 30 (57.7) 2.11 1.13-3.91 0.0183 2.11 1.13-3.94 0.0190 Functional limitations (median = 5)
Sex Female 68 (49.6) 69 (50.4) 1.39 0.84-2.28 0.1974 Male 67 (57.8) 49 (42.2) Ref
Caries No 40 (49.4) 41 (50.6) 1.26 0.74-2.15 0.3846 Yes 95 (55.2) 77 (44.8) Ref
Perception of oral
health Poor/ acceptable 29 (56.9) 22 (43.1) Ref
Good/ Very good 106 (52.5) 96 (47.5) 1.19 0.64-2.22 0.5749 Oral condition is
disruptive Not at all/ A little 111 (55.2) 90 (44.8) Ref Acceptable/ A
lot 24 (46.2) 28 (53.8) 1.44 0.78-2.65 0.2439 Emotional well-being (median = 10)
Sex Female 58 (42.3) 79 (57.7) 2.49 1.50-4.15 0.0004 2.52 1.50-4.22 0.0005 Male 75 (64.7) 41 (35.3) Ref Ref
Caries No 42 (51.8) 39 (48.2) 1.04 0.62-1.77 0.8754 Yes 91 (52.9) 81 (47.1) Ref
Perception of oral
health Poor/ acceptable 28 (54.9) 23 (45.1) Ref
Good/ Very good 105 (52.0) 97 (48.0) 1.12 0.61-2.08 0.7096 Oral condition is
disruptive Not at all/ A little 113 (56.2) 88 (43.8) Ref Ref Acceptable/ A
lot 20 (38.5) 32 (61.5) 2.06 1.10-3.84 0.0238 2.09 1.10-3.97 0.0239 Social well-being (median = 2)
Sex Female 70 (51.1) 67 (48.9) 1.22 0.74-2.00 0.4328 Male 65 (56.0) 51 (44.0) Ref
Caries No 50 (61.7) 31 (38.3) Ref
Yes 85 (49.4) 87 (50.6) 1.65 0.96-2.83 0.0681 Perception of oral
health Poor/ acceptable 28 (54.9) 23 (45.1) Ref
Good/ Very good 107 (53.0) 95 (47.0) 1.08 0.58-2.00 0.8052 Oral condition is
disruptive Not at all/ A little 109 (54.2) 92 (45.8) Ref Acceptable/ A
lot 26 (50.0) 26 (50.0) 1.18 0.64-2.18 0.5861
Quality of life (median = 25)
Sex Female 55 (40.2) 82 (59.8) 2.53 1.52-4.21 0.0003 2.57 1.53-4.31 0.0003 Male 73 (62.9) 43 (37.1) Ref Ref
Caries No 43 (53.1) 38 (46.9) Ref
Yes 85 (49.4) 87 (50.6) 1.16 0.68-1.96 0.5866
Perception of oral
health Poor/ acceptable 27 (52.9) 24 (47.1) Ref
Good/ Very good 101 (50.0) 101 (50.0) 1.12 0.61-2.08 0.7077
Oral condition is
disruptive Not at all/ A little 110 (54.7) 91 (45.3) Ref Ref
Acceptable/ A
DISCUSSION
Of the children who were examined, together representing over 40% of the municipality’s base population in the age brackets of interest to the study, it was found that the decayed component was the one which contributed the most to the caries index, although this condition has not inluenced self-perception in health or in its dimensions, in either of the studied groups.
By means of clinical indicators1 it was observed
that among the 8 to 10-year-old schoolchildren, 70.3% were in need of dental treatment, compared with 52.6% of the 11 to 14-year-olds17. In Brazil, according to the
national oral health survey (SB Brasil 2010), 12-year-old children and teenagers between the ages of 15 and 19 displayed, respectively, average DMF-T values of 2.07 and 4.25 at the national level and 3.16 and 5.64 in the Northern region14. Of the students in the present study,
the means are lower than both the regional and national averages, with DMF-T values of 0.82 and 2.08 for the 8 to 10-year-old group and 11 to 14-year-old groups, respectively. However, when analyzing the percentage contribution of each DMF-T component, there was found to be a predominance of the decayed component and that the values for this component among the students in the present study (80.5% in the 8 to 10-year-old group and 62.5% in the 11 to 14-year-old group) exceeded the national values (54.1% at 12 years of age and 35.8% in the 15 to 19-year-old group)14, emphasizing the disparate
distribution of caries disease, with the deinition of characteristic groups of polarization and dificulties of access to the service.
Despite being third in Brazil in terms of size of territory, with 109,181.24 km²18, the municipality of São Gabriel da Cachoeira has at its disposal just one hospital, the Garrison Hospital, belonging to the Brazilian Army, and 24 health establishments, 22 of which serve the public under the auspices of the national health service (SUS), and 14 have day clinics with dental services19. Moreover, the
population has great dificulty in getting to the healthcare centers, as do the professionals in reaching certain regions due to access, transportation and endemic factors which, when added to the absence of a luoridation system in the water supply20, consign the population to a high rate of
oral diseases.
The dificulty encountered for access to health and the scarcity of epidemiological studies using suitable methodology, addressing the oral health of
native peoples12, show the importance of carrying out
fresh studies that seek to understand the sociocultural drivers and investigate oral health self-perception in this population. An understanding of the sociocultural drivers and the investigation into oral health self-perception in children and teenagers is fundamental to the planning of health promotion and education actions that can result in improvements to the population’s quality of life14 thereby
justifying the relevance of carrying out this novel study in view of the peculiarities of the chosen population.
Self-perception of oral health was evaluated in the present study by means of the CPQ8-10 questionnaire for children between 8 and 10 years of age, and the CPQ 11-14 for children in the 11 to 14 age bracket, which are subjective indicators that measure the relationship between quality of life and oral disorders in these age ranges, divided into the following domains: oral symptoms, functional limitations, emotional well-being and social well-being5,8-9.
Females exhibited a negative impact in the oral symptoms, functional limitations and emotional well-being domains in the 8 to 10 age group and in the oral symptoms and emotional well-being domains in the 11 to 14 age group, being 2.31 and 2.57 times more likely, respectively, to present an impact on quality of life. The difference between males and females may be attributed to differences in perception of health and the value of oral health between the two sexes21. Studies show that
females have a greater negative oral health impact in daily activities22 and that girls seek treatment for less severe oral
health conditions23.
The oral symptoms domain had an impact on quality of life in both of the groups studied, with 8 to 10-year-olds having a worse perception of oral health and 11 to 14-year-olds reporting that their teeth and mouths get in the way of their daily activities. Given the high proportion of the decayed component in the experience of caries in the children examined, it is expected that the children are feeling pain or discomfort, which explains this inding. Dental caries may cause symptoms such as toothache and discomfort, bad breath and food impaction24. The experience of caries
may also cause an emotional impact in children who may feel sad, irritated/frustrated or concerned about their teeth24, which was demonstrated in the present study by the
presence of the impact on the emotional well-being domain for both groups studied.
domain, when related to perception of oral health, the 11 to 14-year-old group of children did not. It has to be borne in mind that children and teenagers have a peculiar view of themselves and the world and this perception varies according to the physical and emotional phase of development in which they ind themselves4. Despite the
fact that the distribution of caries lesions in the mouth was not evaluated in the present study, it is possible that the absence of any impact for the 11 to 14-year-olds in this domain, an age group that encompasses adolescence, is explained by the presence of cavities limited to the posterior teeth. Studies show that Brazilian teenagers who have caries in the anterior teeth have a 30% greater impact on the quality of life in the social well-being domain while students who only have caries in the rear portion do not demonstrate this impact24. Fresh
studies on this population are recommended for a better evaluation of this question.
According to the literature, there is a greater impact on quality of life among teenagers22 and children25 when
they have 4 or more untreated caries lesions. However, in the present study, oral health condition was only linked to the functional limitations domain amongst children aged between 8 and 10, even though this group exhibited a lower DMF-T than the group of 11 to 14-year-olds. One possible explanation for this might be the fact that children at school attribute more importance of oral health to factors such as good hygiene practices and the presence of healthy teeth while teenagers associate oral health with social interaction and comparing themselves to their peers4.
The present study presents limitations inherent to the cross-sectional nature in its design and thus it is not
possible to infer causality from the associations found. Moreover, there was no control group in the analysis for factors that the literature shows have an inluence, such as socioeconomic conditions22,26-27. However, it may
be expected that the evaluation of children attending only public schools may diminish the effect of the socioeconomic characteristics.
The use of subjective tools to evaluate health are useful for identifying self-perceived needs, and the identiication of these needs may improve our understanding of access to health, expectations and effectiveness of treatment. In addition, it provides supporting data that help to create health strategies that aim to improve living conditions and the promotion of healthy behavior.
CONCLUSION
It may be concluded that gender was the variable that most inluenced the dimensions evaluated, followed by oral condition, and that the presence of decayed teeth did not have an inluence on children’s self-perceptions of their oral health.
Collaborators
F RODRIGUES and FM FLÓRIO conceived the study. F RODRIGUES was responsible for the ield research and writing the article. AG REBOUÇAS contributed to the inal and critical review of the manuscript. FM FLÓRIO guided the research, cooperated with data analysis and writing the article.
REFERENCES
1. Lacerda JT, Castilho EA, Calvo MCM, Freitas STF. Saúde bucal e o desempenho diário de adultos em Chapecó, Santa Catarina, Brasil. Cad Saude Publica. 2008;24(8):1846-58. doi: 10.1590/ S0102-311X2008000800013
2. Gabardo MCL, Moysés ST, Moysés S. Autopercepção de saúde bucal conforme o Peril de Impacto da Saúde Bucal (OHIP) e fatores associados: revisão sistemática. Rev Panam Salud Publica. 2013;33(6):439-45.
3. WHO. World Health Organization. Oral health surveys: basic methods. 5th ed. Geneva: World Health Organization; 2013. 4. Maida CA, Marcus M, Hays RD, Coutler ID, Ramos-Gomez F,
Lee SY, et al. Child and adolescent perceptions of oral health over the life course. Qual Life Res. 2015;24(11):2739-51. doi: 10.1007/s11136-015-1015-6
5. Jokovic A, Locker D, Stephens M, Kenny D, Tompson B, Guyatt G. Validity and reliability of a questionnaire for measuring child oral-health-related quality of life. J Dent Res. 2002;81(7):459-63.
6. Franz LN, Clericus RR, Bravo-Cavivvhioli D, del Rio PJ, Gonzalez CF, Delgado GM. Adaptacion y validacion al español del cuestionario de percepcion infantil CPQ-Esp11-14 em población comunitária chilena. Rev Esp Salud Publica. 2015; 89:585-595. 7. Tsakos G, Blair Y, Yusuf H, Wright W, Watt R, Macpherson
LMD. Developing a new self-reported scale of oral health outcomes for 5-year-old children (SOHO-5). Health Qual Life Out. 2012;10:62. doi: 10.1186/1477-7525-10-62
9. Goursand D, Paiva SM, Zarzar PM, Ramos-Jorge ML, Cornacchia GM, Pordeus IA et al. Cross-cultural adaptation of the Child Perceptions Questionnaire 11-14 (CPQ11-14) for the Brazilian Portuguese language. Health Qual Life Out. 2008;6:2. doi: 10.1186/1477-7525-6-2
10. Souza MLP, Orellana JDY. Suicide mortality in São Gabriel da Cachoeira, a predominantly indigenous Brazilian municipality. Rev Bras Psiquiatr. 2012;34(1):34-7. doi: 10.1590/S1516-44462012000100007
11. Alves EC. Fundação de São Gabriel da Cachoeira. In: São Gabriel da Cachoeira, sua saga, sua história. Goiânia: Kelps; 2007. 12. Alves Filho P, Santos RV, Vettore MV. Fatores associados a cárie
dental e doença periodontal em indígenas na América Latina: revisão sistemática. Rev Panam Salud Publica. 2014;35(1):67-77. 13. Brasil. Ministério da Saúde. Secretaria de Atenção à Saúde.
Departamento de Atenção Básica, Coordenação Nacional de Saúde Bucal. Projeto SB Brasil 2010. Manual da Equipe de Campo. Brasília: MS-CNSB; 2009 [citado 2016 Jul 15]. Disponível em: <http://dab.saude.gov.br/CNSB/sbbrasil/arquivos/SBBrasil2010_ Manual_Equipe_Campo.pdf>.
14. Brasil. Ministério da Saúde. Secretaria de Atenção à Saúde. Departamento de Atenção Básica, Coordenação Nacional de Saúde Bucal. Projeto SB Brasil 2010. Condições de saúde bucal da população brasileira 2002-2010: resultados principais. Brasília: MS-CNSB; 2011 [citado 2016 Jul 15]. Disponível em: <http://dab.saude.gov.br/CNSB/sbbrasil/arquivos/projeto_ sb2010_relatorio_inal.pdf>.
15. WHO. World Health Organization. Oral health surveys: basic methods. 4th ed. Geneva: World Health Organization; 2007. 16. SAS Institute Inc., Cary, NC, USA, Release 8.2, 2001.
17. Diab AD, Lucas SD. Cárie dentária em crianças indígenas Xakriabá. Epidemiol Serv Saúde. 2008;17(2):123-53. doi: 10.5123/S1679-49742008000200014
18. IBGE - Instituto Brasileiro de Geograia e Estatística. Amazonas, São Gabriel da Cachoeira, síntese das informações, 2016 [internet]. [citado 2016 Jun 20]. Disponível em: <http://cod. ibge.gov.br/8WS>.
19. IBGE, Instituto Brasileiro de Geograia e Estatística. Assistência médica sanitária 2009 [internet] Rio de Janeiro: IBGE, 2010 [citado 2016 Jun 20]. Disponível em: <http://cidades.ibge.gov. br/xtras/peril.php?codmun=130380>.
20. Soares OE. Ações em saúde indígena amazônica: o modelo do Alto Rio Negro. São Gabriel da Cachoeira: FOIRN; 2007. 21. Kawamura M, Takase N, Sasahara H, Okada M. Teenagers'
oral health attitudes and behavior in Japan: comparison by sex and age group. J Oral Sci. 2008;50(2):167-74. doi: 10.2334/ josnusd.50.167
22. Peres KG, Cascaes AM, Leão ATT, Côrtes MIS, Vettore MV. Sociodemographic and clinical aspects of quality of life related to oral health in adolescents. Rev Saude Publica. 2013;47(3):19-28. doi: 10.1590/S0034-8910.2013047004361
23. Harris EF, Glassell BE. Sex differences in the uptake of orthodontic services among adolescents in the United States. Am J Orthod Dento Facial Orthop. 2011;140:543-9. doi: 10.1016/j.ajodo.2010.11.023
24. Severo Alves L, Dam-Teixeira N, Susin C, Maltz M. Association among quality of life, dental caries treatment and intraoral distribution in 12-year-old South Brazilian schoolchildren. Community Dent Oral Epidemiol. 2013;41(1):22-9. doi: 10.1111/j.1600-0528.2012.00707.x
25. Alsumait A, ElSalhy M, Raine K, Cor K, Gokiert R, Al-Mutawa S, et al. Impact of dental health on children’s oral health-related quality of life: a cross-sectional study. Health Qual Life Out. 2015;13:98. doi: 10.1186/s12955-015-0283-8
26. Vale EB, Mendes ACG, Moreira RS. Autopercepção da saúde bucal entre adultos na região nordeste do Brasil. Rev Saude Publica. 2013;47:98-108. doi: 10.1590/S0034-8910.2013047004893
27. Gururatana O, Baker SR, Robinson PG. Determinants of children’s oral-health-related quality of life over time. Community Dent Oral Epidemiol. 2014;42;206-215