Oral hygiene practices, dental service use and
oral health self-perception of schoolchildren from
a rural zone in the Brazilian Northeast region
Práticas de higiene bucal, uso de serviço odontológico e
autopercepção de saúde bucal de escolares da zona rural de
Caruaru, PE, Brasil
Valdenice Aparecida de Menezes a,b Rachel Pollyana Falcão Lorena a Liliane Cristina Barbosa Rocha a Angéllica Falcão Leite b
Jainara Maria Soares Ferreira b Ana Flavia Granville-Garcia c
a School of Dentistry, Higher Education Association of Caruaru, Caruaru, PE, Brazil
b School of Dentistry, University of Pernambuco, Recife, PE, Brazil
c School of Dentistry, State University of Paraíba, Campina Grande, PB, Brazil
Correspondence:
Valdenice Aparecida de Menezes
R. Carlos Pereira Falcão 811/602, Boa Viagem Recife, PE – Brazil
51021-350
E-mail: [email protected]
Received: December 14, 2008 Accepted: November 24, 2009
Abstract
Purpose: To evaluate the oral hygiene practices, use of dental services and self-perception of oral health of school children from the rural areas of the city of Caruaru, PE, in the Northeast region of Brazil.
Methods: An exploratory cross-sectional study was carried out using interviews with structured questionnaires aimed at students aged between 6 and 12 years (n=150). Demographic and socio-economic data on oral hygiene practices, the use of dental services and self-perception of oral health were collected and analyzed using descriptive and inferential statistics (chi-square and Fisher’s exact tests).
Results: Most of the students cleaned their teeth (82.0%) with toothpaste (98.0%), a toothbrush available at the market (93.2%) and dental floss (26.4%). All students (150) had a toothbrush, the majority (86.7%) for individual use, and performed three or more daily brushings (56.4%). A significant portion had visited the dentist (72.7%) due to the need for treatment (57.8%) and toothache (33.0%). Among those who had never been to the dentist, fear (36.6%) was the main reason. The majority (56.0%) considered their teeth to be in good condition.
Conclusion: Despite the low socio-economic status of the evaluated population, changes in oral hygiene practices and the demand for dental care were observed.
Key words: Oral health, oral hygiene, schoolchildren, rural population
Resumo
Objetivo: Avaliar as práticas de higiene bucal, o uso de serviços odontológico e a autopercepção de saúde bucal de escolares da zona rural de Caruaru, PE, Brasil.
Metodologia: Através de estudo transversal exploratório usando entrevistas com formulário estruturado dirigidas a escolares na faixa etária de seis a 12 anos (n=150), foram coletados dados demográficos e sócio-econômicos relativos as práticas de higiene bucal, uso de serviços odontológico e autopercepção de saúde bucal, analisados por meio de estatística descritiva e inferencial (Qui-quadrado e Exato de Fisher).
Resultados: A maioria dos escolares limpava os dentes (82,0%) com dentifrício (98,0%), escova dentária disponível no mercado (93,2%) e fio dental (26,4%). Todos os escolares (150) tinham escova, a maioria (86,7%) de uso individual, e realizavam três ou mais escovações diárias (56,4%). Uma parcela significativa visitou o dentista (72,7%) devido à necessidade de tratamento (57,8%) e de dor de dente (33,0%). Dentre os que nunca foram ao dentista, o medo (36,6%) foi o principal motivo. A maioria (56,0%) avaliou que os seus dentes estão em bom estado.
Conclusão: A maior parte dos escolares possuía boas práticas de higiene bucal, já fez uso do serviço odontológico para necessidades curativas e relatou boa percepção sobre sua saúde bucal.
Introduction
Dental caries and periodontal disease still represent the
largest oral health problem in Brazil. Figures from the
latest epidemiological survey (1) show that at ive and 12
years, high percentages of children (59.3% and 68.9%,
respectively) have experienced dental caries, and around
2.5 million (13% of the population) adolescents, the stage
at which there is a signiicant percentage increase in dental
caries and periodontal disease (2), have never been to the
dentist.
In addition, socio-cultural, economic, political and educa-
tional factors inluence the biological factors that interact in
the etiology of such diseases (3). The methods of preventing
or controlling these diseases through the application of
relatively simple strategies, such as tooth brushing in order
to disrupt the plaque, diet control, luoride use and access
to dental care, showed improvement in children’s oral
health (4-5).
A signiicant portion of the population has no access to dental
care, and often rural areas have worse indicators of income,
sanitation and education levels than urban areas, constituting
an important factor for worsening health problems (6-8).
Considering the importance of these aspects, the aim of
this study was to evaluate the oral hygiene habits (tooth
brushing, lossing and alternative methods), the use of dental
services and self-perception of oral health in schoolchildren
between 6 and 12 years in the rural area of Caruaru, state of
Pernambuco, in the Northeast region of Brazil.
Methodology
This study was approved by the Ethics in Research Committee
of the Caruaruense Association of Higher Education under
the No. 065/07. The study design was cross-sectional, with
clinical-epidemiological and exploratory characteristics.
This research was conducted at a municipal school in the
rural area of Lajes village, located along the BR 104, 27 km
from the capital, Recife, in the transition range from the
wild-Caatinga
to the interior of Pernambuco State (PE), where
the population is estimated to be 2,798 inhabitants. The
main area of local employment is in clothing manufacturing.
In addition, there are also casual workers and a few rural
workers. Data were collected from interviews with local
school children of the Manoel Limeira Municipal School.
They were of both sexes, aged between six and twelve years
of age. The Manoel Limeira Municipal School was selected
from one of four schools in Lajes (PE) because it had the
highest number of students of that age group and was more
easily accessible than the other three candidate schools.
We excluded students who did not want to participate in the
study or whose parents did not allow them to participate.
The reference population consisted of 230 students from the
rural village, aged between six and 12 years. The sample size
calculation was 125 children, to which 20% was added to
compensate for possible drop-outs, resulting in 150 children.
Students who enrolled received a number that had been
selected by simple random sampling using the statistical
program EPI-INFO. The informed consent form was signed
by the parents of the students taking part in the sample when
they came to pick up their children at the end of the day.
The data collection was performed using a research
instrument consisting of a structured form containing 20
questions on demographic and socioeconomic factors related
to oral hygiene habits (frequency, methods and materials
used), visits to the dentist and oral health self-perception.
The students were interviewed individually in a private room
on the school grounds, and the answers were noted during
the interview.
Concerning the reliability of the responses, the test used the
method of face validation in 10% of respondents. With this
method, the researcher asks the teenagers to make clear in
their own words what they read about each question (9).
The data were analyzed using descriptive statistics through
absolute and percentage distributions and the chi-square or
Fisher’s exact test. The level of signiicance was 5%. Odds
ratio values (OR) and conidence intervals for this measure
were obtained.
Results
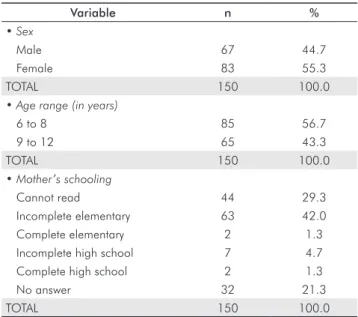
Table 1 shows that
the highest percentage of students
was female (55.3%), and ages ranged from 6 to 8 years
(56.7%). Most mothers had incomplete primary education
(42.0%) and were working, and more than half (57.3%)
were employed.
Table 1. Distribution of respondents according to the characte- rization variables.
Variable n %
• Sex
Male 67 44.7
Female 83 55.3
TOTAL 150 100.0
• Age range (in years)
6 to 8 85 56.7
9 to 12 65 43.3
TOTAL 150 100.0
• Mother’s schooling
Cannot read 44 29.3
Incomplete elementary 63 42.0
Complete elementary 2 1.3
Incomplete high school 7 4.7
Complete high school 2 1.3
No answer 32 21.3
TOTAL 150 100.0
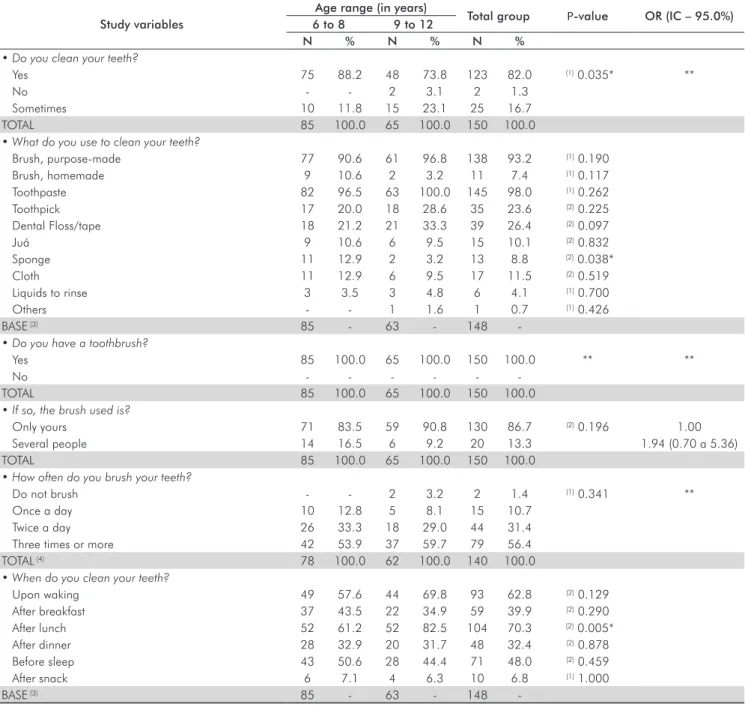
Table 2 shows that the majority of respondents always clean
their teeth (82.0%) the highest percentage being that among
school children between 6 and 8 years old (88.2%;
P
<0.05).
All students (100%) reported that their toothbrush was
and they carried out three or more daily brushings (56.4%;
P
>0.05), especially after lunch (70.3%). The materials most
frequently cited to clean the teeth were toothpaste (98.0%),
tooth brushes available at the market (93.2%) and dental
loss (26.4%). Of the alternative methods, the sponge was
the only item that showed signiicant association with age
(
P
<0.05).
Table 3 shows that the majority (66.7%) had received an
explanation on how to brush their teeth, with the highest
percentage among students in the group of six to 8 years
(75.3% vs. 55.4%), a difference that reveals the signiicant
association of the variable with age (
P
<0.05 and an OR
interval that excludes the value 1.00). The percentage of
those who had received guidance from the dentist about the
type of brush to use was highest in the group of 6 to 8 years
(50.6%;
P
<0.05). Forty-three percent of students afirmed
that they did not have a speciic condition that caused them
to start brushing.
According to Table 4, the majority of students had attended
the clinic, 71.8% and 73.8% in the age range of 6 to 8 years
and 9 to 12 years, respectively (
P
>0.05). The most frequent
justiication was the need for treatment (57.8%), followed by
toothache (33.0%). The majority (56.0%) considered their
teeth to be in good condition.
Table 2. Assessment of variables related to oral hygiene habits according to age.
Study variables
Age range (in years)
Total group P-value OR (IC – 95.0%) 6 to 8 9 to 12
N % N % N %
• Do you clean your teeth?
Yes 75 88.2 48 73.8 123 82.0 (1) 0.035* **
No - - 2 3.1 2 1.3
Sometimes 10 11.8 15 23.1 25 16.7
TOTAL 85 100.0 65 100.0 150 100.0
• What do you use to clean your teeth?
Brush, purpose-made 77 90.6 61 96.8 138 93.2 (1) 0.190
Brush, homemade 9 10.6 2 3.2 11 7.4 (1) 0.117
Toothpaste 82 96.5 63 100.0 145 98.0 (1) 0.262
Toothpick 17 20.0 18 28.6 35 23.6 (2) 0.225
Dental Floss/tape 18 21.2 21 33.3 39 26.4 (2) 0.097
Juá 9 10.6 6 9.5 15 10.1 (2) 0.832
Sponge 11 12.9 2 3.2 13 8.8 (2) 0.038*
Cloth 11 12.9 6 9.5 17 11.5 (2) 0.519
Liquids to rinse 3 3.5 3 4.8 6 4.1 (1) 0.700
Others - - 1 1.6 1 0.7 (1) 0.426
BASE (3) 85 - 63 - 148
-• Do you have a toothbrush?
Yes 85 100.0 65 100.0 150 100.0 ** **
No - - -
-TOTAL 85 100.0 65 100.0 150 100.0
• If so, the brush used is?
Only yours 71 83.5 59 90.8 130 86.7 (2) 0.196 1.00
Several people 14 16.5 6 9.2 20 13.3 1.94 (0.70 a 5.36)
TOTAL 85 100.0 65 100.0 150 100.0
• How often do you brush your teeth?
Do not brush - - 2 3.2 2 1.4 (1) 0.341 **
Once a day 10 12.8 5 8.1 15 10.7
Twice a day 26 33.3 18 29.0 44 31.4
Three times or more 42 53.9 37 59.7 79 56.4
TOTAL (4) 78 100.0 62 100.0 140 100.0
• When do you clean your teeth?
Upon waking 49 57.6 44 69.8 93 62.8 (2) 0.129
After breakfast 37 43.5 22 34.9 59 39.9 (2) 0.290
After lunch 52 61.2 52 82.5 104 70.3 (2) 0.005*
After dinner 28 32.9 20 31.7 48 32.4 (2) 0.878
Before sleep 43 50.6 28 44.4 71 48.0 (2) 0.459
After snack 6 7.1 4 6.3 10 6.8 (1) 1.000
BASE (3) 85 - 63 - 148
-* Significant difference at 5.0%; -*-* Not determined due to the occurrence frequency of zero or very low.
Table 3. Assessment of knowledge, habits and availability of complementary methods for oral hygiene, according to age.
Study variable
Age range (in years)
Total group
P-value OR (IC - 95.0%) 6 to 8 9 to 12
N % N % N %
• Has a dentist explained to you how to brush your teeth?
Yes 64 75.3 36 55.4 100 66.7 (1) 0.010* 2.45 (1.23 a 4.92)
No 21 24.7 29 44.6 50 33.3 1.00
TOTAL 85 100.0 65 100.0 150 100.0
• Has a dentist explained to you about what type of
toothbrush to use?
Yes 43 50.6 20 30.8 63 42.0 (1) 0.015* 2.30 (1.17 a 4.53)
No 42 49.4 45 69.2 87 58.0 1.00
TOTAL 85 100.0 65 100.0 150 100.0
• In which situations do you take long in brushing?
Before going out 19 22.4 14 21.5 33 22.0 (1) 0.905
When eating sweet and sticky food 10 11.8 10 15.4 20 13.3 (1) 0.518
When you feel dirty mouth/bad breath 18 21.2 12 18.5 30 20.0 (1) 0.680
Other 6 7.1 2 3.1 8 5.3 (2) 0.467
No situation 37 43.5 28 43.1 65 43.3 (1) 0.956
BASE (3) 85 - 65 - 150
-• Do you have toothpaste at home?
Yes 82 97.6 65 100.0 147 98.7 (2) 0.505 **
No 2 2.4 - - 2 1.3
TOTAL 84 100.0 65 100.0 149 100.0
• Do you have dental floss at home?
Yes 34 40.0 33 50.8 67 44.7 (1) 0.189 1.00
No 51 60.0 32 49.2 83 55.3 1.54 (0.81 a 2.97)
TOTAL 85 100.0 65 100.0 150 100.0
• Has a dentist explained how to use the dental floss?
Yes 51 60.7 36 55.4 87 58.4 (1) 0.513 1.24 (0.65 a 2.40)
No 33 39.3 29 44.6 62 41.6 1.00
TOTAL (4) 84 100.0 65 100.0 149 100.0
* Significant difference at 5.0%; ** Not determined due to the occurrence frequency of zero or very low.
(1) Using the Fisher Exact test; (2) Using the chi-square test; (3) When an individual cited more than one alternative, it was recorded only in the basis for the calculation of percentages and not the total; (4) For ten respondents, we did not have this information.
Table 4. Assessment of access to dental services, reasons for consultation and frequency according to age.
(Continue)
Study variable
Age range (in years)
Total group
P-value OR (IC - 95.0%) 6 to 8 9 to 12
n % N % n %
• Have you ever gone to the dentist (post)
yes 61 71.8 48 73.8 109 72.7 (1) 0.777 1.11 (0.54 a 2.30)
no 24 28.2 17 26.2 41 27.3 1.00
TOTAL 85 100.0 65 100.0 150 100.0
• If not, why?
Fear 7 29.2 8 47.1 15 36.6 (2) 0.620 **
Not needed 6 25.0 2 11.8 8 19.5
There is no way to go 5 20.8 4 23.5 9 22.0
Not known 6 25.0 3 17.6 9 22.0
TOTAL 24 100.0 17 100.0 41 100.0
• If so, why are going to the dentist?
Review/control 2 3.3 - - 2 1.8 (2) 0.503
Toothache 20 32.8 16 33.3 36 33.0 (1) 0.952
Dental trauma 2 3.3 - - 2 1.8 (2) 0.503
Bleeding gum/tooth 34 55.7 29 60.4 63 57.8 (1) 0.623
Other 9 14.8 10 20.8 19 17.4 (1) 0.406
-Discussion
Epidemiological surveys on oral health conducted in
Brazil show that people living in rural areas have the worst
indicators of the prevalence, severity and need for dental
treatment (6,7). Rural areas usually have less access to
technology and vocational qualiications (8). However,
despite the expansion of health services, there is an
excessive demand for these services, and their distribution
and accessibility are not homogeneous, which are factors
that increase the inequality (10).
Thus, adequate practices of oral hygiene and regular use
of dental services have great importance in the prevention
of oral diseases (11,12). In general, students had good oral
hygiene habits. Although the form has been validated, the
information was provided by the children themselves so
the results should be interpreted with some caution (13). It
is worth emphasizing the importance of studies on the oral
clinical conditions of children participating in the study for
future correlations with the study variables.
Most said they regularly cleaned their teeth (82%), although
the percentage was higher (88.2%) at the age of 6 to 8 years.
Although this study was conducted in rural areas where the
population is less favored, this situation does not appear to
have inluenced schoolchildren’s habits. This result concurs
with those of another study in which all teenagers in the urban
area of Goiânia city (GO) reported that they always cleaned
their teeth, regardless of socioeconomic status (12).
Among the mechanical and/or chemical methods used to
control bioilm, the use of a toothbrush is the best known.
The brush is used as a strategic resource to remove, or
at least disrupt, the bioilm. It is also important to make
luoride available in the oral cavity. Currently, a large
number of manual and electric toothbrushes are available
commercially, the ideal being one that meets the individual
needs, eficiently cleaning all surfaces of the teeth without
traumatizing the muscles of the cheek and tongue and having
easy access to all mouth areas (11). All the interviewees
reported having a toothbrush and, although the majority
(86.7%) reported individual use, 13.3% reported collective
use. Although common among low-income populations, this
practice may be associated with lack of information and/or
inancial conditions to purchase individual brushes. This
indicates the need for clariication on this issue because
the toothbrush can be an object of transmission of various
infections (15). This situation can be further aggravated in
rural areas where there are generally poor living conditions
and by the low level of maternal education that prevails, as
seen in this study, where most mothers, according to those
interviewed, have incomplete primary education (42%) or
cannot read (29.3%).
No schoolchildren reported using electric toothbrushes,
which despite being used according to individual preference,
are especially suitable for people with disabilities of motor
dexterity, children, disabled and/or hospitalized patients
and those with orthodontic appliances (16). The most-used
Table 4. Assessment of access to dental services, reasons for consultation and frequency according to age.
(Conclusion)
Study variable
Age range (in years)
Total group
P-value OR (IC - 95.0%) 6 to 8 9 to 12
N % N % N %
• When was your last time at the dentist?
Up to 6 months 17 21.5 18 25.7 35 23.5 (2) 0.424 **
7 months to 1 year 1 1.2 2 3.1 3 2.0
From 1 to 2 years 6 7.1 1 1.6 7 4.7
Over 2 years 1 1.2 2 3.1 3 2.0
Do not remember 36 42.4 25 39.1 61 40.9
Never 24 28.2 16 25.0 40 26.8
• How often do you go to the dentist?
Once in 6 months 7 8.2 8 12.5 15 10.1 (2) 0.530 **
Once a year 9 10.6 3 4.7 12 8.1
Every 2 years 1 1.2 - - 1 0.7
Only when is necessary 43 50.6 36 56.3 79 53.0
Never 25 29.4 17 26.6 42 28.2
• In what condition do you think your teeth are?
Very good 15 17.6 9 13.8 24 16.0 (1) 0.732 1.48 (0.42 a 5.23)
Good 49 57.6 35 53.8 84 56.0 1.24 (0.44 a 3.54)
Regular 12 14.1 13 20.0 25 16.7 0.82 (0.24 a 2.82)
Bad 9 10.6 8 12.3 17 11.3 1.00
TOTAL 85 100.0 65 100.0 150 100.0
* Significant difference at 5.0%; ** Not determined due to the occurrence frequency of zero or very low.
resources for performing teeth cleaning were toothpaste
(98.0%), a toothbrush available at the market (93.2%)
and dental loss (26.4%). These results are similar to other
studies (11,15,16) where the percentage of dental loss use
was always lower in relation to the use of toothpaste and
toothbrushes. It was found that the majority (55.3%) of
students did not have dental loss at home, and the lowest
frequency of use was in the group of students from six to
eight years old (21.2%), the age at which children are not
able to use dental loss properly by themselves (17).
The frequency of brushing was relatively high, with results
similar to the average observed by other authors (8,11).
It is noteworthy that although the majority of students
(56.4%) had three or more daily brushings (with the quality
of cleaning being more important than its frequency),
night-time tooth brushing was cited by fewer than half of
respondents (48.0%). This is the most signiicant from the
standpoint of preventing oral diseases (18), mainly because
of decreased salivary low during this period.
With regards to the timing of brushing, the options after lunch
(70.3%) and upon waking (62.8%) were more frequent, with
larger percentage differences observed in ages from nine to
twelve years, corresponding to the following times: after
lunch (82.5%) and upon waking (69.8%). The item “before
going out” had the highest percentage (22%) among the
reasons to brush, followed by “feeling dirty in the mouth or
bad breath” (20%). For teenagers, frequent teeth cleaning is
due to the fact that the brush is associated with good looks,
the feeling of freshness in the mouth and prevention of bad
breath (18). Other studies have shown that oral hygiene
was related to health, especially concerning dental caries
prevention (12,22).
Alternative methods of oral hygiene (nylon or plastic brushes,
environmental solutions and plants used in mouthwash
and/or toothpaste, such as propolis, green tea, rosemary,
peppermint or chamomile tea) are a viable option when it is
impossible to use conventional methods. In addition to having
a lower cost, easy acquisition and consequent collective
range (17,19), they are in accordance with the socio-
economic status of most of the Brazilian population (23).
However, the use of such means among schoolchildren was
low.
The use of “green brush” and “Juá shaving” (18,23) was
only mentioned by 7.4% and 10.1% of schoolchildren,
respectively. The low rate observed may be due to the
high percentage of children who already had conventional
toothbrushes (93.2%) and toothpaste (98%). The juá is
extracted from Juazeiro, a typical tree of the Brazilian
Northeast, which has wide application as a natural product in
the pharmaceutical industry of cosmetics, such as shampoos
and creams, in addition to toothpastes.
Despite dental cleaning representing one of the most
important roles of primary care for the oral health of the
population, it is essential to visit the dentist regularly. The
parameters of healthcare coverage for the Brazilian Uniied
Health System (SUS) are for a consultation every two
years to two dental visits per year starting at six months
of age (1). This was possible for 30.2% of respondents,
although this percentage may be higher because 40.9%
of students did not recall the date of their last visit to the
dentist.
The use of dental services varies with age, being higher among
individuals between 10 and 14 years, women, the richest and
those who reside in urban areas (24). Approximately 15%
of the population has never been to the dentist, and only
33.2% consulted a dentist in the last year, with a gap among
regions and population groups (25). Access dificulty (22%)
and fear (36.6%) were the main factors that have hampered
the demand for care.
Although differences in mouth needs might not be
eliminated just with the use of health facilities, it is
indisputable that access to quality services may improve
population health. However, it is imperative that individuals
understand their oral needs for seeking these services (26).
For 56.6% of students, the self-evaluation of oral health
was satisfactory, data similar to other studies (5). However,
this result goes against the latest survey on oral health,
which revealed that approximately half of Brazilian
adolescents considered their oral health very bad, bad, or
normal (1).
The most frequent justiication for schoolchildren attending
the dental clinic was the need for treatment (57.8%), followed
by toothache (33.0%). Thus, despite the change in oral needs
awareness, students are still far from a preventative vision;
of the 109 who sought care, only 2 (1.8%) were for review
or control, although most had received guidance on how to
take care of teeth.
Conclusions
Most students said they always clean their teeth, have an
individual-use toothbrush and had already been instructed
on brushing by a dentist.
The use of dental services was high, with healing being the
most frequent cause, highlighting little change in public
awareness on the importance of prevention.
References
1. BRASIL. Ministério da Saúde. Secretaria de Atenção a Saúde. Departamento de Atenção Básica. Projeto SB Brasil 2003: condições de saúde bucal da população brasileira 2002-2003: resultados principais. Brasília: Ministério da Saúde; 2004. 51p. 2. Lopes I, Therrien S. Prevalência de gengivite em crianças brasileiras:
estudo acerca do tema. Revista ABO Nac 2008;16:34-8. 3. Santos NCN, Alves TDB, Freitas VS. A saúde bucal de adolescentes:
aspectos de higiene, de cárie dentária e doença periodontal nas cidades de Recife, Pernambuco e Feira de Santana, Bahia. Ciênc Saúde Coletiva 2007;12:1155-66.
4. Saliba NA, Pereira AA, Moimaz SAS, Garbin CAS, Arcieri RM. Programa de educação em saúde bucal: a experiência da Faculdade de Odontologia de Araçatuba - UNESP. Odontol Clín.-Científ 2003;2:197-200.
5. Cardoso L, Rosing C, Kramer P, Costa CC, Costa Filho LC. Polarização da cárie em município sem água fluoretada. Cad Saúde Pública 2003;19:237-43.
6. Abreu MHNG, Pordeus IA, Modena CM. Cárie dentária entre escolares do meio rural de Itaúna (MG), Brasil. Rev Panam Salud Pública 2004;16:334-44.
7. Mello TRC, Antunes JLF. Prevalência de cárie dentária em escolares da região rural de Itapetininga, São Paulo, Brasil. Cad Saúde Pública 2004;20:829-35.
8. Lisboa IC, Abegg C. Hábitos de higiene bucal e uso de serviços odontológicos por adolescentes e adultos do município de Canoas, Estado do Rio Grande do Sul, Brasil. Epidemiol Serv Saúde 2006;15:29-39.
9. Frankfort-Nachimias C, Nachimias D. Research methods in the social sciences. 4th ed. London: Edward Arnold; 1992.
10. Mello TRC, Antunes JLF, Waldman EA. Áreas rurais: pólos de con- centração de agravos à saúde bucal? Arq Med 2005;19:67-74. 11. Menezes VA, Leal RB, Manzi CTA. Placa Dental Organizado por
Maria Bernadete Cavalcanti Barbosa. In: Barbosa MBC, Bruno GB, Souza EHA. Saúde Bucal no Programa Saúde da Família. Juazeiro do Norte: Faculdade de Medicina do Juazeiro do Norte; 2004. p. 95-110.
12. Freire MCM, Sheiham A, Bino YA. Hábitos de higiene bucal e fatores sociodemográficos em adolescentes. Rev Bras Epidemiol 2007;10:606-14.
13. Mello TRC. Diferenciais de saúde em áreas urbanas e rurais: cárie dentária e condições gengivais em escolares no Estado de São Paulo [thesis]. São Paulo (SP): Faculdade de Saúde Pública da Universidade de São Paulo; 2006.
14. Moura C, Cavalcanti AL. Maloclusões, cárie dentária e percepções de estética e função mastigatória: um estudo de associação. Rev Odonto Ciênc 2007;22:256-62.
15. Pace MA, Grigolletto JC, Bertoldi RC, Polachini MGCW, Bregagnolo JC. Hábitos de higiene oral de famílias cadastradas em Programa de Saúde da Família de Ribeirão Preto: SP. Cad Saúde Colet 2006;14:49-62.
16. Abreu MHNG, Paixão HH, Resende VLS. Controle de placa bacteriana em portadores de deficiências físicas: avaliação de pais e responsáveis. Arq Cent Estud Curso Odontol Univ Fed Minas Gerais 1999;35:27-37.
17. Abegg C. Hábitos de higiene bucal de adultos porto-alegrenses. Rev Saúde Pública 1997;31:586-93.
18. Alves DM, Santos AA, Santos TJ, Bomfim AM, Calado AA. Avaliação da eficácia de uma escova e fitas dentais alternativas utilizadas na higienização bucal em escolares da rede pública. Odontol Clín-Cient 2003;2:191-6.
19. Rank RCIC, Rank MS, Did JE. Dificuldades maternas quanto ao uso do fio dental em crianças. Publ. UEPG 2006;12:31-8.
20. Barros OB, Pernambucano RA, Tomita NE. Escovas dentais. PGR: Pós-Grad Rev Fac Odontol Säo José dos Campos 2001; 4:32-7.
21. Sheiham A. Abordagens de Saúde Pública para promover saúde periodontal. In: Bönecker M, Sheiham A, Duarte DA, Suga SS, Sant’Anna G, Rodriges CS, et al. Promovendo saúde bucal na infância e adolescência: conhecimentos e práticas. São Paulo: Santos; 2004.
22. Silva TA, Paixão HH, Pordeus IA. Fatores do comportamento relacionados à higiene bucal em adolescentes. Arq Cent Estud Curso Odontol 1997;33:5-14.
23. Simões D, Guedes-Pinto A, Duarte D. Utilização do pó de juá como método alternativo na redução do índice de placa bacte- riana na escovação dentária. Rev Odontopediatr 1995;4: 147-53.
24. Pinheiro RS, Aguiar FP, Sass PE, Vilela MJN. Diferença no uso de serviços odontológicos entre os Estados do Brasil: uma análise baseada em modelos hierárquicos. Cad Saúde Coletiva 2006;14:141-8.
25. Pinheiro RS, Viacava F, Travassos C, Brito AS. Gênero, morbidade, acesso e utilização de serviços de saúde no Brasil. Ciênc Saúde Coletiva 2002;7:687-707.