Robust CPD Algorithm for Non-Rigid Point
Set Registration Based on Structure
Information
Lei Peng1,2*, Guangyao Li1, Mang Xiao1, Li Xie1
1College of Electronics and Information Engineering, Tongji University, Shanghai, China,2College of Information Engineering, Taishan Medical University, Taian, Shandong, China
Abstract
Recently, the Coherent Point Drift (CPD) algorithm has become a very popular and efficient method for point set registration. However, this method does not take into consideration the neighborhood structure information of points to find the correspondence and requires a manual assignment of the outlier ratio. Therefore, CPD is not robust for large degrees of degradation. In this paper, an improved method is proposed to overcome the two limitations of CPD. A structure descriptor, such as shape context, is used to perform the auxiliary cal-culation of the correspondence, and the proportion of each GMM component is adjusted by the similarity. The outlier ratio is formulated in the EM framework so that it can be automati-cally calculated and optimized iteratively. The experimental results on both synthetic data and real data demonstrate that the proposed method described here is more robust to deformation, noise, occlusion, and outliers than CPD and other state-of-the-art algorithms.
Introduction
Point set registration is one of the main methods for image registration. As a fundamental component of the computer vision field, point set registration is often used in medical image processing [1–3], pattern recognition [4], and remote sensing image processing [5,6]. Gener-ally, point set registration is divided into either rigid or non-rigid registration. Rigid registra-tion is a relatively simple process that mainly processes the scaling, translaregistra-tion, and rotaregistra-tion of the point sets. Generalized rigid registration includes affine and projection transformation. However, for non-rigid registration, the transformation form is non-rigid, and it is difficult to accurately determine the transformation model, especially if there is a large degree of degrada-tion, such as deformadegrada-tion, occlusion, noise, or outliers.
Non-rigid point set registration is faced with two problems: one is finding the correspon-dence between two point sets, and the other is choosing the right transformation model. If one of these problems is solved, then the other can be solved easily. However, the issue is that both of the problems are often unknown and must be solved simultaneously. Therefore, most
OPEN ACCESS
Citation:Peng L, Li G, Xiao M, Xie L (2016) Robust CPD Algorithm for Non-Rigid Point Set Registration Based on Structure Information. PLoS ONE 11(2): e0148483. doi:10.1371/journal.pone.0148483
Editor:Pew-Thian Yap, University of North Carolina, UNITED STATES
Received:September 4, 2015
Accepted:January 19, 2016
Published:February 11, 2016
Copyright:© 2016 Peng et al. This is an open access article distributed under the terms of the Creative Commons Attribution License, which permits unrestricted use, distribution, and reproduction in any medium, provided the original author and source are credited.
Data Availability Statement:The synthetic data are available from the websitehttp://www.umiacs.umd. edu/*zhengyf/PointMatchDemo/, and the real data are available from the websitehttp://radiology.dxy.cn.
Funding:This work was supported by Shandong Provincial Natural Science Foundation, China, grant number ZR2015FL005 (http://www.sdnsf.gov.cn/ portal/, recipient: Lei Peng). The funders had no role in study design, data collection and analysis, decision to publish, or preparation of the manuscript.
algorithms use the iterative method of alternate calculations of correspondence and transfor-mation to obtain an approximately optimal solution.
The iterative closest point (ICP) algorithm [7], which is one of the most famous point set registration algorithms, is mainly used for the registration of free curves and surfaces. The ICP algorithm assumes the closest points to be in correspondence and minimizes the mean square distance iteratively until the objective function converges. Instead of assigning a binary corre-spondence, soft assignment and relaxation labeling have been proposed for fuzzy correspon-dences. One of the most well-known contributions for these work is a non-rigid point
matching generic framework proposed by Chui et al. [8]. Under this framework, the TPS-RPM algorithm uses a thin plate spline as non-rigid mapping as well as uses soft allocation and deter-ministic annealing to solve the combined optimization problem. The probabilistic methods [9–
13] are typically used to solve the problem of point set registration. Myronenko et al. [9,14] proposed the Coherent Point Drift (CPD) algorithm and treated the alignment of the two point sets as a probability density estimation problem. Furthermore, restrained by the motion coherence theory, the Gaussian Mixture Model (GMM) centroids fit to the data points via the EM algorithm. Many improvements to CPD have been proposed that involve altering some phases of this algorithm [15–20]. Jian et al. [10] used two GMMs to represent the point sets, and the differences of the two GMMs are minimized to solve the problem of point set registra-tion. Moreover, there are some additional algorithms [21–25] that use other kinds of mixture model for point set registration. However, these methods mainly use the global relationships to find the correspondence and hardly consider the structure information.
To make full use of the neighborhood structure information of the point sets, Belongie et al. [4] introduced the Shape Context (SC) to measure the similarity between two shapes, and the corresponding points with a similar shape will have a similar SC. Furthermore, SC is used in shape matching and object recognition. Zheng et al. [26] introduced the concept of neighbor-hood structure and proposed a robust non-rigid point matching algorithm by keeping the neighborhood structure. They used the SC distance to find the initial correspondence, followed by a relaxation labeling technique to search for the optimal solution. Ma et al. [27] and Chen et al. [28] used the descriptor of SC to first establish the rough correspondence and then used the robust L2E estimator to estimate the transformation. In addition, different structure descriptor [29–34] of the point sets are used for point set registration. Although these algo-rithms use the structure information as the similarity measurement, they find the correspon-dence and the transformation separately. In this paper, we propose a GMM based method and use neighborhood structure information combining global distance to determine the corre-spondence, jointly, refine the transformation in the EM process.
As a rapid method that can be used in high dimensional point set registration, the CPD algorithm is relatively advantageous. However, the method is limited in the following two main aspects. (1) Only the distance is considered at the step of computing similarity, not the neigh-borhood structure of points, and each GMM component has an equal contribution to the dis-tribution of data points without making full use of the similarity, resulting in sensitivity to noise, occlusion and outliers. (2) The outlier ratio must be manually assigned, but the exact value of the outlier ratio is often impossible to determine before registration. In addition, CPD uses an improper uniform distribution to model noise and outliers so that even if the real out-lier ratio is set, it still cannot guarantee a good result.
the registration process is more accurate and robust. (2) The automatic estimation of the out-lier ratio is integrated into the EM framework so that the product of the outout-lier ratio and the uniform distribution can“capture”noise and outliers properly. This process allows us to implement this method without manually selecting the real outlier ratio, thus improving its practicability.
The rest of this paper is organized as follows: Section 2 reviews the CPD algorithm, followed by our proposed method to improve CPD with detailed description of the two aspects of the structure descriptor and the processing outliers in the EM framework. Section 3 gives the experimental results and performance evaluation on synthetic data and real data. Finally, the discussion and conclusion are presented in section 4.
Methods
1. Review of the Coherent Point Drift algorithm
1.1 Coherent Point Drift algorithm. The CPD algorithm considers the alignment of two point sets as a probability density estimation problem. One point set represents the GMM cen-troids, and the other point set represents the data points. At the optimum, the correspondence of the two point sets is obtained by maximizing the posterior probability. The core of CPD is to force the GMM centroids to move coherently as a group to preserve the topological structure of the point sets.
Given two point setsXandY. The points in the“model”setY= {ym|1, 2,. . .,M} are
consid-ered GMM centroids. The points in the“scene”setX= {xn|1, 2,. . .,N} are considered data points generated by the GMM. The purpose is to learn a transformationTapplied toYfor
X=T(Y,θ), in whichθis a set of the transformation parameters. The probability density
func-tion of the GMM can be written as follows:
pðxÞ ¼X Mþ1
m¼1
PðmÞpðxjmÞ ð1Þ
wherepðxjmÞ ¼ 1
ð2ps2ÞD=2exp
kx Tðym;yÞk2
2s2
,m= 1, 2,. . .,M. To handle the outliers, occlusion,
and noise, a uniform distribution is used:p(x|M+1) = 1/N. The weight of the uniform distribu-tion, which represents the outlier ratio, is denoted asω, 0ω1. In addition, an equal
isotro-pic covarianceσ2and equal membership probabilitiesP(m) = (1−ω)/Mare used for all GMM
components. Thus, the probability density function takes the following form:
pðxÞ ¼o1
Nþ ð1 oÞ
1
M XM
m¼1
pðxjmÞ ð2Þ
The centroid of the GMM is parameterized by the set of parametersθ. The parameters will
be estimated by maximizing the likelihood, which minimizes the negative log-likelihood func-tion:
Eðy;s2
Þ ¼ X
N
n¼1
logX
Mþ1
m¼1
PðmÞpðxnjmÞ ð3Þ
According to Jensen’s inequality, an upper bound of the negative log-likelihood function in
Eq (3)is the function ofQinEq (4), which is the objective function of CPD.
Q¼ X N
n¼1
XMþ
1
m¼1
Poldðmjx
Assuming that each Gaussian component is independent, the correspondence probability between two points,ymandxn, is defined as the posterior probability of the GMM centroid given the data point:P(m|xn) =P(m)p(xn|m)/p(xn). Next, the EM framework is used to solve the optimal estimate ofθandσ2. The CPD algorithm iteratively computes the posterior
proba-bility distributionPold(m|xn) of mixture components by the Bayes’theorem in E-step and determines the new parameter values by minimizing the expectation of the complete negative log-likelihood function in M-step until convergence. The registration process of CPD algo-rithm is given as follows.
Initialization:ω,θ, andσ2are initialized.
E-step: First, the old values of the parameters are guessed, and then the posterior probability distributionPold(m|xn) of the mixture components is calculated:
Poldðmjx nÞ ¼
exp kxn Tðym;yÞk 2
2s2
PM k¼1exp
kxn Tðyk;yÞk 2
2s2
þoMð2ps 2
ÞD=2 ð1 oÞN
; ðm¼1;2; :::;MÞ ð5Þ
M-step: The new parametersθandσ2are computed by minimizing the expectation of the
complete negative log-likelihood functionQ.
Qðy;s2 Þ ¼ 1
2s2
XN
n¼1
XM
m¼1
Poldðmjx
nÞkxn Tðym;yÞ k 2
þDNP 2 logs
2
ð6Þ
whereNP¼
PN n¼1
PM m¼1P
oldðmjx nÞ.
The algorithm iterates E-step and M-step untilQconverges. Next, the aligned point set is
T(Y,θ).
1.2 The limitations of CPD. From the discussion above, we can see that the outlier ratioω
and the Gaussian membership probabilitiesP(m) play significant roles in determining the distribution (one of the GMM components or the uniform distribution) of the data points. However, these parameters are fixed in CPD, so there are two problems that influence its per-formance severely. The first problem is that the similarity measure only depends on the Euclid-ean distance between points. In the case of a large degree of degradation, such as deformation, noise, occlusion, or outliers, the closest point pairs may not be in correspondence, whereas the point pairs that have the similar neighbor structures are probably in correspondence. There-fore, the contribution of each Gaussian component to the GMM is not the same. The neighbor-hood structure similarity of the point pairs should be introduced into the proportion of the GMM components.
The other problem existing in CPD is the outlier ratioω, which requires manual assignment
during initialization. This requirement also limits the application of CPD. It is difficult to deter-mine the outlier ratio of the two point sets before registration. An improper value ofωleads to
an unpredictable registration result. Meanwhile, CPD uses a uniform distribution 1/Nto treat noise and outliers. The uniform distribution should be related to the coordinate range of the data points rather than the number of data pointsN. For example, given two data sets with the same number of points, the point’s distribution range of one data set is larger than the other. Thus, the uniform distribution of the two data sets should not be equal. As a result, even if the real outlier ratio is assigned, a good result is still not guaranteed. Only by slight adjustment of
ωto make the product ofωand 1/Nmodel the noise and outliers appropriately. Therefore, in
2. The method of improvement
The paper proposes a method to overcome the two limitations of CPD stated above. As previ-ously mentioned, the CPD algorithm does not take into account the structure information of the points. Generally, two corresponding points also have a similar neighborhood structure, which allows us to compute the similarity and find the correspondence according to the neigh-borhood structure information. Because the contribution of each Gaussian component is not the same, the proportion of each GMM component is adjusted by the similarity. In addition, because the outlier ratio must be manually assigned in CPD, we formulate it in the EM frame-work so that it can be automatically calculated and optimized iteratively.
2.1 Structure descriptor. In this paper, shape context [4] is used as a structure descriptor. The shape context at a point is the measurement of the distribution of other points relative to it. This point is treated as the origin of the log-polar coordinate, and the direction from this point to the mass center of the shape is used as the positive x-axis. Thus, the shape context has translation, scale, and rotation invariant characteristics. In considering two points,xnis in one set andymis in another set; their shape contents arehn(k) andhm(k), respectively, whereh(k) is the value of k-bin for the log-polar histogram,k= 1, 2,. . .,K. LetC
nmrepresent the matching cost measure of these two points.
Cnm¼exp 1
2g
XK
k¼1
½hnðkÞ hmðkÞ 2
hnðkÞ þhmðkÞ
!
; ðg¼0:1in defaultÞ ð7Þ
The more similar the shape contexts for the two points ofxnandymare, the more likely it is that the correspondence and the membership probabilityPn(m) are higher. Thus, the member-ship probabilities are improved asPn(m) = (1−ω)Cnm/S, whereS¼
PM
k¼1Cnkand the
proba-bility density function of GMM is rewritten as
pðxnÞ ¼o 1
Nþ ð1 oÞ
1
S XM
m¼1
CnmpðxnjmÞ ð8Þ
After introducing the structure descriptor to the registration process, at the first several times of iterations, the similarity measure based on structure descriptor increases the speed of finding the correct correspondences. However, at the later stage of the iterations, most of the correspondences are found. Thus, for the similarity measure, the effect of structure descriptor is reduced, and the effect of Euclidean distance is increased.
2.2 Outliers processing and the EM solution. In the CPD algorithm, the outlier ratioω
must be manually assigned. However, it is difficult to determine the real outlier ratio in advance. If an incorrectωvalue is assigned, then the performance of the registration will be
reduced. Here, an automatically calculated outlier ratio is considered as well as an iterative pro-cess of the EM algorithm.
The non-rigid point set registration method proposed in this paper uses the Tikhonov regu-larization framework. The transformation is defined as the initial position plus a displacement functionv:T(Y,v) =Y+v(Y). In the Reproducing Kernel Hilbert Space (RKHS), the regulariza-tion term is defined asλkLvk2/2. As the objective function of our method, by ignoring the con-stants, the negative log likelihood functionEq (6)can be written as
Qðv;o;s2
Þ ¼ 1
2s2
XN
n¼1
XM
m¼1
Poldðmjx
nÞkxn ym vðymÞ k 2
þDNP 2 logs
2
NPlogð1 oÞ ðN NPÞlogoþ
l
2kLvk 2
where the set of unknown parameters is {v,ω,σ2}. The integrated stages for solving the
parame-ters by the EM algorithm are given as follows.
E-step: The posterior probabilityPold(m|xn) can be calculated by applying Bayes rule:
Poldðmjx nÞ ¼
Cnmexp
kxn ym vðymÞk 2
2s2
PM k¼1Cnkexp
kxn yk vðykÞk 2
2s2
þoSð2ps 2
ÞD=2 ð1 oÞN
; ðm¼1;2; :::;MÞ ð10Þ
DenoteP= (Pmn)M×N, wherePmn=Pold(m|xn) is a soft decision, which indicates what degree pointymcorresponds to pointxn. The probability of noise and outliers can be computed as fol-lows:
PoldðMþ1jx nÞ ¼1
XM
m¼1
Poldðmjx
nÞ ð11Þ
M-step: The new parametersv,ω, andσ2can be calculated by minimizing the objective
functionQ.σ2is updated as follows:
s2
¼ 1
DNP
XN
n¼1
XM
m¼1
PðmjxnÞkxn ym vðymÞ k 2
ð12Þ
Next, the functionQ(v,ω,σ2) is minimized with respect to the outlier ratio to obtain the
value ofω.
o¼1 1
N XN
n¼1
XM
m¼1
PðmjxnÞ ð13Þ
which equalso¼1 N
PN
n¼1PðMþ1jxnÞ. However, when usingEq (13)to updateωdirectly, it is
problematic if the outlier ratio is large because over-fitting will occur. Therefore, to avoid this problem, the outlier ratio can be updated by using the following function:
o¼ooldþaðonew ooldÞ; a¼1
t in default
ð14Þ
whereωoldis the old value ofω, which is updated at the last iteration.ωnewis calculated byEq
(13).αis the learning ratio, which is similar to the annealing rate in the simulated annealing algorithm; it is an empirical parameter to avoid over-learning. In this paper, the learning ratio is set asα= 1/t, wheretis the current iteration time. The learning ratio is larger at the begin-ning and then gradually become smaller so thatωcan update more rapidly at the initial
itera-tions to achieve rapid optimization and update slower at the later iteraitera-tions to prevent over-fitting. Thus, the outlier ratio can be efficiently updated, combined with the learning rate, dur-ing the EM iteration by Eqs(13)and(14).
The functional form ofv, which must be solved by calculus of variation, must satisfy the Euler-Lagrange differential equation. By solving the differential equation, the displacement func-tionvcan be obtained. Here, a Gaussian matrix kernel is used to define the hypothesis spaceH.
½Gþls2
diagðP1Þ 1W¼diagðP1Þ 1PX Y ð15Þ
The algorithm iterates E-step and M-step untilQconverges. Next, the transformed positions ofymare determined byT(Y,W) =Y+GW, and the probability of correspondence is given byP.
In the expressionT(Y,v) =Y+ (Y),Yis a constant, andv(Y) is a regularization; both are dif-ferentiable so that the sum of them is still difdif-ferentiable. However, the partial differential equa-tionv(Y), which must be solved by calculus of variation, may obtain an infinite number of solutions under different boundary conditions. Therefore, the transformationTis not revers-ible and is not diffeomorphic.
Results
The performance of our proposed method is tested with both synthetic data and real data. All experiments are performed by MATLAB R2013a on a PC with 16 GB of RAM and an i7-4770K (3.5 GHz) Inter CPU. In this section, the goal of the point set registration is to align the model point set onto the scene point set, where the model point set is presented by blue pluses and the scene point set is red circles.
1. Evaluation criterions
The registration error of two point sets is quantified as the average Euclidean distance between a point in the model set and the ground truth corresponding point in the scene set. Root Mean Square Error (RMSE) is used to measure the registration error.
Errorp¼
ffiffiffiffiffiffiffiffiffiffiffiffiffiffiffiffiffiffiffiffiffiffiffiffiffiffiffiffiffi
1
J XJ
j¼1
ðxj yjÞ 2
v u u
t ð16Þ
whereJis the total number of the ground truth correspondences, andyjis the true correspond-ing point toxj.
The registration error of two images is defined as RMSE, which reflects the difference of intensity distribution of the two images.
Errori¼
ffiffiffiffiffiffiffiffiffiffiffiffiffiffiffiffiffiffiffiffiffiffiffiffiffiffiffiffiffiffiffiffiffiffiffiffiffiffiffiffiffiffiffiffiffiffiffiffiffiffiffiffiffiffiffiffiffiffiffiffiffiffiffiffiffiffiffiffi
1
UV XU
u¼1
XV
v¼1
½Mðu;vÞ Fðu;vÞ2
s
ð17Þ
whereU×Vis the total number of the pixels in each image,M(u,v) andF(u,v) are the intensity values of the pixels located in (u,v) of the two respective images.
Recall, precision, andF1measure are well known parameters in statistics and pattern recog-nition. The recall is defined as the proportion of true-positive correspondences to the ground truth correspondences. The recall-accuracy curve, as used in [10,25], denotes the ability of a registration method to determine as many true-positive correspondences as possible with low errors in accuracy. TheF1measure is used to evaluate the balance between recall and precision.
Recall¼ TP
TPþFN ð18Þ
Precision¼ TP
TPþFP ð19Þ
F1 ¼
2PrecisionRecall
PrecisionþRecall ¼
2TP
2TPþFPþFN ð20Þ
2. Experiments on synthetic data
The same data as in [8,26,27], named Chui-Rangarajan synthesized data, were used, and the shape of the fish and the Chinese character were selected. Four models of data designed to mea-sure the robustness of registration algorithms under deformation, noise, occlusion, and outliers were chosen. Each model contains 5 different degradation levels, and each level includes 100 examples. In the rest of this section, the experimental results of our algorithm are shown, and the performance is analyzed from two aspects: the“structure descriptor based vs. constant memberships”and the“automatic outlier ratio vs. fixed one”.
2.1 Results on synthetic data. For the purpose of evaluating the performance of the pro-posed method, the results of our method are compared with four state-of-the-art algorithms: GMMREG [10], TPS-RPM [8], RPM-L2E [27], and CPD [9]. The TPS-RPM algorithm uses soft assignment to find the correspondence under the deterministic annealing scheme, and the GMMREG algorithm uses the L2distance between two GMMs to measure similarity. Both of the two algorithms do not leverage the neighborhood structure information of points as well as the CPD algorithm. The RPM-L2E algorithm depends on only the shape context to find the correspondence and optimize it in the iteration. However, our method uses the structure descriptor combined with the Euclidean distance to find correspondence in an EM framework. Therefore, those four algorithms are selected to compare with our method.
In each experiment, both the CPD algorithm and our method have the maximum iteration number set at 100, and the same initial values of the outlier ratio are assigned, as shown in
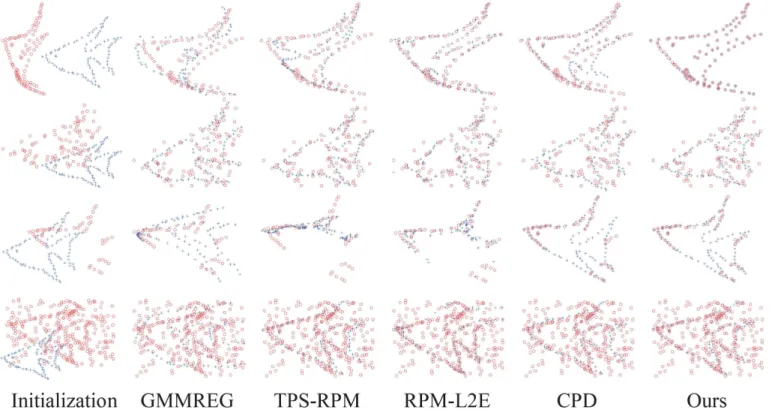
Table 1. The registration examples are shown inFig 1(the fish shape) andFig 2(the Chinese character shape). In the two figures, from top to bottom, there are the four groups under the largest degradation levels of deformation (degree 0.08), noise (level 0.05), occlusion (ratio 0.5), and outlier (outlier-to-data ratio 2.0).
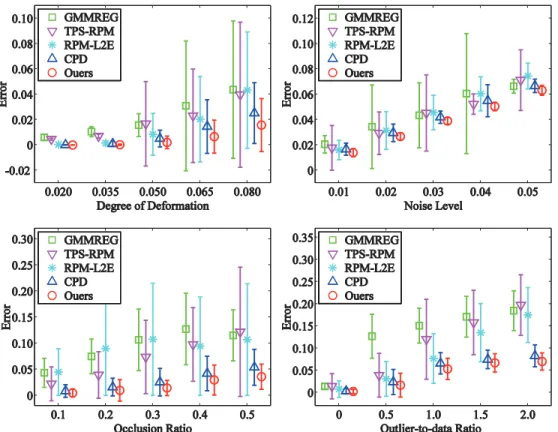
The performance statistics for deformation, noise, occlusion, and outliers are summarized inFig 3(the fish shape) andFig 4(the Chinese character shape). Each algorithm is compared by the error mean and the standard deviation of the registration error of all 100 examples in each distortion degree. From the experimental and statistical results, we can see that our method is much more robust compared with the other four algorithms and generally give bet-ter performance, especially as the degradation degree increases.
2.2 Evaluation of the structure descriptor. To evaluate the effect of structure descriptor, the automatic outlier function is closed in the source code of our method and 100 trials of the
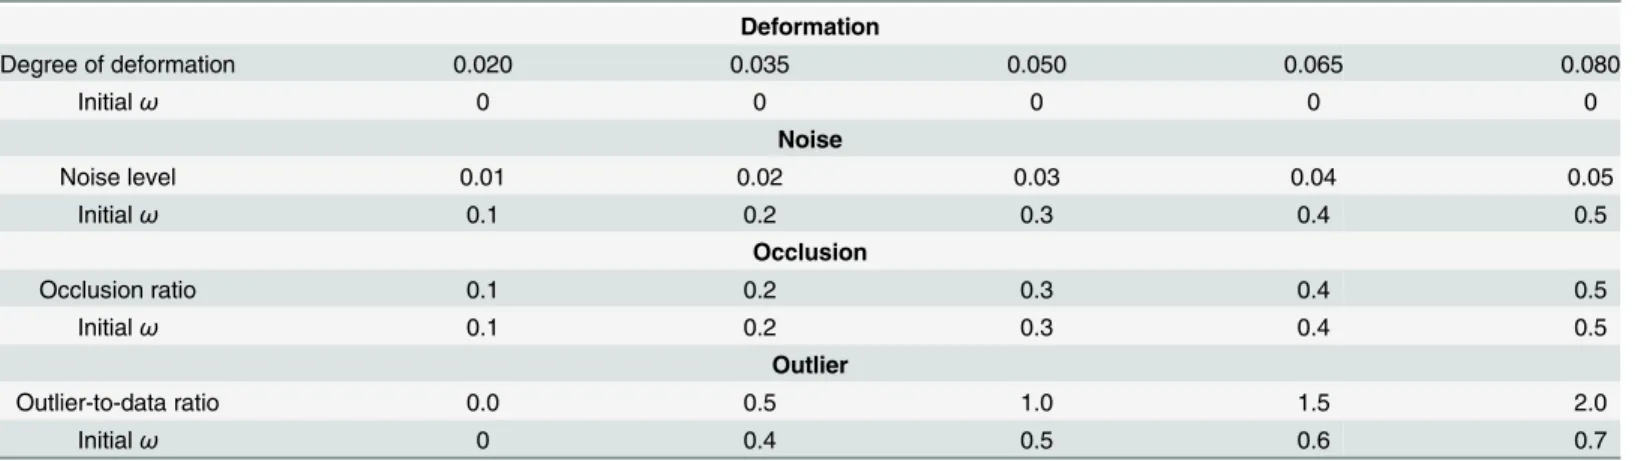
Table 1. Initial values of outlier ratio.
Deformation
Degree of deformation 0.020 0.035 0.050 0.065 0.080
Initialω 0 0 0 0 0
Noise
Noise level 0.01 0.02 0.03 0.04 0.05
Initialω 0.1 0.2 0.3 0.4 0.5
Occlusion
Occlusion ratio 0.1 0.2 0.3 0.4 0.5
Initialω 0.1 0.2 0.3 0.4 0.5
Outlier
Outlier-to-data ratio 0.0 0.5 1.0 1.5 2.0
Initialω 0 0.4 0.5 0.6 0.7
Both CPD and our method are set the same initial values ofωin each experiment
Fig 1. Registration examples on the fish point set.From top to bottom are the four largest degradations: deformation (0.08), noise (0.05), occlusion (0.5), and outlier (2.0). The goal is to align the model point set (blue pluses) onto the scene point set (red circles).
doi:10.1371/journal.pone.0148483.g001
Fig 2. Registration examples on the Chinese character point set.From top to bottom are the four largest degradations: deformation (0.08), noise (0.05), occlusion (0.5), and outlier (2.0). The model point set is shown in blue pluses, and the scene point set is shown in red circles.
fish point set under the outlier degradation (outlier-to-data ratio of 1.0) are chosen. Both CPD and our method are set the same initial values:ωis 0.7 and the maximum iteration number is
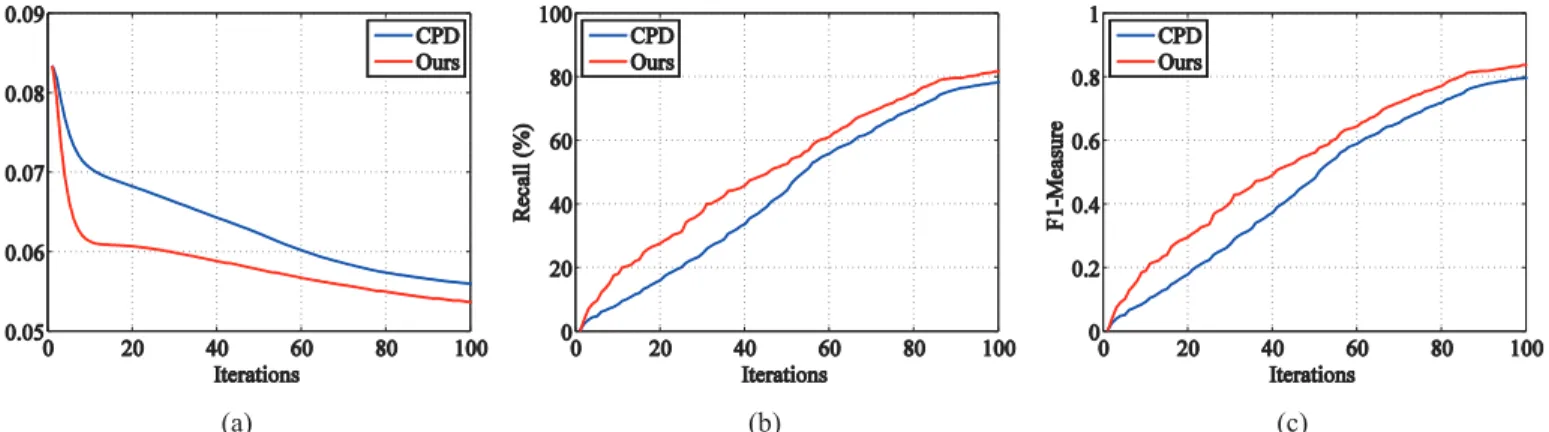
100. The error curves, the recall curves, and theF1measure of the two algorithms during the iteration are shown inFig 5. Here, the recall is defined as the proportion of the true-positive correspondences that are found at current iteration to the ground truth correspondences. As shown in the figure, due to the introduction of structure descriptor, at the first 20 times of the iterations, our method can find the correct correspondences rapidly and maintain smaller errors. At the later stage of the iterations, the effect of the structure descriptor is reduced and the effect of Euclidean distance is increased; as a result, the curves of the two algorithms tend to be similar.
However, the introduction of structure descriptor increases the complexity of the calcula-tions. The average registration times of each example on the synthetic dataset are GMMREG: 0.24 s, TPS-RPM: 0.03 s, RPM-L2E: 6.52 s, CPD: 0.15 s, and our method: 1.21 s. The RPM-L2E algorithm and our method (which used shape context) exhibit poor speed performance.
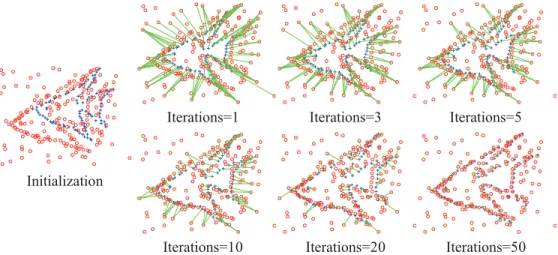
2.3 Evaluation of the automatic outlier processing. In this subsection, the automatic out-lier processing is evaluated in the EM framework. First, consider one example with 98 points in the model point set and 196 points in the scene point set to demonstrate the distribution of the outliers of our method during the iteration. The initial value of the outlier ratio is 0.7, and the maximum iteration number is 100. As shown inFig 6, the leftmost figure is the initial point sets. The right six figures are the correspondence and the distribution of the outliers at the iter-ations of 1, 3, 5, 10, 20 and 50 times. The corresponding point pairs are connected by green
Fig 3. Performances of the registration methods on the fish point set.The registration performance of our method compared with the performances of GMMREG, TPS-RPM, RPM-L2E, and CPD on the fish point set. Each error bar indicates the registration error mean and the standard deviation over 100 trials.
lines. The many-to-one correspondence can be seen directly. There may be one Gaussian cen-troid closest to multiple date points and another Gaussian cencen-troid that is not the closest to any data point. In other words, each point in the model point set has a closest point in the scene point set. However, some points in the scene point set cannot find the corresponding
Fig 4. Performances of the registration methods on the Chinese character point set.The registration performances of GMMREG, TPS-RPM, RPM-L2E, CPD, and our method on the Chinese character point set. Each error bar indicates the registration error mean and the standard deviation over 100 trials.
doi:10.1371/journal.pone.0148483.g004
Fig 5. Evaluation of the effect of structure descriptor in the iteration.One hundred trials of the fish point set under the outlier degradation (outlier-to-data ratio 1.0) are chosen to test the effect of structure descriptor in the iteration: (a) error curves, (b) recall curves, and (c)F1measure scores in the iteration. Our
method is compared with CPD, both of which have the same initial value:ωis 0.7 and the maximum iteration number is 100.
point to them; such points are so-called outliers. Whether a point is an outlier or not will change during the iteration of the EM framework. At the same time, we can see the change of the correspondence and the distribution of the outliers rapidly at the initial iterations, which then gradually slow and stabilize.
The statistical figure of outlier ratio change in the iteration is shown inFig 7. The learning ratio is set asα= 1/t, and the outlier ratios are, respectively, initialized as 0.1, 0.3, 0.5, 0.7, and 0.9. In each of the five experiments, the value of the outlier ratio converges to nearly 0.7 after iterating 100 times. On one hand, if the learning ratio is too small, then the outlier ratio does not converge to the optimal value at the end of iteration. On the other hand, if the learning ratio is too large, then the outlier ratio may converge to a local optimal solution.
Fig 6. The change of the correspondence and the outliers in the iteration.The leftmost figure is the initial point sets with 98 points in the model point set (blue pluses) and 196 points in the scene point set (red circles). The right six figures are the correspondence and the distribution of the outliers in the iterations of 1, 3, 5, 10, 20 and 50 times of our method. The corresponding point pairs are connected by green lines, and the other points are the outliers.
doi:10.1371/journal.pone.0148483.g006
Fig 7. The statistics of the outlier ratio change in the iteration.The same point sets are assigned the different initial values ofω(0.1, 0.3, 0.5, 0.7, and 0.9). The outlier ratios converge to the optimal value
iteratively.
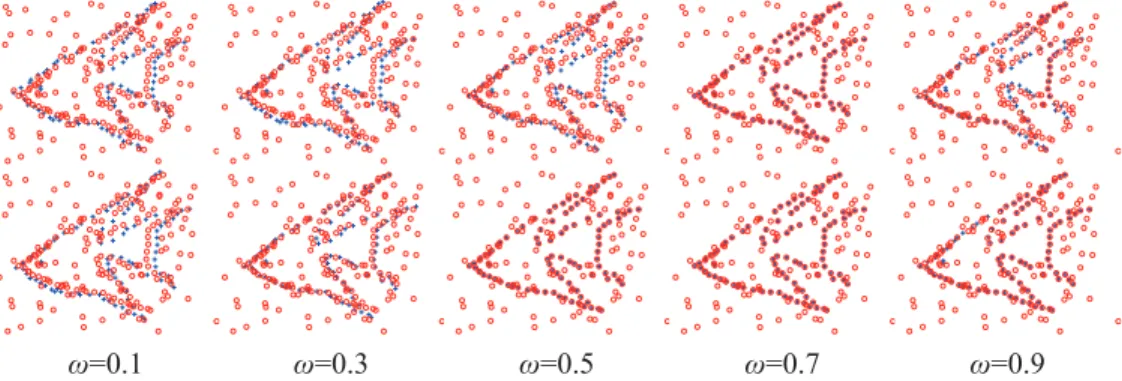
Furthermore, to evaluate the automatic outlier ratio of our method vs. the fixed one of the CPD algorithm, we assign different initial outlier ratios (0.1, 0.3, 0.5, 0.7, and 0.9) to the same example (the initial state is shown inFig 6) and run the CPD algorithm together with our method. The registration results are shown inFig 8. Next, two groups of the fish point set under the outlier degradation (outlier-to-data ratios of 0.5 and 2.0) are chosen to compare the influence of different initial outlier ratios on the registration results of CPD and our method. Both methods are assigned different initial outlier ratios from 0 to 0.9. The error means and the standard deviations of the registration error of 100 examples in each group are shown inFig 9.
3. Experiments on real data
In this subsection, some real examples are presented on several biomedical datasets obtained fromhttp://radiology.dxy.cn. The sizes of the original images are 240×180 pixels. The point sets are created by the edges of the objects, which are extracted using a regional scanning
Fig 8. Registration examples with different initial outlier ratios.The same point sets are assigned different initial outlier ratios (0.1, 0.3, 0.5, 0.7, and 0.9). The top is the registration results of the CPD algorithm, and the bottom is our method.
doi:10.1371/journal.pone.0148483.g008
Fig 9. Performances of the registration methods for different initial outlier ratios.Two groups examples with outlier-to-data ratios of 0.5 (a) and 2.0 (b) are chosen to test the influence of different initial outlier ratios (from 0 to 0.9) on the registration results. The error means and the standard deviations of 100 examples in each group of our method are compared with CPD.
method. We demonstrate the registration results of all the experiments with the initial outlier ratio of 0.7 and the maximum iteration number of 100.
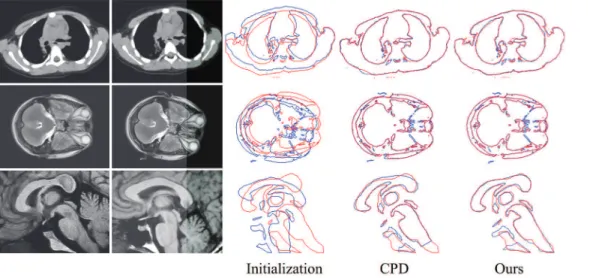
Three groups of the real data examples are shown inFig 10. The top row is a pair of thorax Computed Tomography (CT) images. The middle row is a pair of transverse plane from brain Magnetic Resonance Imaging (MRI) data. The bottom row is the sagittal plane from brain MRI data, from which the boundaries of the apparatuses (corpus callosum, corpus fornicis, thalamus, basis pontis, and medulla oblongata) are extracted for registration. For each group, the leftmost two images are the scene data (fixed images) and the model data (moving images). The next image is the initial state of the point sets created by the scene data and the model data. The rightmost two images are the registration results by CPD and our method, in which the model point sets (blue) align to the scene point sets (red). Because of the limitation of the contour extraction algorithm and for reasons inherent to the original images, these point sets contain numerous outliers and noise. However, our method performs well and demonstrates visually accurate image alignments under deformation, outliers, and noise.
To ensure a quantitative experimental comparison, we use the recall-accuracy curve as the evaluation criterion. First, for each pair of real data, we manually select 30 point pairs with obvious features as ground truth correspondences. Here,TPis defined as the number of the ground truth corresponding point pairs that fall within a given accuracy threshold in terms of pairwise distance.FNis defined as the number of the ground truth corresponding point pairs that fall outside the given accuracy threshold. The recall-accuracy curves of the three real data experiments, under different accuracy threshold (from 1 to 5 pixels), are shown inFig 11. The proposed method can obtain better recall values in most of the tested accuracy thresholds than CPD.
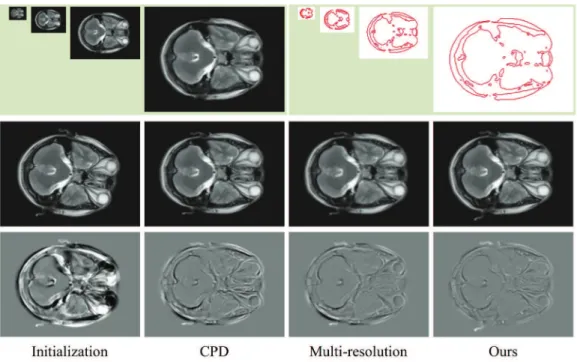
Because the structure descriptor provides some information of larger scale and a hierarchi-cal registration framework can do the same, we compare the proposed method with the multi-resolution registration method. The pair of sagittal plane brain MRI data inFig 10is selected again, and a multi-resolution registration method is designed to perform the experiment. The conventional CPD algorithm is applied with multi-resolution strategy. As shown inFig 12, we
Fig 10. Registration examples on the real data.The top row is a pair of thorax CT images, the middle row is a pair of transverse plane from brain MRI, and the bottom row is a pair of sagittal plane from brain MRI. For each row, the leftmost two images are the scene data and the model data. The next image is the initial state of the point sets extracted from the scene data and the model data. The rightmost two images are the registration results using CPD and our method, in which the model point sets (blue) align to the scene point sets (red).
construct 4 level pyramid images. In each level, the CPD algorithm is used, and the registration result is used as the initial value of the next level. The registration error of the CPD algorithm, multi-resolution method, and our method are listed inTable 2. The experimental results show that the performance of the multi-resolution method has certain improvements compared
Fig 12. Registration example and comparison of the multi-resolution method.The top row shows the pyramid images and the corresponding contour point sets of the fixed image. The middle row, from left to right, shows the initial moving image and the registration results of CPD, multi-resolution, and our method. The bottom row shows the differences between the images of the middle row and the fixed image.
doi:10.1371/journal.pone.0148483.g012
Table 2. Registration error for the sagittal plane brain MRI data.
CPD Multi-resolution Our method
Error 18.0001 13.5107 8.2350
doi:10.1371/journal.pone.0148483.t002
with the conventional CPD algorithm but still no more than our method because the multi-res-olution method requires down sampling, point set extraction, image interpolation, and trans-formation, etc. The error in each level transfers to the next level; thus, the cumulative error will inevitably increase. However, our method finds the optimal solution using only the structure descriptor and EM iteration processing. Thus, our method can avoid the accumulation of errors.
Discussion
The paper presents a method that is an improvement upon the CPD algorithm. Our contribu-tion consists of two aspects. First, adding structural informacontribu-tion by means of the shape context to calculate the similarity and find the correspondence, and adjusting the proportion of each GMM component according to the similarity. Second, the outlier ratio is automatically calcu-lated and optimized in the EM framework, thereby avoiding manual assignment of the wrong value (which may lead to an undesirable registration result). The experimental results show that our approach is robust to a large degree of degradation and outperforms CPD and other state-of-the-art non-rigid point set registration algorithms. Future work will involve further investigation of how to better use the structure information of point sets to find the correct cor-respondences in the presence of occlusion, noise, and outliers, in addition to studying how to increase the speed performance of the registration method that uses the structure descriptor.
Acknowledgments
The authors acknowledge Andriy Myronenko, Jiayi Ma, Haili Chui, and Bing Jian for provid-ing their implementation source codes and test datasets.
Author Contributions
Conceived and designed the experiments: LP GL. Performed the experiments: LP LX. Analyzed the data: LP MX. Wrote the paper: LP.
References
1. Sotiras A, Davatzikos C, Paragios N. Deformable medical image registration: A survey. Medical Imag-ing, IEEE Transactions on. 2013; 32(7):1153–1190. doi:10.1109/TMI.2013.2265603
2. Wang G, Wang Z, Chen Y, Zhao W. Robust point matching method for multimodal retinal image regis-tration. Biomedical Signal Processing and Control. 2015; 19:68–76. doi:10.1016/j.bspc.2015.03.004
3. Han X. Feature-constrained nonlinear registration of lung CT images. Medical image analysis for the clinic: a grand challenge. 2010; p. 63–72.
4. Belongie S, Malik J, Puzicha J. Shape matching and object recognition using shape contexts. Pattern Analysis and Machine Intelligence, IEEE Transactions on. 2002; 24(4):509–522. doi:10.1109/34. 993558
5. Zhang K, Li X, Zhang J. A robust point-matching algorithm for remote sensing image registration. Geo-science and Remote Sensing Letters, IEEE. 2014; 11(2):469–473. doi:10.1109/LGRS.2013.2267771
6. Wang S, You H, Fu K. BFSIFT: A novel method to find feature matches for SAR image registration. Geoscience and Remote Sensing Letters, IEEE. 2012; 9(4):649–653. doi:10.1109/LGRS.2011. 2177437
7. Besl PJ, McKay ND. Method for registration of 3-D shapes. In: Robotics-DL tentative. International Society for Optics and Photonics; 1992. p. 586–606.
8. Chui H, Rangarajan A. A new point matching algorithm for non-rigid registration. Computer Vision and Image Understanding. 2003; 89(2):114–141. doi:10.1016/S1077-3142(03)00009-2
9. Myronenko A, Song X. Point set registration: Coherent point drift. Pattern Analysis and Machine Intelli-gence, IEEE Transactions on. 2010; 32(12):2262–2275. doi:10.1109/TPAMI.2010.46
11. Ma J, Chen J, Ming D, Tian J. A mixture model for robust point matching under multi-layer motion. PloS one. 2014; 9(3):e92282. doi:10.1371/journal.pone.0092282PMID:24658087
12. Gerogiannis D, Nikou C, Likas A. Registering sets of points using Bayesian regression. Neurocomput-ing. 2012; 89:122–133. doi:10.1016/j.neucom.2012.02.018
13. Qu HB, Li JC, Wang JQ, Xiang L, Tao HJ. Robust Point Set Matching under Variational Bayesian Framework. In: Pattern Recognition (ICPR), 2014 22nd International Conference on. IEEE; 2014. p. 58–63.
14. Myronenko A, Song X, Carreira-Perpinán MA. Non-rigid point set registration: Coherent point drift. In: Advances in Neural Information Processing Systems; 2006. p. 1009–1016.
15. Hu Y, Rijkhorst EJ, Manber R, Hawkes D, Barratt D. Deformable vessel-based registration using land-mark-guided coherent point drift. In: Medical Imaging and Augmented Reality. Springer; 2010. p. 60–69.
16. Wang P, Wang P, Qu Z, Gao Y, Shen Z. A refined coherent point drift (CPD) algorithm for point set reg-istration. Science China Information Sciences. 2011; 54(12):2639–2646. doi: 10.1007/s11432-011-4465-7
17. Habert S, Khurd P, Chefd’hotel C. Registration of multiple temporally related point sets using a novel variant of the coherent point drift algorithm: application to coronary tree matching. In: SPIE Medical Imaging. International Society for Optics and Photonics; 2013. p. 86690M–86690M.
18. Gao Y, Ma J, Zhao J, Tian J, Zhang D. A robust and outlier-adaptive method for non-rigid point registra-tion. Pattern Analysis and Applications. 2014; 17(2):379–388. doi:10.1007/s10044-013-0324-z
19. Liu S, Sun G, Niu Z, Li N, Chen Z. Robust rigid coherent point drift algorithm based on outlier suppres-sion and its application in image matching. Journal of Applied Remote Sensing. 2015; 9(1):095085– 095085. doi:10.1117/1.JRS.9.095085
20. de Sousa S, Kropatsch WG. Graph-based point drift: Graph centrality on the registration of point-sets. Pattern Recognition. 2015; 48(2):368–379. doi:10.1016/j.patcog.2014.06.011
21. Sang Q, Zhang JZ, Yu Z. Robust non-rigid point registration based on feature-dependant finite mixture model. Pattern Recognition Letters. 2013; 34(13):1557–1565. doi:10.1016/j.patrec.2013.06.019
22. Tao W, Sun K. Asymmetrical Gauss Mixture Models for Point Sets Matching. In: Computer Vision and Pattern Recognition (CVPR), 2014 IEEE Conference on. IEEE; 2014. p. 1598–1605.
23. Zhou Z, Zheng J, Dai Y, Zhou Z, Chen S. Robust non-rigid point set registration using student’s-t mix-ture model. PloS one. 2014; 9(3):e91381. doi:10.1371/journal.pone.0091381PMID:24618749
24. Wang G, Wang Z, Zhao W, Zhou Q. Robust Point Matching Using Mixture of Asymmetric Gaussians for Nonrigid Transformation. In: Computer Vision–ACCV 2014. Springer; 2014. p. 433–444.
25. Wang G, Wang Z, Chen Y, Zhao W. A robust non-rigid point set registration method based on asym-metric gaussian representation. Computer Vision and Image Understanding. 2015; 141:67–80. doi:10. 1016/j.cviu.2015.05.014
26. Zheng Y, Doermann D. Robust point matching for nonrigid shapes by preserving local neighborhood structures. Pattern Analysis and Machine Intelligence, IEEE Transactions on. 2006; 28(4):643–649. doi:10.1109/TPAMI.2006.81
27. Ma J, Zhao J, Tian J, Tu Z, Yuille AL. Robust estimation of nonrigid transformation for point set registra-tion. In: Computer Vision and Pattern Recognition (CVPR), 2013 IEEE Conference on. IEEE; 2013. p. 2147–2154.
28. Chen J, Ma J, Yang C, Ma L, Zheng S. Non-rigid point set registration via coherent spatial mapping. Signal Processing. 2015; 106:62–72. doi:10.1016/j.sigpro.2014.07.004
29. Lee JH, Won CH. Topology preserving relaxation labeling for nonrigid point matching. Pattern Analysis and Machine Intelligence, IEEE Transactions on. 2011; 33(2):427–432. doi:10.1109/TPAMI.2010.179
30. Yan Xw, Wang W, Zhao J, Hu Jm, Zhang J, Wan Jw. Relaxation labeling for non-rigid point matching under neighbor preserving. Journal of Central South University. 2013; 20:3077–3084. doi:10.1007/ s11771-013-1831-1
31. Jin F, Feng D. Image Registration Algorithm Using Mexican Hat Function-Based Operator and Grouped Feature Matching Strategy. PloS one. 2014; 9(4):e95576. doi:10.1371/journal.pone.0095576PMID: 24752223
32. Ge S, Fan G, Ding M. Non-rigid Point Set Registration with Global-Local Topology Preservation. In: Computer Vision and Pattern Recognition Workshops (CVPRW), 2014 IEEE Conference on. IEEE; 2014. p. 245–251.
33. Tang J, Shao L, Zhen X. Robust point pattern matching based on spectral context. Pattern Recognition. 2014; 47(3):1469–1484. doi:10.1016/j.patcog.2013.09.017