DWESD
1, 87–115, 2008Removal of dissolved and particulate iron
from groundwater
K. Teunissen et al.
Title Page
Abstract Introduction
Conclusions References
Tables Figures
◭ ◮
◭ ◮
Back Close
Full Screen / Esc
Printer-friendly Version
Interactive Discussion Drink. Water Eng. Sci. Discuss., 1, 87–115, 2008
www.drink-water-eng-sci-discuss.net/1/87/2008/ © Author(s) 2008. This work is distributed under the Creative Commons Attribution 3.0 License.
Drinking Water Engineering and Science Discussions
Drinking Water Engineering and Science Discussionsis the access reviewed
discussion forum ofDrinking Water Engineering and Science
Removal of both dissolved and
particulate iron from groundwater
K. Teunissen1, A. Abrahamse2, H. Leijssen3, L. Rietveld1, and H. van Dijk1
1
Delft University of Technology, PO Box 5048, 2600 GA Delft, The Netherlands
2
Kiwa Water Research, PO Box 1072, 3430 BB Nieuwegein, The Netherlands
3
Vitens Flevoland, PO Box 1090, 8200 BB Lelystad, The Netherlands
Received: 12 March 2008 – Accepted: 29 April 2008 – Published: 5 June 2008 Correspondence to: K. Teunissen ([email protected])
DWESD
1, 87–115, 2008Removal of dissolved and particulate iron
from groundwater
K. Teunissen et al.
Title Page
Abstract Introduction
Conclusions References
Tables Figures
◭ ◮
◭ ◮
Back Close
Full Screen / Esc
Printer-friendly Version
Interactive Discussion
Abstract
Iron is the primary source for discolouration problems in the drinking water distribu-tion system. The removal of iron from groundwater is a common treatment step in the production of drinking water. Even when clear water meets the drinking water stan-dards, the water quality in the distribution system can deteriorate due to settling of 5
iron (hydroxide) particles or post-treatment flocculation of dissolved iron. Therefore it is important to remove dissolved and particulate iron to a large extent. This paper de-scribes the study towards the current iron removal processes and experimental work towards improving removal of dissolved and particulate iron. The study was carried out at groundwater treatment plant Harderbroek, consisting of aeration, rapid sand filtra-10
tion and tower aeration. The research contains two parts: 1) a particle fingerprint of the treatment, resulting in a quantification of particles breaking through the rapid sand filtration. 2) Small column experiments on the oxidation and filterability of iron. The fingerprint showed that operational events such as switching on/offof filters and back-washing have a significant impact on the volume concentration of particles breaking 15
through the filter. A frequency plot of the different size ranges of particles indicates that mainly the filterability of the middle size ranges (2–7µm) of particles was influenced
by switching a filter on/off. A backwash event mainly affects the bigger particle size ranges. The column experiments showed that in the cascade effluent the majority of the iron is dissolved iron(II), indicating that the oxidation of iron(II) to iron(III) is the rate 20
DWESD
1, 87–115, 2008Removal of dissolved and particulate iron
from groundwater
K. Teunissen et al.
Title Page
Abstract Introduction
Conclusions References
Tables Figures
◭ ◮
◭ ◮
Back Close
Full Screen / Esc
Printer-friendly Version
Interactive Discussion
1 Introduction
Iron is removed during groundwater treatment. However, the iron removal is usually incomplete. Iron particles (consisting of Fe(III)oxides and hydroxides) in water supplies cause various aesthetic and operational problems including bad taste, discolouration and deposition and resuspension in the distribution system. In addition to particulate 5
iron, dissolved iron (Fe(II)) can cause post-treatment flocculation forming extra iron particles.
In some publications on the corrosion of cast iron in potable water systems it is concluded that this is a major cause of discolouration (Smith et al., 1997; McNeill and Edwards, 2001). Recent studies (Prince et al., 2003; Vreeburg, 2007) suggest that 10
other sources of particles play a role in the discolouration problem. Vreeburg (2007) states that particles in the drinking water leaving the treatment plant are in most cases the main source for deposits in the network. These deposits may cause discolouration (high turbidity) after resuspension, e.g. due to increased flow. In the Netherlands, the mandatory drinking water standard for iron is 0.2 mg/l. Verberk (2006) showed that 15
even with a clear water concentration of 0.01 mg Fe/l, post-flocculation of dissolved iron can lead to a significant increase of particulate iron. In order to avoid post-flocculation and subsequent sedimentation of iron in the distribution network, companies should thus aim for a very low total iron concentration in the clear water.
Conventionally, iron is removed from groundwater by the processes of aeration and 20
rapid filtration (O’Connor, 1971; Salvato, 1992). Different mechanisms may contribute to the iron removal in filters; flock filtration, adsorptive iron removal and biological iron removal. Which mechanism is dominant depends on the groundwater quality and the process conditions (Lerk, 1965; Hatva, 1989; Mouchet, 1992; Søgaard et al., 2000).
Iron present in anaerobic groundwater will be in the reduced state (Fe(II)). In the 25
presence of oxygen, iron(II) will be oxidised to iron(III) (Lerk, 1965). The solubility prod-uct of iron(III)hydroxide is very low (2.0×10−39 at 25◦C (Jones, 2000)) and hence the
DWESD
1, 87–115, 2008Removal of dissolved and particulate iron
from groundwater
K. Teunissen et al.
Title Page
Abstract Introduction
Conclusions References
Tables Figures
◭ ◮
◭ ◮
Back Close
Full Screen / Esc
Printer-friendly Version
Interactive Discussion that will grow depending on residence time and G-values. These flocks will
subse-quently be removed by filtration.
The oxidation (1) and hydrolysis (2) reactions and the overall reaction equation are (Lerk, 1965):
4Fe2++O2+2H2O↔4Fe3++4OH− (1)
5
4Fe3++4OH−+(2x+2)H
2O↔2(Fe2O3.xH2O)+8H+ (2) The overall reaction equation becomes:
4Fe2++O2+(2x+4)H2O↔2(Fe2O3.xH2O)+8H+ (3) Oxidation and hydrolysis strongly depend on the pH. At low pH the reaction rate is low; the reaction rate increases with increasing pH. Depending on the pH value the 10
formed colloids can become positively or negatively charged. Charged colloids do not flocculate very well.
Instead of oxidation followed by flocculation, iron(II) may also be removed by adsorp-tive filtration (Sharma, 2001): The ions are adsorbed onto the catalytic surface of the filter media. Subsequently, in the presence of oxygen, the adsorbed iron(II) is oxidised 15
forming a new surface for adsorption; in this way the process continues.
The iron(II) adsorption capacity depends on the surface conditions of the filter ma-terial, the oxygen concentration and on the pH of the water. The capacity may also be influenced by other ions or organic matter present in the water (Mn2+, Ca2+, NH+4 and NOM) (Sharma et al., 2002). Calcium ions negatively affect the iron(II) adsorp-20
tion. The performance of flock filtration iron removal from soft waters is, however, poor (Hult, 1973) due to the formation of weak flocks. Adsorptive iron removal is the dom-inant mechanism if pre-oxidation of iron(II) before filtration is minimal. This can be achieved by reducing the oxidant concentration or time available for the oxidation reac-tion (Sharma, 2001). Sharma (2001) compared flock filtrareac-tion and adsorptive filtrareac-tion 25
DWESD
1, 87–115, 2008Removal of dissolved and particulate iron
from groundwater
K. Teunissen et al.
Title Page
Abstract Introduction
Conclusions References
Tables Figures
◭ ◮
◭ ◮
Back Close
Full Screen / Esc
Printer-friendly Version
Interactive Discussion As mentioned above, recent insights indicate that iron should be removed to
con-centrations well below the norm. Therefore, removal of both dissolved and particulate iron by the conventional treatment process is studied. By applying different methods, a complete picture of the iron removal at a typical groundwater treatment plant is ob-tained. The oxidation, particle formation and removal of particles is studied and in 5
addition two hypothesis were tested:
1. Iron removal is not sufficient because the formed iron hydroxide flocks break down due to high turbulence in the cascade or filter inlet construction.
2. The oxidation of iron(II) to iron(III) does not perform well due to a too low pH of the cascade effluent.
10
In this study particle counters and filtration equipment are used and iron analyses are performed. The oxidation rate of iron (II) is shown to be low, but it may be in-creased by increasing the pH. Furthermore, breakdown of flocks after the cascade aeration does not seem to affect particles breaking through the filter, however, oper-ational events such as a filter switch and a backwash, significantly affect the particle 15
load to the distribution network.
2 Methods
2.1 Analyses
HCO−
3/pH
Performed in the laboratory of Vitens in Utrecht. pH and HCO−
3 samples are collected in 20
“special air removal bottles”. pH is analysed conform NEN 6411. HCO−
DWESD
1, 87–115, 2008Removal of dissolved and particulate iron
from groundwater
K. Teunissen et al.
Title Page
Abstract Introduction
Conclusions References
Tables Figures
◭ ◮
◭ ◮
Back Close
Full Screen / Esc
Printer-friendly Version
Interactive Discussion
Iron(II) analysis
Spectofotometric determination of iron(II). Dissolved iron(II) forms a purple complex with the reagent ferrozine. (3-(2-pyridyl)-5,6-diphenyl-1,2,4-triazine 4,4′-disulfonacid disodium salt. xH2O). Iron(III) does not form complexes with this reagent. Thus only iron(II) is determined. Samples were taken in 100 ml bottles, containing 2 ml HCl for 5
conservation. The acid results in a very low pH, limiting the oxidation reaction.
Iron total
Metal samples conserved with 2 ml HNO3. The total iron concentration is determined with ICP-MS, in conformance with ISO 17294-2.
Iron(II) – iron(III) analysers
10
Applicon, type Alert 2004 colorimeters, installed at different locations and filter bed heights at treatment plant Harderbroek.
Particle counter
Pamas, type: WaterViewer, 8 channels, Size range 1–100µm.
TILVS
15
The TILVS equipment consists of a pump (TrueDos M 209, Alldos) which maintains a constant flow through a filter, regardless the pressure building up due to filtration. The TILVS concentrates the particles from the water on a filter which can be used for de-termining the mass and chemical composition of the particles. For mass determination the TILVS filter was filtered with Milli-Q water, dried in an oven (105◦C) and weighted 20
DWESD
1, 87–115, 2008Removal of dissolved and particulate iron
from groundwater
K. Teunissen et al.
Title Page
Abstract Introduction
Conclusions References
Tables Figures
◭ ◮
◭ ◮
Back Close
Full Screen / Esc
Printer-friendly Version
Interactive Discussion is digested in nitric acid and analysed by NPOC (Non purgable organic carbon) and an
ICP-MS scan (Inductively coupled plasma – mass spectroscopy). The applied filters were glass micro fibre filters with a pore size of 0.7µm (GF/F, Whatman).
2.2 Materials
2.2.1 Characteristics treatment plant Harderbroek 5
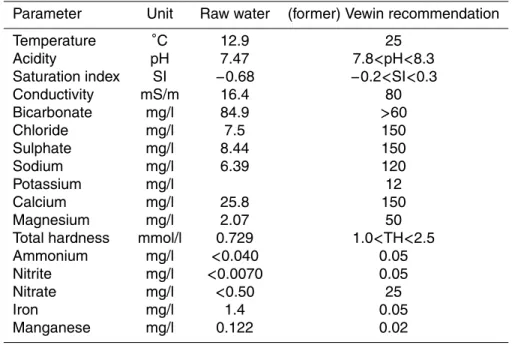
Drinking water at Harderbroek is produced from groundwater. The raw water quality is summarised in Table 1. A maximum flow of 1800 m3/h can be treated and the aver-age production is 800 m3/h. The treatment consists of three steps: cascade aeration (4 units, each 450 m3/h, 5 steps), filtration (8 filters, average flow 220 m3/h, filter bed depth 2 m, surface 24 m2) and tower aeration (3 towers, each 320 m3/h) The mean iron 10
concentration in the clear water is 0.04 mg/l.
2.2.2 Fingerprint
At Harderbroek the presence and removal of particles in the treatment plant is deter-mined, the so-called fingerprint. A distinction is made between normal treatment and operational events. A particle size distribution is obtained by using the 8 channel parti-15
cle counters from PAMAS, type Waterviewer. Particles are counted during a complete filter run (32 h). At the same time TILVS were continuously filtering filter effluent. Af-ter the filAf-ter run the backwash waAf-ter was analysed, to obtain a mass balance of the filtration process.
In order to quantify the contribution of operational events on the total volume load, 20
DWESD
1, 87–115, 2008Removal of dissolved and particulate iron
from groundwater
K. Teunissen et al.
Title Page
Abstract Introduction
Conclusions References
Tables Figures
◭ ◮
◭ ◮
Back Close
Full Screen / Esc
Printer-friendly Version
Interactive Discussion 2.2.3 Column set-up
Four identical columns, with a diameter of 9 cm are used. They are flow controlled with four separate flow control meters. The applied flow was 60 l/h per column, which corresponds to a filtration velocity of 10 m/h. They are operated by hand and filled with ripened filter material from the Harderbroek filters. The available filter bed height was 5
25 cm. Before starting the experiments the columns are flushed for 8 h with clear water to wash out most dirt.
The filterability is determined by measuring turbidity, iron concentrations (iron(II) and total iron separately) and a particle counter. Samples were taken 1 h and 4 h after the start-up of the filtration experiment. After an experiment (4 h) the filters were back-10
washed. The backwash is performed with drinking water. The applied backwash flow was 350 l/h (55 m/h) for 10 min. The expansion during a backwash event was between 20% and 28%.
2.3 Experiments
2.3.1 Fingerprint 15
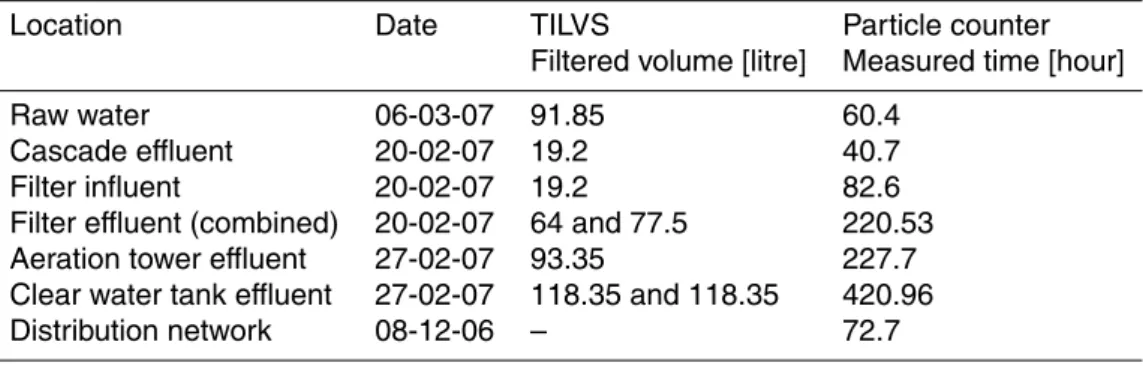
During the fingerprint measurements two situations are distinguished: stable operation and operation in which “events” occur. For particle behaviour during operational events, only the particle count data are used. In order to compare particle counting data and TILVS, they are installed in parallel throughout the treatment plant. Table 2 shows a schedule of the measurements on each location.
20
2.3.2 Column experiments
DWESD
1, 87–115, 2008Removal of dissolved and particulate iron
from groundwater
K. Teunissen et al.
Title Page
Abstract Introduction
Conclusions References
Tables Figures
◭ ◮
◭ ◮
Back Close
Full Screen / Esc
Printer-friendly Version
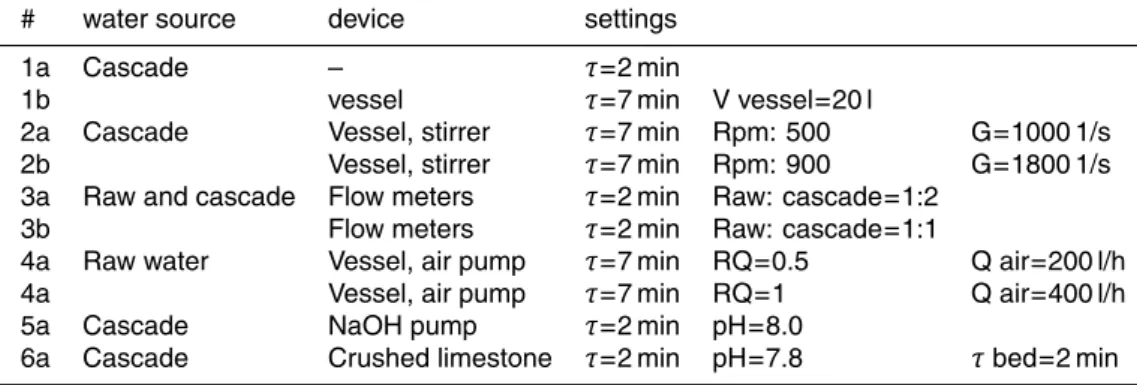
Interactive Discussion the iron(III) hydroxide flock formation and removal. During the first part of the column
experiments the influent water treatment is varied resulting in four different water types, see Table 3. Mixing intensity, residence time, iron(II) concentration in the influent and the type of aeration were varied. The second part is focussed on adjustments in the filtration process, in order to test hypothesis 2 and to test improvement of the oxidation 5
and the removal of iron in the filter. With caustic soda dosage and crushed limestone filtration the pH is increased.
Water type 1 is the reference. Cascade effluent water was mixed with a stirrer, which simulates the filter inlet construction of the filter in the treatment plant. The water type 2 originates directly from the cascade, without a mixing phase (as the hypothesis is that 10
the mixing intensity in the inlet was so high that flocks are broken up again). Water type 3 is mixed water; a part of the water is cascade effluent water, and the rest is raw water (ratio 2:1 and 1:1, to limit pre-oxidation and hydrolysis)). Type 4 is raw water which passed a combination of spray and bubble aeration.
During the second part of the column experiments pH adjustments were performed, 15
in order to investigate the kinetics of the iron oxidation processes at Harderbroek. With a membrane pump caustic soda (0.01 M) is dosed in one of the two influent pipe lines, feeding columns 1 and 2. The dosing point was situated 2 m before the columns, which gives a residence time of 5 s in the tubing before the filter columns and another 100 s in the supernatant water. To study the effect of crushed limestone on the pH in two of 20
DWESD
1, 87–115, 2008Removal of dissolved and particulate iron
from groundwater
K. Teunissen et al.
Title Page
Abstract Introduction
Conclusions References
Tables Figures
◭ ◮
◭ ◮
Back Close
Full Screen / Esc
Printer-friendly Version
Interactive Discussion
3 Results and discussion
3.1 Fingerprint
3.1.1 Particle counter in filter effluent during events
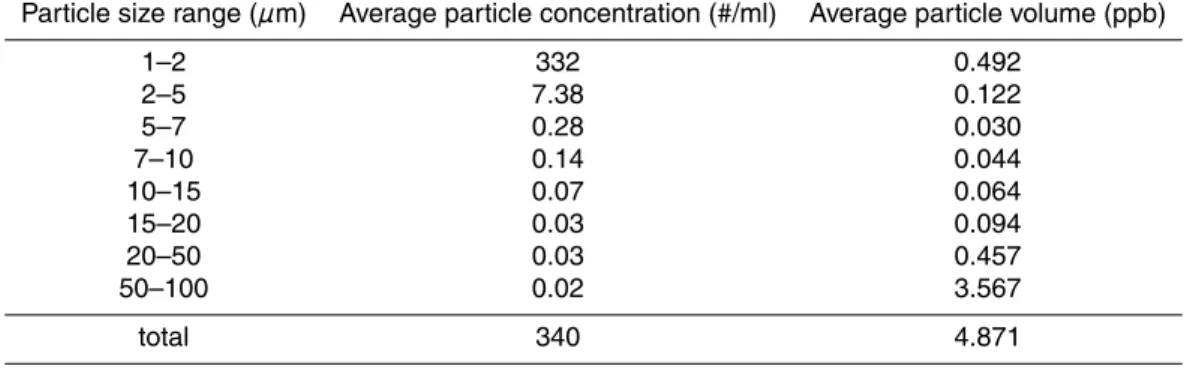
During stable treatment operation, the particle volume concentration is measured and summarised in Table 4.
5
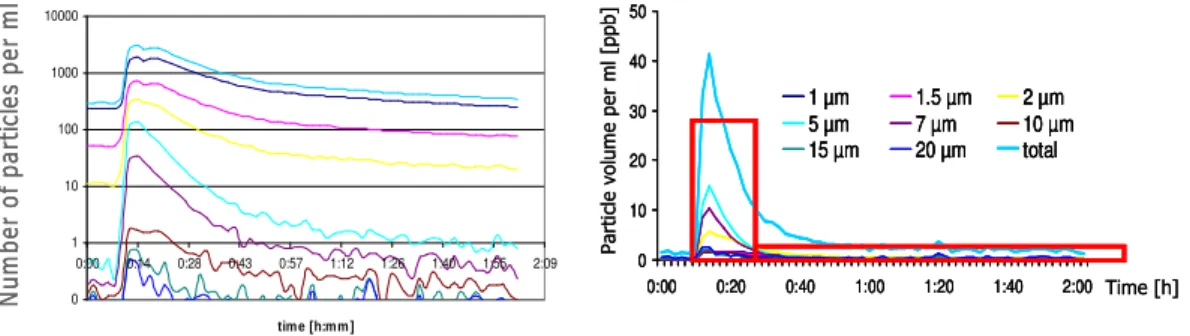
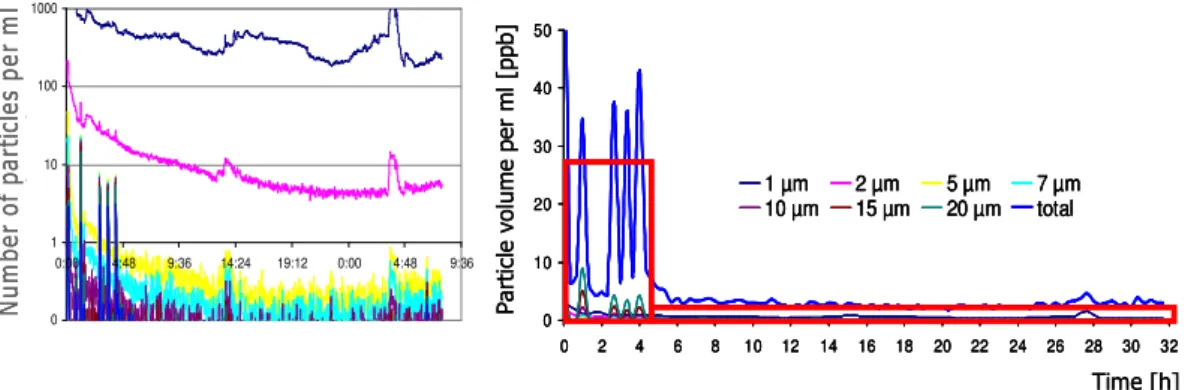
The particle counts in the filter effluent during events are shown in Figs. 1 and 2. At the start of the experiment filters 2 and 3 were in operation. When the particle counter shows a stable value, filter 1 is switched on. A clear peak in particle number (Fig. 1a) and particle volume concentration (Fig. 1b) is detected. Figure 2a shows the particle counts during a complete filter run, starting immediately after the filter was 10
backwashed. At the start of the filter run the numbers are higher compared to stable operation. Figure 2b clearly shows the higher particle volume during 4 h.
The squares in the volume graphs indicate the contribution of the event to the total volume, compared to the contribution of the stable operation.
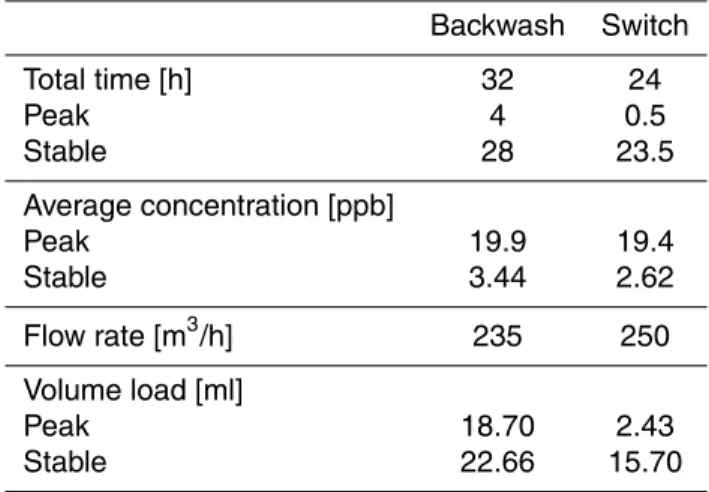
During stable operation, lasting for 24 h, the particle volume load was 15.7 ml. As a 15
result of switching the filter, the particle volume during the peak, which lasts for 30 min, was 2.4 ml. So, in only 2% of the time 15% of the total particle load is breaking through the filter (Table 5 and Fig. 1b).
For a backwash event the load from the peak is compared to the load of the total filter run (32 h). The load during the first 4 h is 18.7 ml, while the total load during the 20
stable part of the filter run time (28 h) is 22.6 ml. Thus, in 13% of the time, 45% of the particle volume load is added to the filter effluent (Table 5 and Fig. 2b).
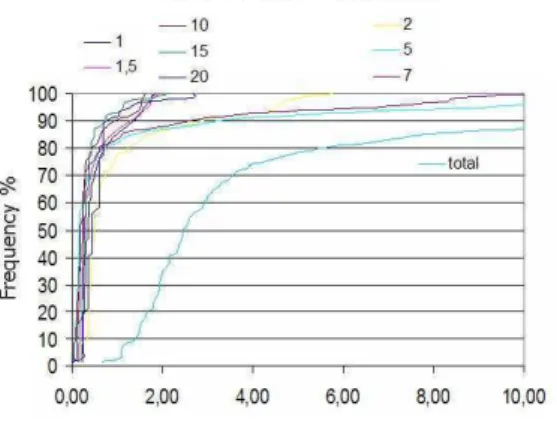
A frequency curve indicates which volume concentration occurs during which time fraction. Such a curve is plotted of the particle volumes calculated at every data point during a filter run. This was done for the different size ranges of particles separately 25
DWESD
1, 87–115, 2008Removal of dissolved and particulate iron
from groundwater
K. Teunissen et al.
Title Page
Abstract Introduction
Conclusions References
Tables Figures
◭ ◮
◭ ◮
Back Close
Full Screen / Esc
Printer-friendly Version
Interactive Discussion measured time interval (more peaks).
In Fig. 3a the S-curve for a filter switch is plotted. The curves for the size ranges 1 to 1.5 and 1.5 to 2µm and 10–15, 15–20 and>20µm show a steep S-shape. These
particle sizes occur in a constant volume over the measured time interval. But the size ranges 2–5 , 5–7 and 7–10µm show a less steep S-curve. The smaller particles (1
5
and 1.5) are removed to a smaller extent by filtration compared to other size ranges, so an event does not significantly influence the filterability of these particles. The larger particles (10, 15 and 20µm) have such a high filterability that they are always well
removed, also during an event. The particles in the middle size ranges (2–10µm) are
significantly influenced by the event. 10
In Fig. 3b the frequency curves for the complete filter run (after a backwash) are plotted. In this graph the curves for the size ranges 10–15 and 15–20 show a less uni-form volume concentration. After a backwash event mainly the larger particles break through. This can be explained by the settling properties of particles. Larger parti-cles have better settling properties and are therefore hardly removed by backwashing. 15
These particles stay in the filter bed and break through when filtration is started. These larger particles are undesired in the distribution system, because of their good settling properties.
3.1.2 TILVS and particle counter throughout the treatment
Table 6 shows the results for the TILVS and the particle counters, installed in the same 20
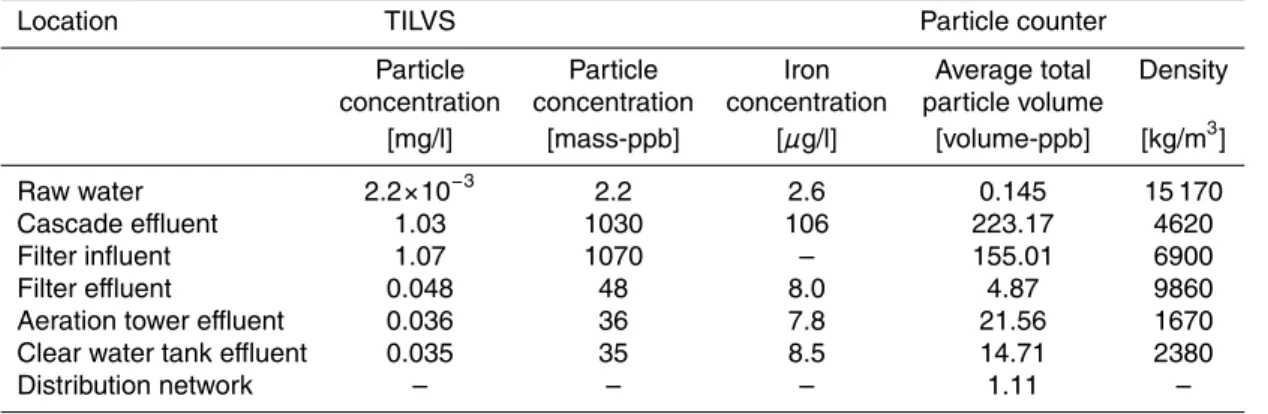
time period. From the mass on the filter in the TILVS filtration equipment and the known volume that passed the filter, the average particle concentrations are calculated. With the NPOC ICP-MS scan the iron concentration of the residual is determined. As expected, both methods show the formation of particles during cascade aeration and the removal of particles during filtration. To relate the data of the TILVS measurements 25
and the particle counts, a density is calculated by dividing the concentration (in mass) from the TILVS by the concentration (in volume) from the particle counter data.
DWESD
1, 87–115, 2008Removal of dissolved and particulate iron
from groundwater
K. Teunissen et al.
Title Page
Abstract Introduction
Conclusions References
Tables Figures
◭ ◮
◭ ◮
Back Close
Full Screen / Esc
Printer-friendly Version
Interactive Discussion the values are much higher than expected. Verberk (2006) reported a floc density
of 1037 kg/m3, which is a more realistic value. If the particles were present as iron hydroxide flocs, these could have had a loose structure, which probably gives a density only slightly higher than that of water. However, as will be shown later, oxidation and hydrolysis were very slow, which may have resulted in adsorptive iron removal. The 5
iron particles formed in this way, may have a higher density. Nevertheless, the average density value of 7130 kg/m3 then still seems to be much too high. This can only be explained by differences between the methods. E.g. the TILVS filters had a pore size of 0.7µm, while the particle counter starts measuring only from 1µm. Thus, it might
be that small particles are accumulated on the filter, which are not measured by the 10
particle counter. It even can occur that smaller particles than 0.7µm were retained by
the TILVS filter, due to cake filtration and pore blocking. This may have resulted in a much higher mass-pbb measured with TILVS, compared to volume-ppb measured with the particle counter, which results in an overestimation of the density.
The latter effect can also explain the differences in densities throughout the treat-15
ment. In the raw water a lot of small particles are present, so probably also a lot of particles below 1µm, which are not counted by the particle counter, but are retained
by the TILVS filters. This will result in a too high density. At measuring locations where small particles and low particle concentration are expected, such as raw water and filter effluent, the calculated density is high. This can be due to a relative bigger deviation 20
between the particle counter and the TILVS.
The particle counter and the TILVS are both strong tools which enable to investigate particles on composition and changes. But in this research, it seemed to be hard to combine the results from both methods for density estimation. Nevertheless, it is useful to apply both methods in parallel, because the particle counter data mainly give 25
DWESD
1, 87–115, 2008Removal of dissolved and particulate iron
from groundwater
K. Teunissen et al.
Title Page
Abstract Introduction
Conclusions References
Tables Figures
◭ ◮
◭ ◮
Back Close
Full Screen / Esc
Printer-friendly Version
Interactive Discussion 3.2 Column experiments part 1
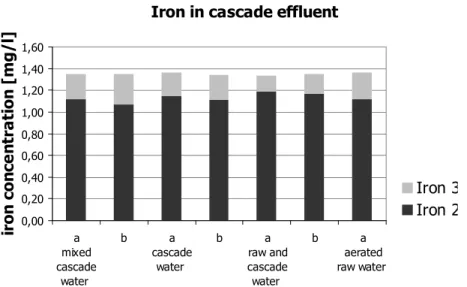
In the first part of the column experiments, the different influent water types, did not show significant differences. Thus, hypothesis 1 was not rejected. The iron in the cascade effluent water consists mainly of iron(II) (Fig. 4), while it is expected to find mainly iron(III) after the aeration step. pH measurements gave reason to assume that 5
this is due to a slow oxidation rate (pH=7.5). Figure 5 shows the (slow) oxidation of Fe(II) in the supernatant of a filter, which was out of order after it was backwashed. The iron(II) concentration does decrease, but this process takes hours. For the flock filtration at Harderbroek the oxidation of iron(II) is thus the rate determining step, limited by the pH.
10
3.3 Column experiments part 2
In part two of the column experiments, the pH is adjusted. With caustic soda dosage the influent pH is changed, while during crushed limestone filtration the pH changes during filtration. The results for the measured iron(II) and iron(III) concentration are plotted in Fig. 6. The pH in the influent of the columns after the NaOH dosage is 15
about 8.0. The iron(II) concentration in the influent water is decreased compared to the reference, from 1.2 mg/l to 0.8 mg/l. The iron(II) concentration in the effluent is decreased from 0.4 mg/l to less than 0.1 mg/l. During the backwash procedure after the caustic soda dosage experiment, the backwash water showed a deep brownish red colour, indicating the presence of iron hydroxide flocks.
20
The crushed limestone filtration experiment results in a slight increase of the pH in the effluent water, from 7.5 to 7.65. The contact time between the water and the crushed limestone was too short for the required pH increase. But still a slight im-provement of the iron removal is noticed. The iron(II) concentration in the effluent in decreased from 0.4 mg/l to 0.2 mg/l. The measured iron(II) concentration in the most 25
DWESD
1, 87–115, 2008Removal of dissolved and particulate iron
from groundwater
K. Teunissen et al.
Title Page
Abstract Introduction
Conclusions References
Tables Figures
◭ ◮
◭ ◮
Back Close
Full Screen / Esc
Printer-friendly Version
Interactive Discussion occurred during the iron(II) analysis.
The results of the column experiments to test hypothesis 2 are presented in Fig. 6. The red (lowest) bars indicate iron(II) and the blue (uppest) bars indicate iron(III). The straight bars show the results of the dosage experiment, the striped bars show the results of the reference experiments. From the caustic soda dosage experiment, it 5
can be concluded that an increase of pH by the dosage of caustic soda results in less iron(II) in the influent water. The oxidation of iron(II) into iron(III) has increased. The effluent iron(II) concentration is decreased compared to the reference columns. A pH increase results in better oxidation and iron(II) removal. The iron(III) concentration in the effluent columns is remarkable, which is increased compared to the reference ex-10
periment. Removal of iron(III) hydroxide flocks needs attention in further research. For the crushed limestone experiment there is no difference in the influent concentration, because the pH is only increased during filtration. The iron(II) as well as the iron(III) removal seems to be slightly better than the reference experiment, but this is not signif-icant. Crushed limestone filtration seems to be a promising alternative, but the contact 15
time in the columns was too short to obtain reliable results. Extended experiments with longer contact time are recommended.
Thus at Harderbroek after cascade aeration, the majority of the iron is present as dissolved iron(II) because of the slow oxidation rate. The treatment is not designed for adsorptive removal.
20
To improve the iron removal at Harderbroek the following may be suggested: (i) Caustic soda dosage (NaOH) in the cascade step, to achieve a good mixing. This dosage is easy to implement. However, due to the low buffering capacity it will be very sensitive for pH variations and will be difficult to control; (ii) Crushed limestone filtration. Although during the experiments the contact time was too short, Oomen et al. (1983) 25
DWESD
1, 87–115, 2008Removal of dissolved and particulate iron
from groundwater
K. Teunissen et al.
Title Page
Abstract Introduction
Conclusions References
Tables Figures
◭ ◮
◭ ◮
Back Close
Full Screen / Esc
Printer-friendly Version
Interactive Discussion the process. Therefore it is stable and there is no need for operation and control. An
undesired side effect from this process can be an increase of small particles in the fil-ter effluent, caused by dissolving calcium; (iii) A last alternative is to move the aeration tower to be applied directly on raw water. More intensive aeration (and removal of CO2) of raw water will increase the pH. Some extra pipelines and pumping are necessary. An 5
advantage of this alternative is the absence of chemical dosages. It can be expected that fouling of the aeration tower can be controlled, because of the low particle load of the raw water. Alternative (i) and (ii) have the positive side effects of an increase in the SI (Saturation Index) resulting in less aggressive water and an increase of the buffering capacity.
10
4 Conclusions
The aim of this research was to study the removal of both dissolved and particulate iron by the conventional treatment process. By applying different methods, a complete picture of the iron removal at a typical groundwater treatment plant is obtained. The oxidation, particle formation and removal of particles are studied and in addition two 15
hypotheses were tested.
The fingerprint showed that operational events have a significant impact on the vol-ume concentration of particles breaking through the filter. Switching on/off of filters influences mainly the middle size ranges (2–10µm). A backwash event mainly affects
the breakthrough of particles >10µm. The backwash resulted in a peak in volume
20
load for 4 h. During this peak in 13% of the filter run time, 45% of the volume load is added to the effluent. The majority of this volume exists of the larger particles with good settling properties, which are undesired in the distribution system. Recirculation of the filtrate during the first hours may result in an improvement of the treatment at Harderbroek and the volume load will probably be significantly decreased.
25
DWESD
1, 87–115, 2008Removal of dissolved and particulate iron
from groundwater
K. Teunissen et al.
Title Page
Abstract Introduction
Conclusions References
Tables Figures
◭ ◮
◭ ◮
Back Close
Full Screen / Esc
Printer-friendly Version
Interactive Discussion sure the particle counter and the TILVS are measuring the same fraction of suspended
matter. Nevertheless, they give complementary information. A particle counter can be used to measure variation in particle concentration, while TILVS can be used to measure the absolute mass of the particulate material.
Column experiments showed mainly iron(II) in the aerated water. pH measurements 5
gave reason to assume a slow oxidation rate. After NaOH dosage, the oxidation and the subsequent removal by filtration of iron(II) increased. For the flock filtration at Hard-erbroek the oxidation of iron(II) is the rate determining step, limited by the pH.
Good possibilities for improving the iron removal at Harderbroek are caustic soda dosage or crushed limestone filtration. Both alternatives will result in a higher pH and 10
therefore a better oxidation of iron. An alternative without dosing a chemical is to make tower aeration the first treatment step (instead of the last step). When tower aeration is applied on raw water, the pH of the aerated water will probably be higher than currently is the case with only cascade aeration.
References
15
Hatva, T.: Iron and Maganese in groundwater in Finland: Occurrence in glacifluvial aquifers and removal by biofiltration, National board of water and environment, Helsinki, Finland, 1989.
Hult, A.: Filtration of iron during and after oxidation, Effl. Wat. Treat. J. April, 13, 209–215,
1973.
Jones, L. and Atkins, P.: Chemistry – Molecules, Matter, and Change. University of Northern
20
Colorado and Oxford University, W. H. Freeman and Company New York 2000.
Lerk, C. F.: Enkele aspecten van de ontijzering van grondwater, PhD dissertation, Technical University Delft, The Netherlands, 1965 (in Dutch).
Mayer, T. D. and Jarrell, W. M.: Phosphorus sorption during iron(II) oxidation in the presence of dissolved silica, Water Res., 34, 16, 3949–3956, 2000.
25
McNeill, L. S. and Edwards, M.: Iron pipe corrosion in distribution systems, J. Am. Water. Works Ass., 93(7), 88–100, 2001.
DWESD
1, 87–115, 2008Removal of dissolved and particulate iron
from groundwater
K. Teunissen et al.
Title Page
Abstract Introduction
Conclusions References
Tables Figures
◭ ◮
◭ ◮
Back Close
Full Screen / Esc
Printer-friendly Version
Interactive Discussion
O’Conner, J. T.: Iron and Manganese, in: Water Quality & treatment – a handbook of public water supplies, Chapter 11, McGraw Hill, New York, 378–396, 1971.
Oomen, J. H. C. M., de Moel, P. J.., and van Dijk, J. C.: Marmerfiltratie van ijzerhoudend grondwater , H2O, 16, 2, 40–44, 1983 (in Dutch).
Prince, R. A., Goulter, I., and Ryan, G.: What causes customers complaints about discoloured
5
drinking water? Correlating customer complaints with online monitoing of flow rate and tur-bidity, Water, 30(2), 62–67, 2003.
Robinson Jr., L. R. and Breland, E. D.: removal of iron & manganese from low alkalinity waters, Public Works, 59(2), 72–76, 1968.
Salvato, J. A.: Environmental engineering ans Sanitation, 4th Ed., John Wiley and Sons, 1992.
10
Sharma, S. K., Sebwato, C. Petrusevski, B., and Schippers, J. C.: Effect of groundwater quality
on adsorptive iron removal, J. Wat. Sup: Resch and Tech. – Aqua. 51.4, 51(4), 199–208, 2002.
Sharma, S. K.: Adsorptive iron removal from groundwater, PhD dissertation, Wageningen Uni-versity/IHE Delft, The Netherlands, 2001.
15
Smith, S. E., Bisset, A., Colbourne, J. S., Holt, D. M., and Lloyd, B. J.: The occurrence and significance of particles and deposits in a drinking water distribution system, Journal of the New England Water Works Association, 111(2), 135–150, 1997.
Søgaard, E. G., Medenwaldt, R., and Abraham-Peskir, J. V.: Conditions and rates of biotic and abiotic iron precipitation in selected Danish freshwater plants and microscopic analysis of
20
precipitate morphology, Water Res., 34(10), 2675–2682, 2000.
Verberk, J. Q. J. C., Hamilton, L. A., O’Halloran, K. J., Horst, W., and Vreeburg, J. H. G.: Analysis of particle numbers, size and composition in drinking water transportation pipelines: result of online measurements, Water Sci. Technol., 6(4), 35–43, 2006.
Vreeburg, J. H. G.: Discolouration in drinking water systems: a particular approach, PhD
dis-25
DWESD
1, 87–115, 2008Removal of dissolved and particulate iron
from groundwater
K. Teunissen et al.
Title Page
Abstract Introduction
Conclusions References
Tables Figures
◭ ◮
◭ ◮
Back Close
Full Screen / Esc
Printer-friendly Version
Interactive Discussion Table 1. Average raw water composition at treatment plant Harderbroek and (former) Vewin
recommendation of maximum values in clear water.
Parameter Unit Raw water (former) Vewin recommendation
Temperature ◦C 12.9 25
Acidity pH 7.47 7.8<pH<8.3
Saturation index SI −0.68 −0.2<SI<0.3
Conductivity mS/m 16.4 80
Bicarbonate mg/l 84.9 >60
Chloride mg/l 7.5 150
Sulphate mg/l 8.44 150
Sodium mg/l 6.39 120
Potassium mg/l 12
Calcium mg/l 25.8 150
Magnesium mg/l 2.07 50
Total hardness mmol/l 0.729 1.0<TH<2.5
Ammonium mg/l <0.040 0.05
Nitrite mg/l <0.0070 0.05
Nitrate mg/l <0.50 25
Iron mg/l 1.4 0.05
DWESD
1, 87–115, 2008Removal of dissolved and particulate iron
from groundwater
K. Teunissen et al.
Title Page
Abstract Introduction
Conclusions References
Tables Figures
◭ ◮
◭ ◮
Back Close
Full Screen / Esc
Printer-friendly Version
Interactive Discussion Table 2.Measurement scheme TILVS and particle counter through treatment plant.
Location Date TILVS Particle counter
Filtered volume [litre] Measured time [hour]
Raw water 06-03-07 91.85 60.4
Cascade effluent 20-02-07 19.2 40.7
Filter influent 20-02-07 19.2 82.6
Filter effluent (combined) 20-02-07 64 and 77.5 220.53
Aeration tower effluent 27-02-07 93.35 227.7
Clear water tank effluent 27-02-07 118.35 and 118.35 420.96
DWESD
1, 87–115, 2008Removal of dissolved and particulate iron
from groundwater
K. Teunissen et al.
Title Page
Abstract Introduction
Conclusions References
Tables Figures
◭ ◮
◭ ◮
Back Close
Full Screen / Esc
Printer-friendly Version
Interactive Discussion Table 3.Settings column experiments.
part # water source device settings
1 1a Cascade – τ=2 min
1b vessel τ=7 min V vessel=20 l
2a Cascade Vessel, stirrer τ=7 min Rpm: 500 G=1000 1/s
2b Vessel, stirrer τ=7 min Rpm: 900 G=1800 1/s
3a Raw and cascade Flow meters τ=2 min Raw: cascade=1:2
3b Flow meters τ=2 min Raw: cascade=1:1
4a Raw water Vessel, air pump τ=7 min RQ=0.5 Q air=200 l/h
4a Vessel, air pump τ=7 min RQ=1 Q air=400 l/h
2 5a Cascade NaOH pump τ=2 min pH=8.0
DWESD
1, 87–115, 2008Removal of dissolved and particulate iron
from groundwater
K. Teunissen et al.
Title Page
Abstract Introduction
Conclusions References
Tables Figures
◭ ◮
◭ ◮
Back Close
Full Screen / Esc
Printer-friendly Version
Interactive Discussion Table 4.Particle volume concentration in filter effluent during stable operation.
Particle size range (µm) Average particle concentration (#/ml) Average particle volume (ppb)
1–2 332 0.492
2–5 7.38 0.122
5–7 0.28 0.030
7–10 0.14 0.044
10–15 0.07 0.064
15–20 0.03 0.094
20–50 0.03 0.457
50–100 0.02 3.567
DWESD
1, 87–115, 2008Removal of dissolved and particulate iron
from groundwater
K. Teunissen et al.
Title Page
Abstract Introduction
Conclusions References
Tables Figures
◭ ◮
◭ ◮
Back Close
Full Screen / Esc
Printer-friendly Version
Interactive Discussion Table 5.Volume load during a peak and during stable operation.
Backwash Switch
Total time [h] 32 24
Peak 4 0.5
Stable 28 23.5
Average concentration [ppb]
Peak 19.9 19.4
Stable 3.44 2.62
Flow rate [m3/h] 235 250
Volume load [ml]
Peak 18.70 2.43
DWESD
1, 87–115, 2008Removal of dissolved and particulate iron
from groundwater
K. Teunissen et al.
Title Page
Abstract Introduction
Conclusions References
Tables Figures
◭ ◮
◭ ◮
Back Close
Full Screen / Esc
Printer-friendly Version
Interactive Discussion Table 6. Results for TILVS and particle counter throughout the treatment plant, during stable
operation.
Location TILVS Particle counter
Particle Particle Iron Average total Density concentration concentration concentration particle volume
[mg/l] [mass-ppb] [µg/l] [volume-ppb] [kg/m3]
Raw water 2.2×10⁻³ 2.2 2.6 0.145 15 170
Cascade effluent 1.03 1030 106 223.17 4620
Filter influent 1.07 1070 – 155.01 6900
Filter effluent 0.048 48 8.0 4.87 9860
Aeration tower effluent 0.036 36 7.8 21.56 1670
Clear water tank effluent 0.035 35 8.5 14.71 2380
DWESD
1, 87–115, 2008Removal of dissolved and particulate iron
from groundwater
K. Teunissen et al.
Title Page
Abstract Introduction
Conclusions References
Tables Figures
◭ ◮
◭ ◮
Back Close
Full Screen / Esc
Printer-friendly Version
Interactive Discussion
0 1 10 100 1000 10000
0:00 0:14 0:28 0:43 0:57 1:12 1:26 1:40 1:55 2:09
tim e [h:mm ]time [h:mm ]
0 1 10 100 1000 10000
0:00 0:14 0:28 0:43 0:57 1:12 1:26 1:40 1:55 2:09
tim e [h:mm ]time [h:mm ]
0 10 20 30 40 50
0:00 0:20 0:40 1:00 1:20 1:40 2:00
1 µm 1.5 µm 2 µm 5 µm 7 µm 10 µm 15 µm 20 µm total
0 10 20 30 40 50
0:00 0:20 0:40 1:00 1:20 1:40 2:00
1 µm 1.5 µm 2 µm 5 µm 7 µm 10 µm 15 µm 20 µm total
0 10 20 30 40 50
0:00 0:20 0:40 1:00 1:20 1:40 2:00
1 µm 1.5 µm 2 µm 5 µm 7 µm 10 µm 15 µm 20 µm total
ll
Fig. 1.Results from the particle counter in filter effluent after a switch of a filter:(a)number of
DWESD
1, 87–115, 2008Removal of dissolved and particulate iron
from groundwater
K. Teunissen et al.
Title Page Abstract Introduction Conclusions References Tables Figures ◭ ◮ ◭ ◮ Back Close
Full Screen / Esc
Printer-friendly Version Interactive Discussion 0 1 10 100 1000
0:00 4:48 9:36 14:24 19:12 0:00 4:48 9:36
n u m b e r o f p a rt ic le s p e r m l 0 1 10 100 1000
0:00 4:48 9:36 14:24 19:12 0:00 4:48 9:36
n u m b e r o f p a rt ic le s p e r m l 0 10 20 30 40 50
0 2 4 6 8 10 12 14 16 18 20 22 24 26 28 30 32 1 µm 2 µm 5 µm 7 µm 10 µm 15 µm 20 µm total
0 10 20 30 40 50
0 2 4 6 8 10 12 14 16 18 20 22 24 26 28 30 32 1 µm 2 µm 5 µm 7 µm 10 µm 15 µm 20 µm total
0 10 20 30 40 50
0 2 4 6 8 10 12 14 16 18 20 22 24 26 28 30 32 1 µm 2 µm 5 µm 7 µm 10 µm 15 µm 20 µm total
Fig. 2.Results from the particle counter in filter effluent after a backwash event:(a)number of
DWESD
1, 87–115, 2008Removal of dissolved and particulate iron
from groundwater
K. Teunissen et al.
Title Page
Abstract Introduction
Conclusions References
Tables Figures
◭ ◮
◭ ◮
Back Close
Full Screen / Esc
Printer-friendly Version
Interactive Discussion
DWESD
1, 87–115, 2008Removal of dissolved and particulate iron
from groundwater
K. Teunissen et al.
Title Page
Abstract Introduction
Conclusions References
Tables Figures
◭ ◮
◭ ◮
Back Close
Full Screen / Esc
Printer-friendly Version
Interactive Discussion
! ! "
! "
" ! ! "
! " "
# $ #
# #
0
00
00
00
00
0
00
00
00
00
0
00
00
00
00
Fig. 4.Iron(II) and iron (III) in aerated cascade effluent water measured during column experi-ments.
DWESD
1, 87–115, 2008Removal of dissolved and particulate iron
from groundwater
K. Teunissen et al.
Title Page
Abstract Introduction
Conclusions References
Tables Figures
◭ ◮
◭ ◮
Back Close
Full Screen / Esc
Printer-friendly Version
Interactive Discussion
0
0.5
1
1.5
0
100
200
300
400
Iron(II) Total iron
#
'
(
0
0.5
1
1.5
0
100
200
300
400
Iron(II) Total iron
0
0.5
1
1.5
0
100
200
300
400
Iron(II) Total iron
#
'
(
DWESD
1, 87–115, 2008Removal of dissolved and particulate iron
from groundwater
K. Teunissen et al.
Title Page Abstract Introduction Conclusions References Tables Figures ◭ ◮ ◭ ◮ Back Close
Full Screen / Esc
Printer-friendly Version Interactive Discussion 0 0,2 0,4 0,6 0,8 1 1,2 1,4 1,6 In fl u e n t R e fe re n c e E ff lu e n t E ff lu e n t R e fe re n c e R e fe re n c e In fl u e n t R e fe re n c e E ff lu e n t E ff lu e n t R e fe re n c e R e fe re n c e
NaOH dosage Crushed limestone
Ir o n c o n c e n tr a ti o n [ m g /l ] iron 3 iron 2