1 Correspondence Author, Assist.Prof. Gifted Education Division, Faculty of Education, Duzce University, Turkey, [email protected].
©Türk Üstün Zeka ve Eğitim Dergisi/Turkish Journal of Giftedness & Education
______________________________________________________
A Research on the Structure of
Intelligence and Creativity, and
Creativity Style
Zekâ ve Yaratıcılık ve Yaratıcılık
Stili Üzerine Bir Araştırma
Feyzullah Şahin
1Abstract
The relationship between intelligence and crea-tivity may be linked to the difficulties in defin-ing and measurdefin-ing methodology. Threshold theory is one of the theories which is used to explain the relationship between them. The aim of this study is to investigate the struc-tures which the creative thinking ability of the gifted students and their intellectual structure is grouped and the structure which their crea-tive thinking ability are alone. Data was gath-ered using Wechsler Intelligence Scale for Children-R and Torrance Thinking Creativity Test (TTCT). Confirmatory factor analyses were conducted with data from 278 gifted primary school students which contained the grade range of 1 to 3. The results indicate that the TTCT subscores consist of 2 factors called adaptive and innovative rather than a single factor. Besides, the results of the analyses pro-vide support that creativity and intelligence are independent from each other.
Key Words: intelligence, creativity, adaptive, innovative, gifted
Öz
Zekâ ve yaratıcılık arasındaki ilişki, tanım ve ölçme metodundan kaynaklanan sınırlılıklarla da ilişkilidir. Eşik teorisi iki kavram arasındaki ilişkiyi açıklamaya çalışan teorilerden birisidir. ”u çalışmanın amacı (st(n zekâlı ö≤rencilerin yaratıcı d(ş(nme becerileriyle birlikte zihinsel becerilerinin ve yaratıcı becerilerinin yalnız başına yapısını araştırmaktır. WISC-R ve Tor-rance Yaratıcı D(ş(nme Testleri kullanılarak veriler toplanmıştır. - . Sınıf (st(n zekâlı ö≤renciden elde edilen veriler (zerinde do≤ru-layıcı faktör analizi yapılmıştır. Sonuçlara göre TYDT alt testleri tek faktör yerine adaptif ve yenilikçilik olmak (zere iki faktör altında top-lanmıştır. “raştırma bulguları yaratıcılık ve zekânın birbirinden ba≤ımsız oldu≤una dair kanıtlar sunmaktadır.
Anahtar Kelimeler: zekâ, yaratıcılık, adaptif, yenilikçilik, (st(n zekâ
Introduction
The nature of the relationship between these two concepts is difficult to pinpoint because of multi-dimensional, complex, and inextricable nature of these two concepts. Broadly speak-ing, the nature of the relationship between intelligence and creativity was viewed from two different perspectives. One approach regarded creativity as a part of intelligence.
represents the intersection of three dimensions–operations, contents, and products. He origi-nally described divergent production as consisting of four specific abilities. These abilities include fluency, flexibility, originality, and elaboration. Contemporary researchers prefer the more explicit expression divergent thinking to describe what they meant by divergent production (Kaufman, Kaufman, & Lichtenberger, 2011).
Horn and Cattell (1966) did not separate the two concepts of creativity and intelligence and divided intelligence into crystallized intelligence (gC) and fluid intelligence (gF). It is com-mented that ideational fluency and associational fluency sometimes were treated as indica-tors of "creativity". Among the characteristics related to creativity, moreover, the structures of adaptive flexibility, flexibility of closure and writing flexibility are also in gF and gC.
Cat-tell-Horn’s gC and gFtheory has been combined with Caroll’s Three-Stratum Theory,
which is called the Cattell-Horn-Carroll (CHC) theory (Kim, Cramond, & Vantassel-Baska, 2010). In CHC, the abilities which are called originality, fluency and flexibility are listed un-der general intelligence.
Interestingly, Alfred Binet included open-ended tasks in the earliest tests of intelligence, which were the typical characteristic of divergent thinking tasks (Runco, 2007). This perspec-tive has been followed by multi-dimendional theories of intelligence, in which creativity was
a form of intelligence Sternberg, . Thurstone , as cited in 5zg(ven, criticized Spearman’s intelligent theory and assertioned that the intelligent behavior does not arise from a general factor, but rather emerges from seven independent factors that he called
pri-mary abilities. Thurstone's multiple factor model is the first theory which –partly- included
the abilities of creativity thinking as an independent factor. One of the seven factors in the theory is the word fluency. Word fluency measured ability of the test-taker to think of as many words as possible that begin with a given letter.
Renzulli was one of the first researchers to emphasize creativity in a testable theory of
gift-edness. Three Ring –Concept is listed among the regulators which play a role in the
trans-formation of the intellectual potential into high performance. In the aforementioned theory, the high performance may emerge under two different personality profiles such as academic
(schoolhouse type) or productive-creative gifted people Renzulli, . In the ”erlin
Intel-ligence Structure Model , creativity was considered as a group of processes that are taking
place while solving the cognitive tasks such as memory, processing capacity and processing
speed Stoeger, . In the Differentiated Model of Giftedness and Talent , the giftedness
Intelli-gence Theory provides an important theoretic transformation in broadening what might be regarded intelligent behavior and, in turn, has the opportunity to enlarge the definitions of creative giftedness (Kaufman, Kaufman, Beghetto, Burgess, & Persson, 2009).
The second approach viewed intelligence as a sub-component of creativity. According to this, intelligence is one of the factors that help creativity to emerge. Sternberg and Lubart (1991) put forward the theory of investment that positions intelligence as a vital variable that influences creativity. Both approaches seem to acknowledge that there is a relationship be-tween the two.
Relationship of Creativity and Intelligence
Threshold theory is one of the theories which is used to explain the relationship between creative and intelligence. According to this theory, they are related; but relationship between the two is not linear across different levels of intelligence (Jauk, Benedek, Dunst, & Neubau-er, 2013; Runco, 2007). This theory agrees with the assertion that they are separate constructs above a minimum level of IQ 120 (Kim, Cramond, & Vantassel-Baska, 2010).
The threshold theory were supported a group of studies (Cho, Nijenhuis, VanVianen, Kim, &
Lee, 2010; Fuchs-”eauchamp, Karnes, & Johnson, Şahin, . However, some other
study results did not support (Runco & Albert, 1986; Runco, Millar, Acar, & Cramond, 2010; Preckel, et al., 2006; Sligh, Conners, & Roskos-Ewoldsen, 2005). Also, in a meta-analytic study, using 21 studies with totally 45.880 participants, reported evidence that empirical findings do not support the threshold hypothesis, between measures of cognitive ability (de-signed to measure g) and measures of creativity and divergent thinking (Kim, 2005). Sligh and colleagues (2005) stated inverse this theory effect, underlining a larger correlation of intelligence and creativity in the high ability group.
Without threshold effects, other group studies investigated the relationship creativity and
intelligence. The most famous of them is the Wallach and Kogan’s study Silvia, . They
found that the creativity tests did not correlate with the intelligence tests (average r = .09). Silvia has reanalysis that data. Results revealed that relationship between creativity and in-telligence were found significantly and modestly level. In other study, Plucker (2010) has
reanalyzed the Torrance’s data from to . “verage IQ score for the participant was 121. Three models were established. Results implied creativity and intelligence may simply not be highly or even moderately correlated.
In different context hold a study; Batey, Furnham and Safiullina (2010) sought to examine the contribution of gF and gC in predicting three indices of creativity. Creativity index scores were found to be positively and significantly related to gF (r= .29), but not significantly gC (r= .10). In same study, Batey, Chamorro-Premuzic, and Furnham (2009) was investigated the
contribution of gF and IQ in predicting DT. DT fluency was significantly and positively
re-lated to the two measures of intelligence (gF r= .34, and IQ r= .43).
Especially, psychologists interested in the structure of intelligence have relied on factor anal-ysis. Spearman (1904) is one of the pioneer researchers who use this technique. In
Thur-stone’s multiple factor model, Horn and Catell’s gF and gC theory, Guilford’s SOI theory,
and Carroll’s hierarchical model of intelligence are pioneer intelligence theories developed
through using factor analysis technique. Except the basic studies mentioned above, there is a large literature which the factor analysis technique is used in order to understand the struc-ture of the intelligence/ ability. The studies related to factor analysis within the frame of
in-telligence theories will not be discussed anymore since they aren’t listed in the primary
ob-jectives of this study.
As stated above, the experimental researches which the question “re the creativity potential
and general intelligence the same or do they consist of different structures? are analyzed
through factor analysis technique are rather limited on the contrary to the rich literature on the field of threshold effect although there is a highly rich litereature on the relationships between creativity and intelligence. Wallbrown, Wallbrown, and Wherry (1975) investigated the construct validity of the Wallach-Kogan (W-K) Creativity Test through a hierarchical factor analysis of inter-correlations among intelligence, creativity, and the other variables. The intelligence domain was assessed by WISC-R test. Results indicated that a high degree of
separation was evident between the intelligence and creativity domain. According to W-K’s
assertion, their creativity may assess the discriminating validity of g.
Creativity Style: Adaptation-innovation
When the studies on the creativity are chronologically analyzed, the question of "To what degree is this person creative?" is investigated in the beginning while the current studies
fo-cus on the question "How are you creative? The objective of the level access to investigate creativity was to estimate the capability or traits of creative ability. The spotlight of this sec-ond question is related to the manner, form, or style of the creative behavior (or perfor-mance). Style means the inclinations or peculiarities which denote a steady manner or way of showing creativity (Isaksen & Puccio, 1988).
Kirton (2011), explain the adaptors and innovators style:
struc-ture. However, all brains need such structures or they cannot operate… Many structures are required, e.g., the preferred style with which we solve problems, the content of our memory, and our array of skills. Other vital guidelines that are built up by learning are our attitudes and beliefs… Adaptors and innovators do so differently. ….One way summing up these differ-ences is to say that the more adaptive prefer to solve problems by the use of rules (all cognitive structures) and the more innovative do so despite the rules (pg.4).
The studies were designed especially to test the style/ level distinction, also support the con-ceptualization of the KAI continuum as a style dimension. In an early study, Kirton (1978, as cited in Isaksen & Puccio, 1988) investigated the tie between the inventory and the Word Fluency measure of the Primary Mental Abilities Battery, the Utilities and Alternate Uses Tests, the Otis (Higher Form A) intelligence test and an English qualifying examination. The correlations between his style of measuring and the levels of those measurements were found to be weak and nonsignificant. Torrance and Yun Horng (1980) studied the relation-ship between Kirton's measure and a battery of creative level measures. There were convinc-ing interrelationships between Kirton's measure and a number of these level measures.
It was concluded after the analytic studies with several factors that creativity is one magni-tude within divergent thinking tests (Proctor & Burnett, 2004; Runco, Plucker, & Lim, 2002– 2001; Ayas & Sak, 2014), which are the most commonly used to estimate the creative poten-tial. Clapham (1998, 2004) investigated factor structure on the TTCT. He inferred that the
scores of the TTCT primarily reflected one general factor. However, “zevedo’s , as cited in Primi, Nakado, Morais, “lmeida, & David, study results’ has revealed two factors, the first consisting of fluency, originality, and resistance to premature closure, and the sec-ond of creative strength, title abstraction and elaboration, in the Portugal sample. Recently, a two-factor model of creativity, especially based on KAI, has been found to be a better fit than are one dimensional models (e.g. Kim, 2006; Kim, Cramond, & Bandalos, 2006; Krumm, Lemos, & Filippetti, 2014).
Kim, Cramond, and Bandalos (2006) analyzed the underlying structure of TTCT figural forms as a model of creative functioning. In the study, it was nominated that a model with Innovative factor and Adaptive factor would perfectly fit for the entire sample. According to this model, Innovative involved Fluency and Originality; Adaptive involved Elaboration and Abstractness of Titles; and both factors were in relation to Resistance to Premature Closure.
In a similar study by Kim (2006), two-factor structure was tested. TTCT–Figural Form A was
used. Results indicate that the innovative factor is loaded by fluency, originality, and re-sistance to premature closure, whereas the adaptive factor is loaded by elaboration, abstract-ness of titles, and creative strengths.
were confirmed. Results showed that the innovative factor contained the fluency and origi-nality and the adaptive factor was contained the elaboration, abstractness of titles, and re-sistance to premature closure abilities. However, Isaksen and Puccio (1988) suggested that the distinction between creative style and creative level as measured by the TTCT might not be as clear as asserted by Kirton. They found that innovators were statistically and signifi-cantly more fluent and more original.
Anecdotally, the educated participants of the TTCT have noticed that there are two types of people. One type was people who produced instant and peculiar feedbacks and had better scores on fluency and originality; the other type was people who were thinking in detailed and profoundly and did better on elaboration and abstractness of titles (Kim, Cramond, & Bandalos, 2006; Kim, 2006).
The studies which were summarized above and which the creativity styles of the individuals were analyzed are the researches sustained with the general population. According to Shiy-ko, Rim and Grimm (2012); the researcher specifies some model with the assumption that different subgroups in the sample will have different parameter values such as heterogenei-ty. Heterogeneity is often present in empirical studies, researchers should always consider potential sources of heterogeneity. In many instances, the researcher may not even be aware of the fact that heterogeneity is causing estimation problems. In this case, researchers need to apply approaches that identify and treat unobserved heterogeneity in the samples (Hair, Hult, Ringle, & Sarstedt, 2014). Therefore, it is recommended that all new models should be examined and validated in a broad sample prior to any subgroup comparisons (Bryne, 2010). In one of their research on creativity; Kaufman, Cole, and Baer (2009), also stated that the subgroups consisting gifted students might mask the general results. Moreover, the studies which analyze the topic of threshold effect present contradictory results.
When the studies mentioned above are reviewed in this sense, no research was obtained re-lated to revealing the fact that whether the creative thinking capabilities of the gifted indi-viduals in the literature are listed under a single factor or more than one factors. When the structures which the intelligence and creative thinking capabilities are grouped are analyzed, a single research was obtained. In the aforementioned research, the average intelligence was sustained with individuals. From this point of view, it was decided to conduct this study. The general purpose of the research is to determine structures which the creative thinking capabilities of the gifted students and their intellectual structure is grouped and the struc-tures which their creative thinking capabilities are solely grouped. Within the frame of this general purpose, the answers will be sought for the following questions:
1. Under which structures do the TTCT subscores of the gifted students appear?
2. Under which structures do the TTCT subscores of the gifted students and the WISC-R
Method
Study Group
For this study, Istanbul “vcılar District Directorate of Education maintained a project, fund-ed by the Istanbul Development Agency, partial data in order to identification students was used. Data were collected with convenience sampling method and obtained through the
“vcılar Province. 78 primary school students which included grade range of 1 to 3 (age range from 6:00 to 9:60; 76 of students 6:00 to 7:00, 71 of students 7:00 to 8:00, 103 of students 8:00 to 9:00, 28 of students of 9:00-9:60) were applied intelligence and creativity test. The
in-telligence score of the students was determined as + standard deviation (IQ score of 115 and above). 89 of the students who are identified as gifted were in the first grade (Female= 33, Male= 56), 83 of them were in second grade (Female= 30, Male= 53), and 106 of them were in the third grade (Female= 38, Male= 68).
Data Collection Tools
Wechsler Intelligence Scale for Children-Revised (WISC-R).
WISC-R wasde-veloped, based on the concept of one-dimensional intelligence is a measurement tool. It is used to determine level of students' intelligence. It was developed by Wechsler in 1949 and was revised in 1974. IQ and factor Index scores yield standard scores with a mean of 100 and
a standard deviation of 5zg(ven, . The test was adapted to Turkish by Savaşır and Şahin , as cited in Tan, Soysal, “ldemir, & Işık, for -16 age group. Two half-test reliability was calculated as .97 for total intelligence section. Correlation between sub-tests was between .51 and .86. In this study, Guttman split-half coefficient is .93 total scale.
The threshold cut-off point may be assessed differently in the studies which giftedness is described according to the psychometric approach. In this study, the students having the
standard deviation values of + were regarded as gifted ones inspiring the classifying sys-tem of Silverman (1998).
Torrance Thinking Creativity Test (TTCT).
One of those is the most widely usedTTCT among to developed for measuring the divergent thinking (Kim, Cramond, & Banda-los, 2006; Runco & Acar, 2012). The TTCT is based on Guilford’s SOI concept. The TTCT -Figural consists of three activities: Picture construction, picture completion, and repeated
figures of lines or circles. Students’ performance in creative thinking was measured using the
TTCT, figural forms (Kim, Cramond, & Bandalos, 2006). The post-1984 version of the test consists of five norm-referenced subscales: Fluency, originality, elaboration, abstractness of the titles and resistance to premature closure. They are derived from the same response data.
potential according to the variables such as gender, race, socio-cultural and educational fac-tors (Cramond, 1993, as cited in Kim, Cramond, & Bandalos, 2006). Considering this result, the grade norms of United States of America, where the test was first developed, has been used in this study. Grade level (from 1 to 3) KR-21 reliability scores are computed as .87, .86 and .87, respectively (Torrance, 2008). In this study, Guttman split-half coefficient is .72 total scale.
Data Analysis
Confirmatory Factor Analysis (CFA) were conducted to test the fit of several factor models
including one, two and, three-factor models using the LISREL program Jöreskog & Sörbom,
1993), because of the technique of CFA analyzes a priori measurement models in which both the number of factors and their correspondence with the indicators are explicitly specified (Kline, 2011).
According to Myers, Ahn and Jing (2011), 300 or more subjects were considered enough in society-based studies in order to execute CFA. The number of the participants (n= 278) in this study was considered enough to execute analysis. The values of univariate skewness and kurtosis were examined to see whether each variable was approximately normally distribut-ed. In the analyses, Robust Maximum Likelihood was applied, because of values of the skewness and kurtosis were greater than |2.0|.
In order to interpret the fit of each model, I followed the suggested indexes of Kline (2011). This included reporting goodness of fit index (GFI), comparative fit index (CFI), root mean square error of approximation (RMSEA) or standardized root mean square residual (SRMR). The consistency (Parsimonious) is regarded as a criteria for choosing among the alternative models. The Parsimony Goodness-of-Fit Index (PGFI), the Akaike Information Criterion (AIC), the Consistent AIC (CAIC) and Expected Cross-Validation Index (ECVI) are the measures related to the consistency of the models used in the assessment of consistency (Hooper, Coughlan, & Mullen, 2008). Although both PGFI and PNFI take values between
zero and one, higher values show better consistency. To be known as information criteria
the AIC, CAIC, and ECVI indices are the indicators which are used in the comparison of more than one models, the low levels of those three indicators mean better consistency, on
Results
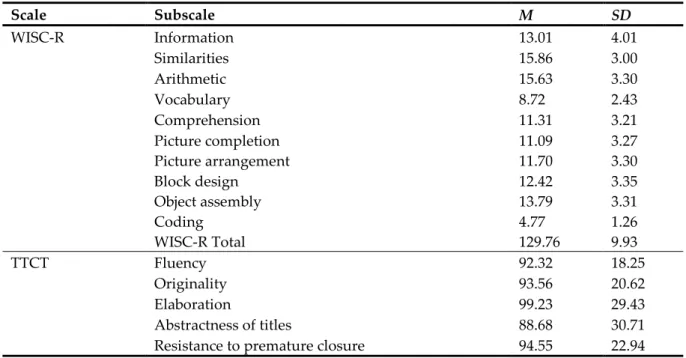
The values of the mean and standard deviation of the TTCT and WISC-R subscales are re-ported in Table 1.
Table 1. Descriptive Statistics
Scale Subscale M SD
WISC-R Information 13.01 4.01
Similarities 15.86 3.00
Arithmetic 15.63 3.30
Vocabulary 8.72 2.43
Comprehension 11.31 3.21
Picture completion 11.09 3.27
Picture arrangement 11.70 3.30
Block design 12.42 3.35
Object assembly 13.79 3.31
Coding 4.77 1.26
WISC-R Total 129.76 9.93
TTCT Fluency 92.32 18.25
Originality 93.56 20.62
Elaboration 99.23 29.43
Abstractness of titles 88.68 30.71
Resistance to premature closure 94.55 22.94
The values of the mean and standard deviation of the TTCT and WISC-R subscales are re-ported in Table 1. WISC-R consists of 10 sub-scores which its mean varied between
. ± . and . ± . . Total score is . ± . . TTCT consists of items that vary be-tween . ± . and . ± . .
Under which Structures do the TTCT Subscores of the Gifted Students Appear?
Within the scope of the first question of the research, two different models were established. In the first of the models, the single factor structure of TTCT subscores was analyzed. In the other model, the two-factor model which was developed being inspired from KAI creativity style was established. Fit indexes for the one- and, two- factor models are shown in Table 2. In the analysis, standardized CFA values were analyzed.
Table 2. Results of Model Comparison with One, Two, and Three Factors
Models χ² df χ²/df GFI CFI RMSEA SRMR
Model 1 10.25* 5 2.05 .99 .99 .06 .02
Model 2 5.11* 4 1.28 .99 1.00 .03 .02
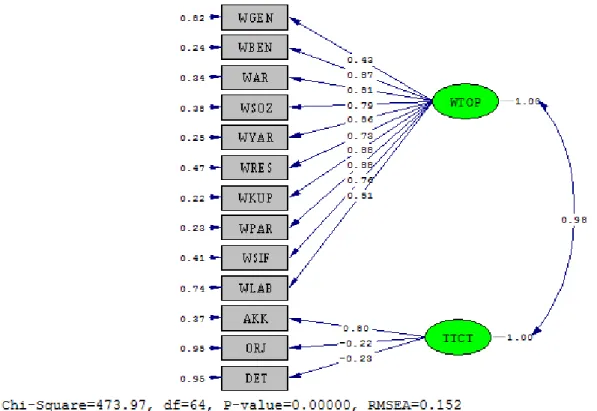
Model 3 473.97** 64 7.41 .79 .93 .15 .09
Model 4 503.12** 87 5.78 .81 .93 .13 .14
Criteria . good Kline,
2011),
. poor coherence
(Hooper, Coughlan, & Mullen, 2008)
. good, . < poor
coher-ence (Hooper, Coughlan, & Mullen, 2008; Hu & Bent-ler, 1999)
. perfect,
. good Hu
& Bentler, 1999)
. good Hu
& Bentler, 1999)
. poor coherence (Kline, 2011)
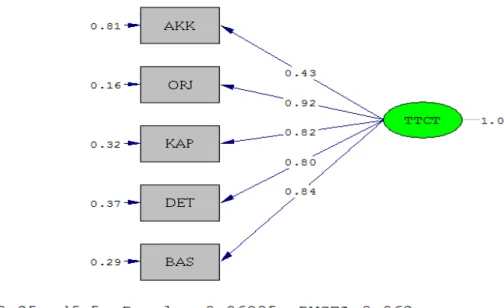
The χ²/df values of the Model and Model 2 were found as 2.05 and 1.28. It is indicated that both models are a good fit index. GFI and CFI values posited also a good coherence. Both of the SRMR values were seen to be a good fit index, too. The RMSEA values of the Model 1was found as .06, this indicates a perfect coherence, but Model 2 estimatedgood coherence. As can seen Figure 2; Model 2 results posited that innovative factor is loaded by fluency, origi-nality, and, elaboration, however the adaptive factor is loaded by abstractness of titles, and resistance to premature closure. But, the results of Model 1 include all subscores. According to values of goodness of fit index, the Model 2 fit to seen better than Model 1. Both of two models were further analyzed by examining values of parsimonious fit index.
Figure 1. Model 1. Titles, AKK= Fluency, ORJ= Originality, KAP= Resistance to premature closure, DET= Elaboration, BAS= Abstractness of titles.
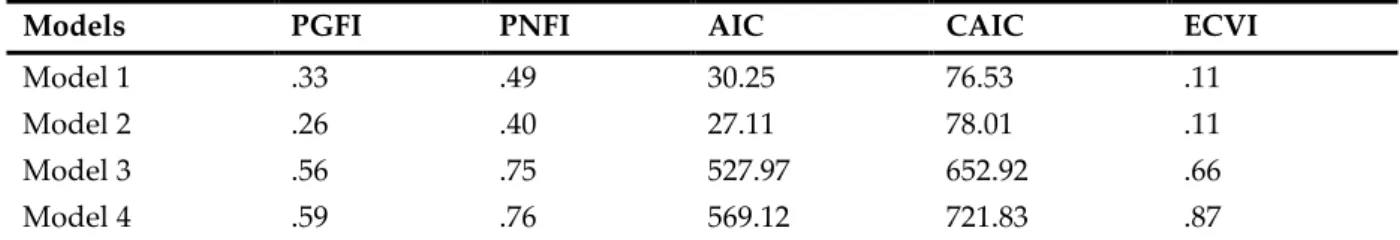
Table 3. Values of Parsimonious Fit Index.
Models PGFI PNFI AIC CAIC ECVI
Model 1 .33 .49 30.25 76.53 .11
Model 2 .26 .40 27.11 78.01 .11
Model 3 .56 .75 527.97 652.92 .66
Model 4 .59 .76 569.12 721.83 .87
PGFI, PNFI, ACI, CAIC and ECVI values of the Model 1 and Model 2 are .33 and .26; .49 and .40; 30.25 and 27.11; 76.53 and 78.01; .11 and .11, respectively. According to values of PGFI, PNFI, and CAIC it is indicated that Model 1 fit to seen better than Model 2. However, AIC showed contrary of that. ECVI value indicated that both of two model is seen the same. Model 1 and 2 were also investigated by examining parameter estimates. In the other hand, low R2 values suggested contrary (Kline, 2011). While fluency R2 value was found as .19, the
other subscores values were .60 and above.
Under which Structures do the TTCT Subscores and WISC-R Subscale Scores of
the Gifted Students Appear?
In order to determine the structures which intelligence and the capacities of creative thinking appear, two different models were established within the frame of the first question of the research. The whole WISC-R IV subscale scores and TTCT subscores were analyzed within
the structure of single factor. However, the established factor didn’t function. Then, the two -factor structure was tested. In the two--factor structure, the t values of elaboration and
re-sistance to premature closure wasn’t found significant in the model. The aforementioned subdimensions were respectively excluded from the model and the analyses were repeated. In conclusion, the two-factor structure which was projected in Figure 3 was obtained.
Fit indexes for the two- and, three- factor models are shown in Table 2. As can seen Figure 3,
Model 3results pointed that the WISC-R factor, called WTOP, is loaded by information,
Figure 3. Model 3. Titles, WGEN= Information, WBEN= Similarities, WAR= Arithmetic, WSOZ= Vo-cabulary, WYAR= Comprehension, WRES=Picture completion, WKUP=Block design, WPAR=Picture
ar-rangement, WSIF= Coding, WLAB=Object assembly, AKK= Fluency, ORJ= Originality, DET= Elaboration.
Figure 4. Model 4. Titles, WGEN= Information, WBEN= Similarities, WAR= Arithmetic, WSOZ= Vocabulary, WYAR= Comprehension, WRES=Picture completion, WKUP=Block design, WPAR=Picture arrangement, WSIF= Coding, WLAB=Object assembly, AKK= Fluency, ORJ= Originality, KAP= Resistance to premature
Discussion
The overall objective of this study is to examine the structure of intelligence – creativity and creativity at the latent variable. For the first problem statement, I inspired the Wallbrown,
Wallbrown, and Wherry’ study and in the second by Kim , Kim and colleagues
(2006), Krumm and colleagues (2014) were inspired.
Under which Structures do the TTCT Subscores of the Gifted Students Appear?
It can be seen that the chi-square values and good fit index suggested that the proposed
Model 2 in this study was a much better fit than Model 1. Figure 2 illustrated two – factor
model. Results indicate that the innovative factor is loaded by fluency, originality, and elabo-ration, whereas the adaptive factor is loaded by and abstractness of titles, and resistance to premature closure. Parsimonious index supported it. Also, the large values of the factor load-ings and large indicated that the subscales were a good measure of their factors (Kline, 2011). He points out that fluency subscale is not as highly related to the innovative factor as the
other subscales loaded on that factor while other sub-factors could measure the R2 value
fac-tors well.
The emerge of TTCT sub-scores within a two-factor structure is parallel with Krumm, Lemos, and Filippetti (2014), Kim (2006), Kim, Cramond, and Bandalos (2006), and Azevedo (2007, as cited in Primi, et al., 2013) studies results’. However, they were a bit more different than this study results. In the studies of Kim (2006) and Kim, Cramond, and Bandalos (2006), it appeared that resistance to premature closure was related to both adaptive and innovative factors. In the study of Krumm, Lemos, and Filippetti (2014), fluency and originality was loaded by innovative, whereas the other subscores was loaded by adaptive. Additionally, Azevedo (2007, as cited in Primi, et al., 2013) found that a two-factor structure emerged from the TTCT subscores that occurs at the end of the study. The aforementioned studies are par-allel with the emerging of TTCT scores within a two-factor structures. Another similarity is that the fluency and originality appeared within a continuous factor while the abstractness of titles emerged within another continuous factor. It was seen that the other factors may emerge within different factors in different studies.
In addition to these findings, the emerging of TTCT sub-scores within a two-factor structure is inconsistent with theoretical literature on the TTCT in that Torrance (2008) suggested five different factors, and TTCT is not unidimensional, as proposed by Clapham (1998, 2004). The results of CFA showed that the two-factor model proposed in this study had a much better fit than the one general factor model. The findings of this study endorsed the observations of the test scorers (Kim, Cramond, & Bandalos, 2006; Kim, 2006), theoretically interpretation of
Kirton’s and several studies results’ e.g., Isaksen & Puccio, Kim, Cramond, &
Bandalos, 2006; Kim, 2006; Krumm, Lemos, & Filippetti, 2014; Torrance & Horng, 1980).
Under which Structures do the TTCT Subscores and WISC-R Subscale Scores of
the Gifted Students Appear?
In order to determine the structures which TTCT subscores and WISC-R subscale scores of the gifted student exist, all the scores were tested in a single-factor. CFA parameters pointed
out that the structure didn’t function. There may be a few basic causes. First of them may be
the result of focusing of the intelligence tests in order to measure the g through TTCT
follow-ing the SOI model developed by Guilford on different thinkfollow-ing abilities (convergent –
diver-gent thinking).
Wallbrown, Wallbrown, and Wherry (1975) postulated that the creativity domain included a general creativity factor but bifurcated at the primary level to a visual creativity and a verbal creativity factor. In another study which the creativity is analyzed focusing on the field, sev-en differsev-ent structures were observed (Kaufman, Cole, & Baer, 2009). Also, a low level of relationship was observed between TTCT verbal and figural tests (Cramond, Matthews-Morgan, Zuo, & Bandalos, 2005). These results may indicate another reason for not support-ing a ssupport-ingle-factor structure in this study. Because, there is a measurement in WISC-R IV which includes the fields such as general knowledge and language competencies while only figural field is measured in TTCT Figural form.
Upon not supporting the single-factor structure, two different models containing two and three factors were established. The chi-square value and good fit index suggested that Model 4 (in Figure 4) is fitter than Model 3 (in Figure 3). Additionally, model 4 values indicated that elaboration R2 values were highly related to adaptive factor, whereas similarities, arithmetic,
vocabulary, comprehension, picture completion, picture arrangement, block design and
ob-ject assembly of WISC-R subscales R2 values were highly related to WTOP factor.
possible that two variables can indicate no correlation if they have a curvilinear relationship (Schucmacker & Lomax, 2010). On the contrary, higher correlations between two factors in-dicate the overlapping of the structures.
In the study which the intelligence and creativity is factorially analyzed, the findings show-ing that both structures are independent of each other were obtained (Wallbrown, et al., 2007). Those results are consistent with the findings of this research. When those results are considered together, it can be said that Model 4 supports the results of the studies reporting the intelligence and creative thinking ability are different structures.
In summary, the findings of this study points out that information related to the strong and weak aspects of the creativity potentials of the gifted individuals depending on the TTCT results as well as their creativity styles. Moreover, the point of view in the contemporary intelligence theories which creativity is regarded as an ability independent from intelligence was supported at the end of this study conducted with gifted students.
The researchers who feel interested in the topic may analyze whether the creativity styles of the individuals differ among the individuals who are ranked different intelligence levels. Moreover, this study was conducted in Turkey. Similar studies to be executed in different cultures may provide opportunity to make comparison(s) between the cultures. Another research topic is the instruments which may provide limited measurements in the fields the item pool of tests may enable. In this research, the WISC-R was employed as the intelligence test and the TTCT was used as the creativity test. Being able to conduct the researches which different test batteries are used will provide obtaining more detailed information related to the structures of intelligence and creativity.
Limitations
There is some limitedness in this study. The first of them is that the general intelligence and the creativity potential (divergent thinking) of the individuals were limited. The other limit-edness is related to the methodologies used in the studies which the relationship between the creativity and intelligence is analyzed. Both in the correlation analyses and in the studies which factor analysis technique and correlation analysis are employed, the linear relation-ships between the compared characteristic and the group of characteristics are measured.
The synergy ? or the vice versa ? between the aforementioned characteristics can’t be measured. In other words, it can’t be measured whether the structures which may emerge depending on dense interaction between both structures, namely, depending on the occasion of different problems act dependently or under each other.
Acknowledgments:
The author would like to thank Dilek Ş“HİN for her help withReferences
Ayas, B., & Sak, U. (2014). Objective measure of scientific creativity: Psychometric validity of the creative scientific ability test. Thinking Skills and Creativity, 13, 195-205, Doi:10.1016/j.tsc.2014.06.001.
Batey, M., & Furnham, A. (2006). Creativity, intelligence, and personality: A critical review of the scatter literature. Genetic, social and general psychology monographs, 132(4), 355-429. Batey, M., Chamorro-Premuzic, T., & Furnham, A. (2009). Intelligence and personality as
predictors of divergent thinking: The role of general, fluid and crystallised intelligence. Thinking Skills and Creativity, 4, 60-69, Doi:10.1016/j.tsc.2009.01.002.
Batey, M., Furnham, A., & Safiullina, X. (2010). Intelligence, general knowledge and person-ality as predictors of creativity. Learning and Individual Differences, 20, 532-535, Doi:10.1016/j.lindif.2010.04.008.
Bryne, B. M. (2010). Structural equation modeling with AMOS: Basic concepts, applications, and programming (2nd edt.), New York: Routledge Taylor and Francis Group.
Carroll, J. B. (1993). Human cognitive abilities: A survey of factor-analytic studies. New York: Cambridge University press.
Cho, S. H., Nijenhuis, J. T., VanVianen, A. E., Kim, H. B., & Lee, K. H. (2010). The relationship
between diverse components of intelligence and creativity. The Journal of Creative
Behav-iour, 44, 125-137.
Clapham, M. M. (1998). Structure of the figural forms A and B of the Torrance Tests of Crea-tive Thinking. Educational and Psychological Measurement, 58, 275-283.
Clapham, M. M. (2004). The convergent validity of the Torrance Tests of Creative Thinking and Creativity Interest Inventories. Educational and Psychological Measurement, 64, 828-841.
Cramond, B., Matthews-Morgan, J., Zuo, L. & Bandalos, D. (2005). A report on the 40-year follow-up of the torrance tests of creative thinking: Alive and well in the new millen-nium. Gifted Child Quarterly, 49(4), 283-292.
Fuchs-Beauchamp K. D., Karnes, M. B., & Johnson, L. J. (1993). Creativity and intelligence in preschoolers. Gifted Child Quarterly, 37, 113-117.
Gagne, F., (2005). From gifts to talents the DMGT as a developmental model, In Sternberg, R., J., Davidson, J., E., (Eds), Conceptions of giftedness (2nd edt. pg. 98-119), Cambridge:
Cambridge University Press.
Gardner, H. (1995). Reflections on multiple intelligences: Myths and messages. Phi Delta
Kap-pan, 77(3), 200–203, 206–209.
Hair, J. F., Hult, G. T. M., Ringle, C. M., & Sarstedt, M. (2014). A primer on partial least squares structural equation modeling (PLS-SEM). Thousand Oaks, California: Sage publishing. Hamivand, L., (2012). A comparative study of creativity and intelligence of students in
Wechsler Intelligence Scale and children’s apperception test. Journal of American Scienc-es, 8, 184-188.
Heller, K. H., Perleth, C., & Lim, T. K. (2005). The Munich model of giftedness designed to identify and promote gifted students, In Sternberg, R., J., Davidson, J., E., (Ed) Concep-tions of giftedness (2nd edt. pg.327-342), Cambridge: Cambridge University Press.
Hooper, D., Coughlan, J., Mullen, M. (2008): Structural equation modelling: Guidelines for determining model fit. Electronic Journal of Business Research Methods, 6(1), 53-60.
Hu, L., & Bentler, P. M. (1999). Cutoff criteria for fit indexes in covariance structure analysis:
Conventional criteria versus new alternatives, Structural Equation Modeling: A
Multidis-ciplinary Journal,6(1), 1-55, Doi: 10.1080/10705519909540118.
Isaksen, S. G., & Puccio, G. J. (1988). Adaptation – innovation and the Torrance Tests of Crea-tive Thinking: The level style – issue revisited. Psychological Reports, 63, 659-670.
Jauk, E., Benedek, M., Dunst, B., & Neubauer, A. C. (2013). The relationship between intelli-gence and creativity: New support for the threshold hypothesis by mean of empirical breakpoints detection. Intelligence, 41(4), 212-221.
Jöreskop, K. G., & Sörbom, D. . LISREL 8: Structural equation modeling with the SIMPLIS command language. Uppsala University: Scientific Software International.
Kaufman, J. C., Cole, J. C., & Baer, J. (2009). The construct of creativity: Structural model for
self-reported creativity ratings. Journal of Creative Behavior, 43(2), 119-123,
Doi: 10.1002/j.2162-6057.2009.tb01310.x.
Kaufman, J. C., Kaufman, S. B., & Lichtenberg, E. O. (2011). Finding creative potential on intelligence tests via divergent production, Canadian Journal of School Psychology, 26(2) 83– 106, Doi: 10.1177/0829573511406511.
Kaufman, J. C., Kaufman, S. B., Burgess, S. A., Beghetto, R. A., & Persson, R. (2009). Creative giftedness: Beginnings, developments, and future promises. In L. Shavinia (Ed.), Handbook of giftedness (pg. 585-598). Mahwah, NJ: Lawrence Erlbaum.
Kim, K. H. (2005). Can only intelligent people be creative? A meta-analysis, Journal of
Second-ary Gifted Education, 16, 57-66.
Kim, K. H. (2006). Is Creativity unidimensional or multidimensional? analyses of the Torran-ce Tests Of Creative Thinking, Creativity Research Journal 18(3), 251–259.
Kim, K. H. (2009). Factor analyses creativity, In Kerr, B. (Ed) Encyclopedia of giftedness, creativi-ty and talent (Vol.1), (pg.347-350), California: Sage publishing.
Kim, K. H., Cramond, B., & Bandalos, L.D. (2006). The latent structure and measurement
ınvariance of scores on the torrance tests of creative thinking-figural. Educational and Psychological Measurement, 66, 459-477.
Kim, K. H., Cramond, B., & VanTassel-Baska, J. (2010). The relationship between creativity and intelligence. In J. C. Kaufman, & R. J. Sternberg (Eds.). Handbook of creativity (pg.395-412). Cambridge: Cambridge University Press.
Kirton, M. J. (2011). Adaption–innovation: In the context of diversity and change (reprint). NewYork: Routledge.
Kline, R. B. (2011). Principles and practice of structural equation modeling (3rd edt.), NewYork:
Guilford Press.
Krumm, G., Lemos, V., & Filippetti, V. A. (2014). Factor structure of the Torrance Tests of Creative Thinking Figural Form B in Spanish-speaking children: Measurement
invari-ance across gender. Creativity Research Journal, 26(1), 72-81,
Doi:10.1080/10400419.2013.843908.
Myers, N. D., Ahn, S., & Jin, Y. (2011). Sample size and power estimates for a confirmatory
factor analytic model in exercise and sport: A monte carlo approach. Research Quarterly
for Exercise and Sport,82(3), 412-423.
5zg(ven, İ. E. . Psikolojik testler (Psychological tests), Ankara: Sistem publishing.
Primi, R., Nakano, T. C., Morais, M. F., Almeida, L. S., & David, A. P. M. (2013). Factorial
structure analysis of the Torrance Test with Portuguese students “nálise da estrutura
Plucker, J. A. (2010). Is the proof in the pudding? Reanalyses of Torrance's (1958 to Present)
longitudinal data, Creativity Research Journal, 12(2), 103-114, Doi:
10.1207/s15326934crj1202_3.
Preckel, F., Holling, H., & Wiese, M. (2006). Relationship of intelligence and creativity in
gift-ed and non-giftgift-ed students: An investigation of threshold theory. Personality and
Indi-vidual Differences, 40, 159-170, Doi: 10.1080/10400410409534553.
Proctor, R. M. J., & Burnett, P. C. (2004). Measuring cognitive and dispositional characteris-tics of creativity in elementary students. Creativity Research Journal, 16(4), 421–429. Renzulli, J. S. (2005). The three-ring conception of giftedness: A developmental model for
promoting creative productivity, In Sternberg, R. J., Davidson, J. E., (Ed) Conceptions of giftedness (2nd ed. pg.246-279), Cambridge: Cambridge University Press.
Richmond, B. O. (1966). Creativity in monozygotic and dyzygotic' twins. ERIC Number: ED109580, University of Georgia.
Runco, M. A. (2007). Creativity theories and themes: Research, development, and practice. NewYork: Elsevier Academic Press.
Runco, M. A., & Acar, S. (2012). Divergent thinking as an indicator of creative potential, Crea-tive Research Journal, 24, 66-75.
Runco, M. A., & Albert, R. S. (1986). The threshold theory regarding creativity and intelli-gence: An empirical test with gifted and nongifted children, The Creative Child and Adult Quarterly, 11, 212-218.
Runco, M. A., Millar, G., Acar, S., & Cramond, B. (2010). Torrance tests of creative thinking as
predictors of personal and public achievement: A fifty-year follow- up, Creativity
Rese-arch Journal, 22(4), 361-368, Doi: 10.1080/10400419.2010.523393.
Runco, M. A., Plucker, J. A., & Lim, W. (2001). Development and psychometric integrity of a measure of ideational behavior, Creativity Research Journal, 13(3-4), 393–400, Doi: 10.1207/S15326934CRJ1334_16.
Schumacker, R. E., & Lomax, R. G. (2010). A beginner’s guide to structural equation modeling (3 edt.), NewYork: Routledge publishing.
Silverman, L. K. (1998). The highly gifted, In Vantassel-Baska, J., (Ed), Excellence in educating gifted and talented learners, (3rd edt., pg.115-128), Colorado: Love Publishing.
Silvia, P. L. (2008). Creativity and intelligence revisited: A latent variable analysis of Wallach
and Kogan (1965), Creativity Research Journal, 20(1), 34–39, Doi:
10.1080/10400410701841807
Shiyko, M. P., Ram, N., & Grimm, K. J. (2012). An overview of growth mixture modeling a simple nonlinear application in openmx. In Hoyle, R. H. (Eds.) Handbook of structural equation modeling, (pg.532-546), New York: Guilford Press.
Sligh, A. C., Conners, F. A., & Roskos-Ewoldsen, B. (2005). Relation of creativity to fluid and crystallized intelligence. Journal of Creative Behavior, 39, 123-136, Doi: 10.1002/j.2162-6057.2005.tb01254.x
Spearman, C. (1904). General intelligence. Objectively determined and mesaured. The
Ameri-can Journal of Psychology,15, 201-292.
Sternberg, R. J. (2005). The WICS model of giftedness, In Sternberg, R., J., (Eds), Definitions and conceptions of giftedness, (2nd ed.,pg.327-342), California: Sage Publication.
Sternberg, R. J., Jarvin, L., & Grigorenko, E. L. (2011). Explorations in giftedness, NewYork: Cambridge University Press.
Sternberg, R. J., & Lubart, T. I. (1991). An investment theory of creativity and its
Stoeger, H. (2009). The history of giftedness research, In Shavinina, L. V., (Eds), International handbook on giftedness, (pg.17-38), Pergemon Publication, Doi: 10.1007/978-1-4020-6162-2.
Şahin, F. . Yaratıcılık-zekâ ilişkisi yeni kanıtlar Relationship of creativity and
intelli-gence: New evidence). Elementary Education Online, 13(3), 1516-1530, Doi:
10.17051/io.2014.02374.
Tan, S., Soysal, Ş., “ldemir, S., & Işık, ”. . Üst(n zeka d(zeyindeki bir grup ö≤rencinin
WISC-R profillerinin incelenmesi (A group of students at the level of gifted investiga-tion of WISC-R profiles). Yeni Tıp Dergisi,29, 170-173.
Torrance, E. P., & yun Horng, R. (1980). Creativity and style of learning and think-ing characteristics of adaptors and innovators. The Creative Child and Adult Quarterly, 5, 80-85.
Torrance, E. P. (2008). The Torrance Tests of Creative Thinking: Norms-technical manual. Bensen-ville, IL: Scholastic Testing Service.
Virgolim, A. M. (2005). Creativity and intelligence: A study of Brazilian gifted and talented stu-dents (unpublished master thesis). University of Connecticut.