José Carlos Rocha da Veiga Joaquim Sant’Ana Fernandes Cristina Isabel Ramos Gonçalves Georgette dos Santos Andraz
ABSTRACT
Following the theories of gray and positive accounting this study examines the options in the measurement of assets and the usefulness of fair value. Using a sample of 104 Portuguese and Spanish companies with listed securities, the research analyzes factors associated with the fair value option and whether the listing incorporates this information. The results reveal a conservative behavior, where only 19% of companies use the fair value, specially the Portuguese (35%), confirming that the country of origin has a significant influence on this choice. The fair value option is more expressive on investment properties, and less expressive in intangibles. The sectors denote significantly different behaviors, and companies with higher quotes are more cautious using the fair value. The market reacts differently about the nature of this information. It is favorable to its sectorial utilization, reacting negatively to a more widespread use (Portugal), which supports the argument that the relevance of fair value estimates are dependent on the confidence placed by investors. This study contributes to stress the culture and market price of companies as explanatory variables for the use of fair value. Our findings suggest a more conservative culture in Spanish than in Portuguese companies.
Keywords: Fair Value, Historical Cost, Market Value, Cultural Environment
JEL Classification: M40
1. INTRODUCTION
Despite the efforts of standards bodies for greater comparability of financial information, there is still a debate in several areas about the most appropriate measures. With convergence rules, it was expected an increment of the comparability of financial information, and thus a reduction of the risk associated with accounting diversity (Doupnik and Perera, 2007). Measuring by fair value (FV) or by historical cost (HC) is one of the aspects with no consensus of which best represents the financial information in its reliability and utility. The definition of the accounting options lies with the administration, that incorporate in this decision organizational practices, being that conservative options (cautious) are not neutral on its impact on the balance and/or results. As several studies show, these practices reflect a country’s culture (Rego and Cunha, 2009).
assessment of investors, following the assumptions of the positive theory of Accounting (Watts and Zimmerman, 1990), and reflected in the stock price (Ohlson, 1995). In this context we carried out an empirical study, whose objects are listed entities in Lisbon and Madrid’s Stock Exchange, during the period of 2007-2013. Since accounting choices are influenced by several factors, we introduced in the study a set of control variables related to the internal characteristics of the entities (e.g. size, performance indicators and debt), as well as structural factors (sector). The information was taken from reports and consolidated accounts.
Besides this introduction, we present the theoretical framework in section 2, the empirical study in section 3, and on sections 4 and 5, the results and conclusions, respectively.
2. BACKGROUND
The option to measure certain assets thorough FV or HC can be analyzed in several dimensions, particularly in the light of the reliability perceived by markets, regulation, legal and tax system, cultural traits, contracts and litigation, results management, bonus plans of managers, among many other aspects. Traditionally accounting was based on the concept of HC being or seeming to be, the most reliable means of satisfying the requirement of objectivity (Pinto, 2013). The HC has recognized advantages, such as objectivity, prudence, consistency and reliability, because it is supported by documentation, as advocated by Ferreira (2009), Guimarães (2000), Gouveia (2009), Benau and Grima (2002) and López (2005). Its drawbacks are outdated values related to the past, not reflecting the inflation, not recognizing the current market value, therefore being of little relevance (Guimarães, 2011; Pinto, 2013, and López, 2005). In defense of the HC, Ferreira (2009), Sá (2008), García and Fernández (2007), Bastos (2009) and Galera (2005) argue that the measurement by the FV, when based on expert information, can be manipulated. This subjectivity is also identified as a negative factor by Ferreira (2009), Rua (2013), Guimarães (2008), Whittington (2008) and Marques (2007), claiming that the FV is volatile and may be subject to manipulation by managers, promoting the agency theory to their advantage. Watt (2002) in turn argues that the existence of a conservative approach in accounting options can be primarily explained by the costs of agency and litigation.
In a more structural approach, various theories and studies analyze the options of the accounting jurisdiction under practices influenced by environmental factors, such as cultural traits, legal, financial and/or tax systems, among others. Naturally, the choice between FV and HC can also be explained according to these environmental factors, namely cultural ones. Some authors, in particular Salter and Niswander (1995) and La Porta, Lopez-De-Silanes, Shleifer and Vishny (1997) suggest factors such as legal origin (common law versus code law) as primitive aspects of these cultural traits, i.e. those that influence other dimensions, such as the normative production, the independence of the accounting profession, and thus also their practices. However, from a different perspective, Nobes and Parker (2008) find it difficult to establish the relationship between cultural values and accounting practices, as there are aspects such as legal systems, financial and fiscal environment, among others, that can be the dominant agents of influence.
Based on four cultural dimensions of Hofstede (1980), Gray (1988) develops an exploratory framework incorporating accounting values, as professionalism versus statutory control, uniformity versus flexibility, conservatism versus optimism and secrecy versus
transparency. Salter and Niswander (1995) tested Gray’s (1988) theory, concluding that the secrecy versus transparency was related to the financial reporting. Zarzeski (1996) also found this relationship in companies operating at the national level, except for those with a higher exposure to financial and commercial markets. A study of Hooi (2007) regarding the banking sector from 27 developed countries supports Gray’s (1988) proposed hypothesis that the secrecy and its impact on disclosure is a function of cultural values identified by Hofstede (1980).
The principle of conservatism (or prudence) is traditionally defined as the non-anticipation of income, but the non-anticipation of all losses, even the unrealized ones (Watts, 2002). This principle has always influenced the accounting practices and the theory of accounting itself (Basu, 1997). It is considered that the use of the FV is not consistent with this principle as it was usually applied in the countries of continental Europe (Bertoni and Rose, 2013, and Demaria and Dufour, 2007). Gray (1988) classified the accounting culture of Portugal and Spain as similar, evidencing the cultural traits of the statutory control, uniformity, conservatism and secrecy. Regarding the accounting value of conservatism in Portugal Marcelino (2013) noted its strengthening around items related to the measurement of assets and liabilities, as well as the preference of the cost model rather than the fair value basis. He concluded that the results obtained are consistent with a conservative approach. On the other hand, Martins, Silva and Gama (2014) concluded that there is still conservatism in Portugal, albeit less fortified, as an evidence of a prudent recognition of impairment, particularly in larger entities with larger earnings before interest and taxes, and obliged to statutory audit report, thus fitting in the standard profile of the countries that adopt the International Accounting Standards (IAS).
Several studies introduce the Iberian cultural factor (proxy for country) in the study of accounting practices. Of particular relevance are studies by Fernandes, Gonçalves, Guerreiro and Pereira (2014), concluding that there are significant differences in the recognition of impairment, which are higher in Spain. Silva (2010) does not show differences between the two countries, with respect to intangible assets. Outside the Iberian context, Costa (2014) analyzed a sample of 44 companies from five European countries (Portugal, Spain, France, Italy and Greece), with securities listed on major stock indexes, with investment properties and/or biological assets in their assets. He concludes that the use of FV is larger for biological assets (7 of 9 companies, of which 5 were in the sectors of farming and related services) being reduced (8 of 43) on investment properties. Christensen and Nikolaev (2013) analyzed 275 companies (124 English and 151 German) that held investment properties, and concluded that the use of the FV has little importance, only used when it is available and at a low cost. They found a positive relationship between use of FV and the country (England) and concluded that German companies are more likely to use the HC. They also concluded that the housing sector is more likely to use the FV. Lourenço and Curto (2008) analyzed listed companies of four European countries (France, Switzerland, England and Germany) and found no significant differences concerning measurement practices of investment property. However, most companies (about 82%) have used the FV.
measurement practices of Portuguese companies with listed securities regarding investment properties (2005-2008), found that, of the 75 observations, 39 corresponded to companies that used the HC, and 36 using the FV model. On the contrary, Arrenega (2012), Muller, Riedl and Sellhorn (2008) conclude that the companies have chosen mostly the FV. However, Barros (2013) concludes that this option is only statistically significant in companies in the financial sector. Also Costa (2014) found that, in companies that include real estate as one of the main activities, 66.7% have adopted the FV, confirming the link between the use of the FV and certain sectors. For the agricultural sector, Filho, Martins and Machado (2013), Argilés, Garcia-Blandon and Monllau (2011) and Gonçalves and Lopes (2014) concluded that the adoption of the FV in biological assets was positive and closer to market value.
Several studies have analyzed reasons for not choosing the FV. Quagli and Avallone (2010) found that one of the impediments to the use of FV were the agency costs. They also found that there is a negative relationship with the ratio market-to-book and the debt ratio and a positive association between the FV option and the size of entities. Christensen and Nikolaev (2013) report that 44% of companies that used the FV, upon adoption of the IAS, opted for the HC, justifying such a change as the most appropriate to the market. In turn, Palavecinos (2011) concluded that the objectivity of the HC model was insufficient to provide transparent information to the market and, despite the FV having some associated risks, that it should be used, if well explained. Gómez, Hoz and Lopez (2011) reached the same result, stating that the FV facilitates comparability. Suarez and Fernandez (2007) concluded that there are factors that affect the FV adoption, such as rising political and agency costs. Benau and Grima (2002) found that countries estimate and sources, question the reliability and confidence of information.
The financial crisis of 2008 created the need to examine whether the measurement by the FV would have negatively affected entities. Barreto’s (2009) and Laux and Leuz (2009) concluded that the measurement by FV contributed to a more rapid diagnosis of the crisis. These findings contradict what some authors have argued that the use of FV contributes to the financial crisis (e.g. Soto, 2012). The impact of the FV in the market value of the entities has been questioned by several authors, notably by Gonedes and Dopuch (1974) and Leftwich (1981), who concluded that the accounting rules are not associated with stock price, except when those rules have economic impacts. There are economic consequences when, as a result of new information, there is an impact particularly on the cash flow of companies. Following this line of research, Aboody, Barth and Kasznik (1999) analyzed the surplus revaluation of fixed assets of English companies, confirming that it was positively related to the results, cash flow, operational future and the stock price. Similarly, Barth and Clinch (1998) found that the revalued tangible fixed assets of Australian companies were associated with the stock price. They have also shown that HC and the FV in non-financial companies were rated differently by investors. Lourenço and Curto (2008) show the importance of both the FV as the HC for the stock price. They found significant differences regarding the measurement of investment properties to the FV between British, French, German and Swiss companies with securities listed. Considering the country, they found a positive relation to the stock price in Germany, the UK and Switzerland, and a negative in France. On the other hand, Li and Kyu (2010) concluded for the relationship between changes of the FV and the fluctuation of the stock price of Chinese companies. Selas (2009) found no significant differences in the market price of companies with securities listed in Lisbon regarding the use of HC or FV.
the entity was related to the recognition and disclosure of impairments. Oliveira, Rodrigues and Craig (2010) when evaluating the significance of the amount disclosed of intangible assets and goodwill in the market, following the full entry of the IAS, found that there was a positive association with the stock price, being the most significant the goodwill. In the same reasoning of previous studies, Fernandes and Gonçalves (2014) concluded that the goodwill and respective impairments are relevant to the market, but in a differentiated way for entities that are not part of the Portuguese Stock Index 20.
Given the different results of previous studies and following Landsman (2006) argument, it can be concluded that both the dissemination and measuring by the FV are useful for investors. However, this utility depends on several factors, including the recognized amounts, the estimation errors and their sources, which question the confidence in the reliability of the information.
3. METHOD
3.1. General objectives and research hypotheses
There are several factors associated with the use of the FV or HC and the studies referred above indicate various contingencies associated with their use. This study analyzes factors associated with the adoption of the FV and if this information is assimilated in the stock price. We set up explanatory factors of external nature (division) and internal (the relevance of items to review, audit firm, dividend policy, net profit). We introduced the cultural factor (There are several factors associated with the use of the FV or HC and the studies referred above indicate various contingencies associated with their use. This study analyzes factors associated with the adoption of the FV and if this information is assimilated in the stock price. We set up explanatory factors of external nature (division) and internal (the relevance of items to review, audit firm, dividend policy, net profit). We introduced the cultural factor (using country as a proxy) to analyze the extent to which it justifies accounting practices between different countries.
We defined the following research hypotheses:
H1: The use of FV as a criterion for measurement of tangible fixed assets, intangible assets and investment properties is associated with variables of cultural and sectorial nature, and internal to the entities.
H2: FV’s application influences the perception of investors, being reflected in the market value of the entities.
3.2. Universe and sample
The study focuses on a sample of 104 companies with listed securities (35 from Euronext Lisbon and 69 from the Bolsa de Madrid). Both samples are statistically representative of the universe (random samples), considering the exclusion of the financial and insurance industry.
Financial and insurance industry entities were excluded, since the information disseminated by these entities is not comparable, as they apply specific rules imposed by their respective supervisory bodies.
Data were taken from the consolidated financial statements (2007-2013) collected from the webpage of the Comissão do Mercado de Valores Mobiliários and from the Comisión Nacional de Mercado de Valores. The listed prices of securities were collected from the webpage of the
Euronext Lisbon and Bolsa de Madrid, considering the dates of 12/31 and 3/31, for every observed year.
3.3. Variables
3.3.1. Dependent variables
It was defined as dependent variables for the two hypotheses, with the selection criteria those that translate the phenomenon under study and have been used by other authors. Hypothesis 1 for the dependent variable is dichotomous (aplica_JV), wherein 1 refers to the use of the FV in at least one of the entries, and 0 for non-use. This variable was used by Conceição (2009), Teixeira et al (2013) and Dinis (2013).
For hypothesis 2 it was defined as the dependent variable the natural logarithm of the market value (log_mkt_val_d), with reference to the end of each year. This variable has been used in several studies which associate the market value with determined dependent variables, including Fernandes and Gonçalves (2014) and Albuquerque et al. (2011).
3.3.2. Independent variables
Independent variables are potentially explanatory variables of the outlined hypothesis, grouped into factors associated to a diverse nature. To estimate the underlying model for the first hypothesis, the following independent variables were considered:
• Intangible assets (a_intg), that correspond to one of the items analyzed in terms of application of the FV (IAS 38). Expected sign (+) References: Silva (2010).
• Logarithm of tangible fixed assets (log_AFT), that correspond to one of the items analyzed in terms of application of the FV (IAS 16). Expected sign (+) References: Christensen and Nikolaev (2013) and Fernandes et al (2014).
• Investment properties (prop_inv), that correspond to one of the items analyzed in terms of application of the FV (IAS 40). We expect a positive relationship because the standard implicitly leads to the obligation of measuring by the FV. Expected sign (+) References: Fernandes et al (2014) and Costa (2014).
• Country × total assets (país_ativos), variable of interaction between the variable Country [Portugal (1) or Spain (0)] and Asset. As variable of interaction it has an exploratory nature, however the variable country has been used in several studies. To determine the country we considered the International Securities Identification Number with the prefix PT (Portugal) and ES (Spain). Expected sign (+) References: Lourenço and Curto (2008), Silva (2010), Christensen and Nikolaev (2013), Costa (2014) and Fernandes et al (2014).
• Sector × assets (setor_ativos), variable of interaction between industry [dichotomous variable where tradable goods (1) and non-tradable (0)] and the variable Asset. Despite the variable of interaction having an exploratory nature, the sector has been used as an explanatory variable in several studies. Expected sign (+) References: Dinis (2013), Argilés et al (2011), Christensen and Nikolaev (2013) and Costa (2014).
• Auditors (audit), on the grounds that the multinational audit firms, called the big41
will be more demanding of customers with regards to the careful application of the rules. It is a dichotomous variable, where one (1) corresponds to big4 companies and zero (0) to the others. Expected sign (-) References: Teixeira et al (2013) and Gonçalves and Lopes (2014).
• Entity’s share price in the previous year [cot_dez (n-1)], which aims to determine to what extent the FV option is influenced by market value. Expected sign (-) References: Muller et al (2008), Teixeira et al (2013), Christensen and Nikolaev (2013) and Fernandes et al (2014).
• To estimate the underlying model of the second hypothesis, we considered as independent variables those resulting from previous studies:
• To estimate the underlying model of the second hypothesis, we considered as independent variables those resulting from previous studies: Natural logarithm of the asset (ln_ativo): The asset is used generally as a proxy of the entity’s size, coupled with the expectation of future economic benefits, facts justifying the expected positive relationship between this variable and the market value of the entities. Expected sign (+) References: Watts and Zimmerman (1990), Conceição (2009), Quagli and Avallone (2010) and Christensen and Nikolaev (2013).
• Market-to-book [mkt_book_1T(n-1)]: Ratio that compares the market value to book value, based on the year n-1:
Market to book =
Book value
Market value
with market Value = market price (31 mar N-1) x number of shares and book Value = Equity in n-1.
The introduction of a lag of 1 year explains the hypothesis that the market value of year n is influenced by the previous year. Several studies, not related to the topic of FV, introduced this variable, and concluded that it provided incremental information to the market. Expected sign (+) References: Aboody et al (1999).
• Dividend distribution (distr_divid): Dichotomous variable where Distributes dividends = 1; Does not distribute dividends = 0. Dividends reflect the remuneration policy for shareholders and carry management signals that may influence the stock price. Expected sign (+). References: Ohlson (1995).
• Application of the FV by country (pais_aplica_JV): Results from the interaction between the variable country (Portugal = 1; Spain = 0) and the variable aplica_JV, also dichotomous (applies JV = 1, does not apply = 0). As variable of interaction, it has an exploratory nature, however, the variable country has been used in several studies because it is assumed different behaviors by country. Expected sign (+) References: Lourenço and Curto (2008), Silva (2010), Christensen and Nikolaev (2013) and Fernandes et al (2014).
• Application of the FV by sector (setor_aplica_JV): Variable that results from the interaction between the variable Sector (Tradable goods = 1; Non-tradable goods = 0) and the aplica_JV variable. According to Watts and Zimmerman (1990) companies in the same industry tend to adopt dissemination strategies they perceive as the most suitable for the specification of such sector. Expected sign: not set. References: Watts & Zimmerman (1990) and Christensen & Nikolaev (2013).
• Net income (NI): The net income is the performance of which it is expected a positive relationship with the market value. Expected sign (+); References: AbuGhazaleh et al
(2012), Xu et al. (2011) and Oliveira et al (2010).
• Current liabilities (passivo_corr): The liability represents the gross debt. It studies the impact of short-term liabilities, which is directly related to the pressure in the treasury, assuming a negative relation to the market value. Expected sign (-); References: Kvall (2005), Selas (2009), Albuquerque et al (2011) and Christensen & Nikolaev (2013).
ownership structure is diffuse, managers have greater opportunity for the exercise of discretion on accounting choices. It is assumed that investors associate a higher concentration to a higher credibility of the accounting information, with a positive impact on the stock price. Expected sign (+) References: Conceição (2009).
3.4. Models
In the first hypothesis, given the dependent variable’s dichotomy, we defined a multivariate regression model logit for panel data, which provides the probability of a given observation to belong to a particular set on the basis of the behavior of independent variables.
aplica_JVit = β0it+ β1a_intagit1 + β2log_AFTit2 + β3prop_invit3 + β4auditit4 + β5setor_ativosit5 + β6país_
ativosit6 + β7cot_dez_n-1it7 + μit
where i = 1, …, 104, t = 2007, ..., 2013 andμit represents the error or idiosyncratic disturbance, as it varies alongiandt.
In the second hypothesis - the relationship between the market value and a set of potentially explanatory variables - we set up an econometric model of multivariate regression for panel data:
log_mkt_val_dit = β0it+β1ln_ativoit1 + β2mkt_book_1T(n-1)it2 + β3 pais_aplica_JVit3 + β4setor_aplica_
JVit4 + β5distr_dividit5 + β6RLit6 + β7passivo_ corrit7 + β8int_maioritit8 + μit where
i = 1, …, 104, t = 2007, ..., 2013 eμit represents the error or idiosyncratic disturbance, as it varies alongi andt.
4. RESULTS
4.1. Sample characterization
Companies were grouped in two sectors: tradable (73) and non-tradable (31) goods. We analyzed in the following table the FV use, finding that, in absolute terms, a similar use between the two sectors (between 17 and 19%) but different in type of assets the FV is used.
Table 1. Use of FV by sector2
Sector Type Aplica_JV JV_AFT JV_INT JV_PI
Non-tradable goods (217 obs.) 42 (19,4%) 28 (12,9%) 0 21 (9,7%)
Tradable goods (511 obs.) 88 (17,2%) 29 (5,7%) 31 (6,1%) 43 (8,0%)
Considering the country, it is confirmed a greater adhesion of Portuguese companies (35%) compared to the Spanish (11%), presenting this difference as statistically significant (Pearson
x
2 = 86.448; p-value = 0.000).Figure 1. Use of FV by country
The companies also differ by country and by the type of assets of which FV is used, the Spanish differing by increased use in intangible assets.
Table 2. Use of the FV by country and type of asset3
COUNTRY Aplica_JV JV_AFT JV_INT JV_PI
Portugal 78 (60%) 50 (88%) 7 (23%) 43 (67%)
Spain 52 7 24 21
Total 130 57 31 64
As shown, it is in the investment properties where the FV appears most often, a giving that the standards require its use as a criterion for measurement or, alternatively, the disclosure attached, so that the entities must support, in both alternatives, the costs associated with its acquisition. On the other hand, it is less frequent the use of FV for intangible assets, which can be explained by the fact that IAS 38 requires the existence of an active market to use this option.
4.2. Estimated models
4.2.1. Application of fair value
To find out whether the regression is properly specified, we used the Reset test (Regression Equation Specification Error Test) from Wald (
x
2 (1) = 00:53; p-value = 0.0000) the outcome of which cannot reject the hypothesis of the model being correctly specified.The model adjustment was also proven by Hosmer, Lemeshow and Klar’s test (1988) with
x
2 (8) = 14:26; p-value = 0.0752, whose result indicates that 85.58% of the variables are correctly classified.Panel data provides three types of statistical models: pooled, fixed effects and random effects. The result of the maximum likelihood test (
x
2 (01) = 327.25; p-value = 0.000) justifies the use of the model logit with panel data. With the Hausman test (x
2 (4) = 0.0;p-value = 1.000) it was found that the random effects model is the most adequate, instead of the fixed effects model and this is the reason for its use in present analysis..
To examine whether the defined model was adequate to explain the behavior of the dependent variable, we used the Wald test and the test of maximum likelihood. The value
of the Wald test (
x
2 (7) = 47.51; p-value = 0.0000) and the maximum likelihood test (LRx
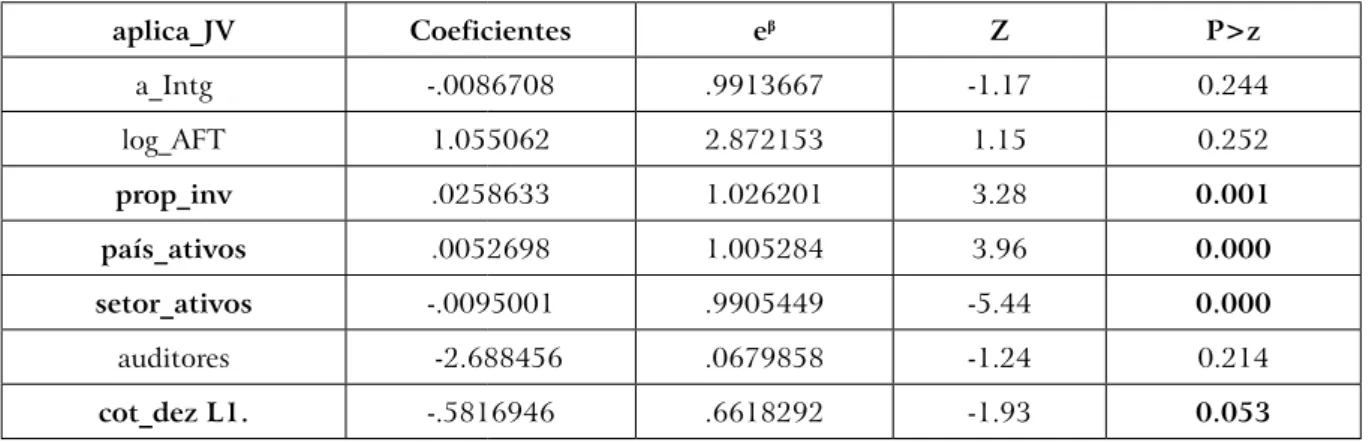
2 (7) = 25.44; p-value = 0.0006) showed a good adjustment of the model. The estimation results are presented in the following table:Table 3. Coefficients and significance (H1)
aplica_JV Coeficientes eβ Z P>z
a_Intg -.0086708 .9913667 -1.17 0.244
log_AFT 1.055062 2.872153 1.15 0.252
prop_inv .0258633 1.026201 3.28 0.001
país_ativos .0052698 1.005284 3.96 0.000
setor_ativos -.0095001 .9905449 -5.44 0.000
auditores -2.688456 .0679858 -1.24 0.214
cot_dez L1. -.5816946 .6618292 -1.93 0.053
No of observations = 6241
No of groups = 104
From the results it can be seen that, for a significance level of 5% (5.3% for market price), the general hypothesis was validated and several variables are significantly associated with the FV option.
The country (Portugal) becomes associated with the expected positive sign.
The results show that the Portuguese companies have a practice of using the FV far superior to the Spanish (35% vs 11%) and is therefore deemed substantiated the existence of more conservative practices in the neighboring country, naturally confirming the assertion of Benau and Grima (2002) that the country positively influences the choice of measurement models. These results are confirmed by Costa (2014) where none of the Spanish companies in the sample used the FV, whereas about half of the Portuguese companies used it (investment properties).
Investment properties are explanatory of the use of the FV, confirming Teixeira et al.
(2013) results. These results also are consistent with those of Selas (2009) which confirmed that a significant percentage (48%) of companies with listed securities (Portuguese and Spanish) with investment properties used the FV model. Christensen e Nikolaev (2013) found that, while only 3% of companies revalued its tangible fixed assets, more than half of the investment properties were measured by the FV. Costa (2014) found a reduced percentage of the application of the FV model on investment properties, going in the opposite direction to those obtained. The remaining assets (tangible and intangible) appear as not relevant to the FV model, as well as the role of audit firms on this choice.
Assets associated with the business sector (tradable goods) as well as the share price are related to the FV with negative signs. This result can be interpreted as a conditioned behavior of companies to the dominant practices in the industry, a phenomenon explained in the light of various theories, including the institutional theory. The negative relationship found clarifies that entities in the sectors of tradable goods will most likely not use the FV significantly. On the other hand, Dinis (2013) concluded that the variable sector had a positive influence on the choice of the FV. Studies of Costa (2014) and Christensen and Nikolaev (2013) also go in the same direction, and the different results can be explained by the industry groups used in the analysis. In this particular case, it is concluded that this use
is not significant in the context of the universe of companies, so the result reflects the HC preferences.
The variable market price presents the expected sign, in that it is expectable that entities in the market already recognize their intrinsic value and do not use the asset adjustments for more favorable images, subjecting themselves to the investors’ judgment on the quality of these adjustments.
It can be concluded that the results are consistent with those of other studies, and that the adoption of the FV model is influenced not only by the dominant accounting practices for a particular sector, as there is a strong influence of the cultural factor, embodied in the variable country. It is also confirmed that the use of HC prevails over the FV, and that it is used preferably in subsets of assets, in association with certain sectors of activities, reinforcing the view that this is still the dominant practice.
4.2.2. Application of FV and market value
To test the hypothesis of the importance of applying the FV and remaining independent variables in the market value of the entities, we analyzed the most appropriate functional model, and which estimator to use. The Reset test (Ramsey, 1969) checks the linearity of the relationship between covariates (Ferreira, 2010) and confirms the correct specification of the functional form of the proposed model (F (3, 611) = 2.08; p-value = 0.1022).
With regard to the estimation model, we can consider three ways: pooled, random effects or fixed effects. The LM test of Breusch-Pagan (1980) with a value of �2 (1) = 461.13;
p-value = 0.0000 allows to reject the null hypothesis, thus the random effects model is more appropriate than the pooled. To decide between the use of the pooled model and fixed effects, we used the F test, whose null hypothesis is that the coefficients associated with the years are null. To an F (103.511) = 12.24 and p-value = 0.0000 it allow to refute this hypothesis, so the fixed effects model should be accept.
To decide between the models of random effects and fixed effects we used the Hausman test. For a �2 (6) = 153.69 and p-value = 0.0000 we opted for the use of the fixed effects model. Tests diagnostic revealed the presence of heteroscedasticity [modified Wald test (�2 (104) = 1417.62; p-value = 0.000)] and residual autocorrelation (autocorrelation Wooldridge test for panel data with F (1, 103) = 113,687 and p-value <0.000). To test the possible multicollinearity of the independent variables, we calculated the VIF (variance inflation factor). The literature shows that the closer to zero FIV is, the lower the multicollinearity. The results indicate the absence of multicollinearity, since VIF <10 and the tolerance superior to 0.1. Given the presence of residual autocorrelation and heteroscedasticity, the model was estimated with the option robust, in order to obtain more robust estimators (Drukker, 2003).
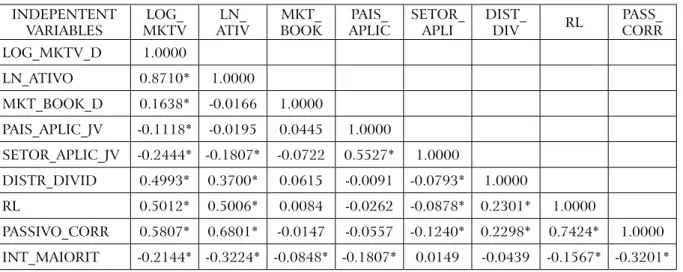
Table 4. Table of correlations
INDEPENTENT VARIABLES
LOG_ MKTV
LN_ ATIV
MKT_ BOOK
PAIS_ APLIC
SETOR_ APLI
DIST_
DIV RL
PASS_ CORR
LOG_MKTV_D 1.0000
LN_ATIVO 0.8710* 1.0000
MKT_BOOK_D 0.1638* -0.0166 1.0000
PAIS_APLIC_JV -0.1118* -0.0195 0.0445 1.0000
SETOR_APLIC_JV -0.2444* -0.1807* -0.0722 0.5527* 1.0000
DISTR_DIVID 0.4993* 0.3700* 0.0615 -0.0091 -0.0793* 1.0000
RL 0.5012* 0.5006* 0.0084 -0.0262 -0.0878* 0.2301* 1.0000
PASSIVO_CORR 0.5807* 0.6801* -0.0147 -0.0557 -0.1240* 0.2298* 0.7424* 1.0000
INT_MAIORIT -0.2144* -0.3224* -0.0848* -0.1807* 0.0149 -0.0439 -0.1567* -0.3201*
The results are shown in the following table and, as it turns out, the variables, except for the shareholder concentration, are presented as explanatory of the market value of the entities.
Table 5. Coefficients and significance (H2)
log_mkt_val Coefficients T P>|t|
ln_ativ .6707732 5.33 0.000
mkt_book_1t(n-1) .0105492 2.05 0.043
país_aplica_JV -.9422926 -41.52 0.000
setor_aplica_JV .3439983 77.09 0.000
distr_divid .224311 2.80 0.006
RL .000136 4.80 0.000
passivo_corr -.0000302 -2.61 0.010
int_maiorit -.1207428 -0.74 0.460
No of observations = 623 No of groups = 104
F(8,511) = 11.48; p-value = 0.0000
Adj R-squared = 0.9468
to companies, including the legal and political systems of the country where the company resides.
The use of the FV by sectors (tradable goods) appears to be well received by the market, in that it is a significant positive relationship. As analyzed, this practice is not dominant in this sector, putting forward the hypothesis that there is an investors’ perception that, when this accounting policy is adopted, it is reliable and credible basis. Conceição (2009) tested the hypothesis that the financial industry would be most likely to use the FV, but it did not assume as statistically significant. Christensen and Nikolaev (2013) associated the use of the FV to real estate.
The variable (ln_ativ) as proxy of the size, presents the expected and statistically significant positive relationship with the entity’s market price in line with Watts and Zimmerman (1990), Conceição (2009), Quagli and Avallone (2010) and Christensen and Nikolaev (2013).
As regards the relationship with mkt_book_1T variable (n-1), it is confirmed that the past market performance influences the perception of investors about the value of companies. These results follow the conclusions of Beaver and Ryan (2000) that there is an association and that the market-to-book provides incremental information.
The positive relationship of the variables net income and distribution of dividends to the value of the market can be explained by the attractiveness that investors have for entities that have a higher net income, and the expectation of a higher dividend. These results confirm Ohlson (1995), who concluded that dividend policies had a positive relationship with the market value and the book value. Campbell and Robert (1998), likewise, concluded that current dividends have a positive relationship with the stock price in the future.
The negative sign of the variable (passivo_corr) can be justified by the negative market reaction to indebtedness of the entities. The entity value may be questioned due to cash flow problems, and having to resort to the capital to honor its commitments. This negative relationship is consistent with the results from several studies including Kvall (2005), Selas (2009), Albuquerque et al. (2011) (2011) and Christensen & Nikolaev (2013).
Of the studies reported in the literature, only Filho et al. (2013) presents some similarities with the current, differing in the objective and methodology, and concluding that the evaluation by the FV has a positive relationship with the market.
5. CONCLUSIONS
The object of this study is to investigate whether there are structural explanatory factors associated with the country of origin and characteristics of the entities to justify the choice of the FV model as measurement criteria and if this choice has an impact on the market value of the entities.
conservatism (as shown by Marcelino, 2013) the results may signal a cultural change, which is consistent with studies that focus on other research lines (Rego and Cunha, 2009).
In addition to the country of origin of the entities, we concluded the existence of other factors of internal and external order, influencing their choice for the application of the FV method.
Investment properties are identified (nature of the asset) as positively related, evidence cited by Christensen and Nikolaev (2013), Teixeira et al. (2013) and Selas (2009).
In the second case, we sought to analyze whether the application of FV influences the perception of investors about the value of companies, and if this is reflected in the stock price. All variables considered in the model are significantly explanatory, except for the variable shareholder concentration, which is expected to present a positive sign.
Of the variables analyzed, we highlight the ones directly related to this study’s theme: the relationship between the market value and the countries and sectors, both crossed with the FV’s application.
The negative relationship found in the variable country leads to interpret that investors of Portuguese companies penalize the FV measuring method, possibly by a lack of absolute trust of the accounting figures presented. Contrary to the expectation of positive influence or no influence of this information on the stock price formation, this negative relationship may be interpreted as a penalty for the use of measurement criteria with the objective of performance management. Thus, investors will discount on the price of securities the effect of expected addition for these results.
As for the use of the FV at the sectoral level (tradable goods sector) seems to be well received by the market, in that it is a significant positive relationship. The other control variables [asset (+), RL (+), market_to_book (+), dividends (+) and liabilities (-)] showed the expected signs, based on the presentation of the respective variables.
We considered that this study contributes to the knowledge on the application of the FV measurement in non-financial assets of the entities, concerning the two countries that are part of the European Union, having been introduced the cultural factor in this analysis.
REFERENCES
Aboody D., Barth, M. & Kasznik, R. (1999). Revaluations of fixed assets and future firm performance: Evidence from the UK. Journal of Accounting and Economics, 26: 149-178. AbuGhazaleh, N., Al-Hares, O. & Haddad, A. (2012). The value relevance of goodwill
impairments: UK evidence. International Journal of Economics and Finance, 4(4): 206-216. Albuquerque, F., Almeida, C. & Quirós, J. (2011). The impairment losses in non-financial
assets: evidence from the Portuguese Stock Exchange. International Journal of Business Research, 11(2): 42-52.
Argilés, J., Garcia-Blandon, J. & Monllau, T. (2011). Fair value versus historical cost-based valuation for biological assets: predictability of financial information. Revista de Contabilidad, 14 (2): 87– 113.
Arrenega, A. (2012). A escolha do modelo do justo valor na mensuração de Propriedades de Investimento, unpublished Master’s Dissertation, ISCTE Business School - Instituto Universitário de Lisboa.
Barreto, E. (2009). A contabilidade a valor justo e a crise financeira mundial, Master’s Thesis unpublished, University of São Paulo - School of Economics, Business and Accounting II.
Barros, J. (2013). Estudo da Aplicação das Normas Contabilísticas de “Justo Valor” (“Fair Value”) nas Empresas Integradas no Portuguese Stock Index-20 (PSI-20), unpublished Master’s Dissertation,School of Economics & Management Lisbon.
Barth, M. & Clinch, G. (1998). Revalued financial, tangible and intangible assets: associations with share prices and non-market-based value estimates. Journal of Accounting Research, 36 (3):199-233.
Bastos, M. (2009). O Justo Valor como Instrumento de Alteração do Paradigma de Mensuração Contabilística, unpublished Master’s Dissertation, University of Aveiro.
Basu, S. (1997). The Conservatism Principle and the Asymmetric timeliness of Earnings.
Journal of Accounting and Economics, 24: 3-37.
Beaver, H. & Ryan, G. (2000). Biases and lags in book value and their effects on the ability of the book-to-market ratio to predict book return on equity. Journal of Accounting Research,
38(1): 127-148.
Benau, M. & Grima, A. (2002). El camino hacia el valor razonable. Revista de Contabilidad, 5(9): 57-88.
Bertoni M e De Rosa, B. (2013) Comprehensive income, fair value and conservantism: a conceptual framework for reporting financial performance. Available at: file:///C:/Users/Utilizador/ Downloads/SSRN-id2239303.pdf. Accessed July 18, 2014.
Breusch, T. e Pagan A. (1980) The LM Test and its Application to Model Specification in Econometrics. Review of Economic Studies, 47: 239–254.
Campbell, J. & Robert, J. (1998). Valuation Ratios and the Long-Run Stock Market Outlook.
Journal of Portfolio Management, 24(2): 11-26.
Choi, F., Frost, C. & Meek, G. (1999). International Accounting. Prentice Hall International Editions. New Jersey.
Christensen, H. & Nikolaev, V. (2013). Does fair value accounting for non-financial assets pass the market test?. Review Account Studies, 18: 734–775.
Conceição, L. (2009). A Opção pelo “Justo Valor ” como Método de Avaliação de Activos na Adopção das IAS/IFRS em Portugal - Uma Análise Exploratória, unpublished Master’s Dissertation, University of Porto.
Costa, A. (2014). A adopção do justo valor nos ativos não financeiros – Evidência Empírica de 2010 a 2012 de 5 países europeus, unpublished Master’s Dissertation, Technical University of Lisbon.
Demaria, S.; Dufour, D (2007) First time adoption of IFRS, Fair value option, Conservatism: Evidences from French listed companies. 2007. Available at: http://hp.gredeg.cnrs.fr/demaria/ recherche/First%20adoption%20and20fair%20value%20Demaria%20Dufour.pdf. Accessed December 20, 2013.
Dinis, J. (2013). O uso do Justo Valor na mensuração dos ativos fixos, unpublished Master’s Dissertation, Technical University of Lisbon.
Doupnik, T. & Perera, H. (2007). International Accounting. McGraw Hill. Columbus.
Drukker, D. (2003). Testing for serial correlation in linear panel-data models. The Stata Journal, 3 (2): 168-177.
Fernandes, J., Gonçalves, C., Guerreiro, C. & Pereira, L. (2014). Perdas por Imparidades – fatores explicativos e impactos. TMS – Management Studies Internacional Conference, Algarve, novembro, published in the conference book: Perspetivas Contemporâneas em Gestão Financeira e Contabilidade, TMS Conference Series.
Ferreira, P. (2010). Princípios de Econometria. Bubok Publishing S.L.
Ferreira, R. (2009). Contabilidade – Critérios Valorimétricos. TOC Magazine, 110: 45-51.
Filho, A., Martins, V. & Machado, M. (2013). Adoção do valor justo para os ativos biológicos: Análise de sua relevância em empresas brasileiras. Universo Contábil Magazine, 9(4): 110-127.
Galera, A. (2005). Una propuesta para la aplicación de los modelos de valoración de las normas internacionales a los activos de las entidades públicas españolas. Spanish Journal of Finance and Accounting / Revista Española de Financiación y Contabilidad, 34(126): 637-661. García, F. & Fernández, F. (2007). El valor actual neto como modalidad de fair value : Hacia
un mayor grado de relevancia de la información financiera. Partida Doble, 185: 20-29.
Gómez, O., Hoz, B. & López, M. (2011). Valor razonable como método de medición de la información financiera. Revista Venezolana de Gerencia, 16(56): 608-621.
Gonçalves, R. & Lopes, P. (2014). Firm-specific determinants of agricultural financial reporting. Procedia - Social and Behavioral Sciences, 110: 470-481.
Gonedes N. & Dopuch, N. (1974). Capital Market Equilibrium, Information Production, and Selecting Accounting Techniques: Theoretical Framework and Review of Empirical Work. Journal of Accounting Research, 12: 48-129.
Gouveia, J. (2009). Para um debate saudável: custo histórico versus justo valor, TOC Magazine, 113: 28-31.
Gray, S. (1988). Towards a theory of cultural influence on the development of accounting systems internationally. Abacus, 24 (1): 1– 15.
Guimarães, J. (2000). A contabilidade ao “justo valor”. Semanário Económico, 713: 18.
Guimarães, J. (2008). A Crise Financeira e o “ Justo Valor ” na Contabilidade e na Auditoria,
Revista Electrónica INFOCONTAB, 37: 1-7.
Guimarães, J. (2011). Os Princípios Contabilísticos Geralmente Aceites (POC vs SNC),
Revisores e Auditores, 55: 28-44.
Hofstede, G. (1980). Culture’s consequences: international differences in work related values. Beverly Hills, CA: Sage Publications. Beverly Hills.
Hooi, G. (2007). The Effects of Culture on International Banking Disclosures. Asia-Pacific
Journal of Accounting & Ecomics, 14 (1): 7-25.
Hosmer, D., Lemeshow, S. & Klar, J. (1988). Goodness-of-fit testing for the logistic regression model when the estimated probabilities are small. Biometrical Journal, 30: 911-924.
Kvaal, E. (2005). Topics in accounting for impairment of fixed assets. Series of Dissertations 3/2005, Norwegian School of Managment: Department of Accounting, Auditing and Law.
La Porta, R., Lopez-De-Silanes, F., Shleifer, A. & Vishny, R. (1997). Legal Determinants of External Finance. The Journal of Finance, 52 (3): 1131-1150.
Laux, C. & Leuz, C. (2009). The crisis of fair-value accounting: Making sense of the recent debate. Accounting, Organizations and Society, 34: 826-834.
Leftwich, R. (1981). Evidence of the impact of mandatory changes in accounting principles on corporate loan agreements. Journal of Accounting and Economics, March: 3-36.
Li J. & Kyu, P. (2010). The Role of Fair Value Accounting for Investment in Securities: Evidences from the Chinese Stock Exchanged Market. iBusiness, 2: 409-414.
López, M. (2005). La influencia del valor razonable de los bienes inmuebles en el análisis de los estados financieros de la empresa inmobiliaria. Granada, Editorial de La Universidad de Granada. Lourenço, I. & Curto, J. (2008). The Value Relevance of Investment Property Fair Values. Available
at http://papers.ssrn.com/sol3/papers.cfm?abstract_id=1301683. Accessed May 10, 2014.
Marcelino, M. (2013). A Influência da cultura e do julgamento profissional sobre a contabilidade: Uma análise sob o ponto de vista dos preparadores da informação em Portugal. Unpublished Master’s dissertation, School of Accounting and Administration of Lisbon. Lisbon.
Marques, M. (2007). O Justo Valor e sua Auditoria. Revista Revisores e Auditores, 37: 20-32. Martins, C; Silva, E, Gama, A (2014) Imparidades e os valores contabilísticos de Gray:
estudo empírico de empresas não cotadas em Portugal, GeCont, 1 (1): 62-84
Muller, K. & Riedl, J. e Sellhorn, T. (2008). Causes and Consequences of Choosing Historical Cost versus Fair Value. Pennsylvania State University, Paper. Available at http://www3. nd.edu/~carecob/May2008Conference/Papers/RiedlMRS03062008.pdf.Accessed September 22, 2014.
Nobes, C. & Parker, R. (2008). Comparative international accounting. 10th ed. Essex: Pearson Education, New Jersey.
Ohlson, J. (1995). Earnings, book values and dividends in security valuation. Contemporary Accounting Research, 11: 661-687.
Oliveira, L., Rodrigues, L. & Craig, R. (2010). Intangible assets and value relevance: Evidence from the Portuguese stock exchange. The British Accounting Review, 42: 241-252.
Orgambídez-Ramos, A., Mendoza-Sierra, M. & Giger, Jean-Christophe (2013). The Effects of Work Values and Work Centrality on Job Satisfaction. A Study with Older Spanish Workers, Spatial and Organizational Dynamics, CIEO, I (3): 179-186.
Palavecinos, B. (2011). Valor razonable: un modelo de valoración incorporado en las normas internacionales de información financiera. Estudios Gerenciales, 27 (118): 97-114.
Pinto, J. (2013). Contabilidade e justo valor. In Rodrigues, A. & Tavares, T. (eds) O SNC e os juízos de valor - Uma perspectiva crítica e multidisciplinar (pp. 13-16). Edições Almedina, S.A. Coimbra.
Quagli, A. & Avallone, F. (2010). Fair Value or Cost Model? Drivers of Choice for IAS 40 in the Real Estate Industry. European Accounting Review, 19(3): 461-493.
Ramsey, J. (1969). Tests for Specification Errors in Classical Linear Least-Squares Regression Analysis, Journal of the Royal Statistical Society. Series B (Methodological), 31 (2): 350-371. Rego, A. & Cunha, M. (2009). Manual de Gestão Transcultural de Recursos Humanos. Editora
RH. Lisbon.
Rua, S. (2013). A problemática determinação do justo valor dos ativos. TOC Magazine, 159: 48-51.
Salter, S. & Niswander, F. (1995) Cultural Influences on the Development of Accounting Systems Intemationally: a Test of Gray’s (1988) Theory. Journal of International Business Studies. 26 (2): 379-397.
Santos, J., Gonçalves, G. & Gomes, A. (2013). Organizational Culture and Subjective and Work Well-being. The Case of Employees of Portuguese Universities. Spatial and Organizational Dynamics, CIEO, I(3): 153-161.
Selas, D. (2009). The value relevance of investment property fair value. Unpublished master’s thesis, New School of Business and Economics (NSBE).
Silva, P. (2010). Efeito da aplicação da Norma Internacional de Contabilidade N.º 38 – Activos Intangíveis – na Península Ibérica, unpublished Master’s Dissertation, University of Aveiro. Soderstrom, N. & Sun, K. (2007). IFRS adoption and accounting quality: a review. European
Accounting Review, 16 (4): 675– 702.
Soto, J. (2012). Moeda, Crédito Bancário e Ciclos Econômicos. Instituto Ludwig von Mises. São Paulo. Brasil.
Sousa, C., Goncalves, G., & Cunha, M. (2015). Cultural values as a support to the development of intercultural competences. Spatial and Organizational Dynamics: Discussion Papers (in press).
Suárez, J. & Fernández, P. (2007). Las barreras a la expansion del valor razonable. Revista de Contabilidad y Dirección, 4: 147-164.
Teixeira, S., Fernandes, J., Gonçalves, C. & Pereira, L. (2013). Justo Valor como Método de Mensuração: Opção das Empresas Cotadas na Euronext Lisboa, XVII Congreso AECA, [online] 1-16. Available at: http://www.aeca1.org/pub/on_line/comunicaciones_xviicongresoaeca/ cd/7a.pdf 7a>. Accessed August 29, 2014.
Watts, R. & Zimmerman, J. (1990). Positive Accounting Theory: A Ten Year Perspective.
The Accounting Review, 65(1): 131-156.
Watts, R. (2002). Conservatism in Accounting. Available in the webpage: http://www.pba.ucy. ac.cy/courses/Watts_I.pdf. Accessed August 29, 2014.
Whittington, G. (2008). Fair Value and the IASB/FASB Conceptual Framework Project: An Alternative View. Abacus, 44( 2): 139-168.
Xu, W., Anandarajan, A. & Curatota, A. (2011). The value relevance of goodwill impairment,
Research in Accounting Regulation, 23: 145-148.