Graves’ Disease Samples Reveals Major and Novel HLA
Association Alleles
Pei-Lung Chen1,2, Cathy Shen-Jang Fann3,4., Chen-Chung Chu5., Chien-Ching Chang3
, Su-Wei Chang3, Hsin-Yi Hsieh3, Marie Lin5, Wei-Shiung Yang2,6,7*, Tien-Chun Chang2,7*
1Department of Medical Genetics, National Taiwan University Hospital, Taipei, Taiwan,2Department of Internal Medicine, National Taiwan University Hospital, Taipei, Taiwan,3Institute of Biomedical Sciences, Academia Sinica, Taipei, Taiwan,4Institute of Public Health, National Yang-Ming University, Taipei, Taiwan,5Transfusion Medicine Laboratory, Medical Research Department, Mackay Memorial Hospital, Taipei, Taiwan,6Graduate Institute of Clinical Medicine, College of Medicine, National Taiwan University, Taipei, Taiwan,7Department of Internal Medicine, College of Medicine, National Taiwan University, Taipei, Taiwan
Abstract
Background:Graves’ disease (GD) is the leading cause of hyperthyroidism and thyroid eye disease inherited as a complex trait. Although geoepidemiology studies showed relatively higher prevalence of GD in Asians than in Caucasians, previous genetic studies were contradictory concerning whether and/or which human leukocyte antigen (HLA) alleles are associated with GD in Asians.
Methodology/Principal Findings: We conducted a case-control association study (499 unrelated GD cases and 504 controls) and a replication in an independent family sample (419 GD individuals and their 282 relatives in 165 families). To minimize genetic and phenotypic heterogeneity, we included only ethnic Chinese Han population in Taiwan and excluded subjects with hypothyroidism. We performed direct and comprehensive genotyping of six classical HLA loci (HLA-A,-B,-C,
-DPB1,-DQB1and-DRB1) to 4-digit resolution. Combining the data of two sample populations, we found thatB*46:01(odds ratio under dominant model [OR] = 1.33, Bonferroni corrected combined P [PBc] = 1.1761022), DPB1*05:01 (OR = 2.34,
PBc= 2.58610210),DQB1*03:02(OR = 0.62,PBc= 1.9761022),DRB1*15:01(OR = 1.68,PBc= 1.2261022) andDRB1*16:02(OR = 2.63,PBc = 1.4661025) were associated with GD. HLA-DPB1*05:01is the major gene of GD in our population and singly accounts for 48.4% of population-attributable risk.
Conclusions/Significance:These GD-associated alleles we identified in ethnic Chinese Hans, and those identified in other Asian studies, are totally distinct from the known associated alleles in Caucasians. Identification of population-specific association alleles is the critical first step for individualized medicine. Furthermore, comparison between different susceptibility/protective alleles across populations could facilitate generation of novel hypothesis about GD pathophys-iology and indicate a new direction for future investigation.
Citation:Chen P-L, Fann CS-J, Chu C-C, Chang C-C, Chang S-W, et al. (2011) Comprehensive Genotyping in Two Homogeneous Graves’ Disease Samples Reveals Major and Novel HLA Association Alleles. PLoS ONE 6(1): e16635. doi:10.1371/journal.pone.0016635
Editor:Matthias von Herrath, La Jolla Institute of Allergy and Immunology, United States of America
ReceivedOctober 17, 2010;AcceptedJanuary 3, 2011;PublishedJanuary 28, 2011
Copyright:ß2011 Chen et al. This is an open-access article distributed under the terms of the Creative Commons Attribution License, which permits unrestricted use, distribution, and reproduction in any medium, provided the original author and source are credited.
Funding:This work was supported by grants from the National Science Council, Taiwan (NSC#91-3112-B-002-003, 92-3112-B-002-009, 93-3112-B-002-015, 95-3112-B-002-026, 96-3112-B-002-017 and 97-3112-B-002-004). The funders had no role in study design, data collection and analysis, decision to publish, or preparation of the manuscript.
Competing Interests:The authors have declared that no competing interests exist.
* E-mail: [email protected] (W-SY); [email protected] (T-CC)
.These authors contributed equally to this work.
Introduction
Graves disease (GD, [MIM 27500], http://www.ncbi.nlm.nih. gov/Omim/) is the leading cause of hyperthyroidism and thyroid eye disease, manifested with diffuse goiter, hyperthyroidism, thyroid-specific auto-antibodies, with/without ophthalmopathy and/or dermopathy [1]. Its prevalence in general population is around 1.0–1.6%, more common in females [2,3]. The etiology of GD is multifactorial, with considerable genetic influence [1], evidenced by family clustering (lsisterbetween 8 and 15) [4] and a
higher concordance rate in monozygotic twins (0.35) than in dizygotic twins (0.03) [5]. The genetic contribution to GD was
estimated as high as 79% [5]. Although geoepidemiology studies show relatively higher prevalence of GD in Asians than in Caucasians [6], whether/what genetic factors are important for GD in Asians is not yet clear [7–9].
more replicable, with a few promising loci such as the HLA region, CTLA4, PTPN22, CD40, FCRL3, CD25, TG and TSHR [8,9,15,16]. Although the HLA loci were most promising, the risk alleles identified in Caucasians (such as theHLA-DRB1*03,C*03, C*07,C*16and theDRB1*03-DQB1*02-DQA1*05:01haplotype) [7,8,11,17] showed no associations in Asians. (It is noteworthy that throughout this manuscript we have adapted the new HLA nomenclature system [18], which was mandated to become effective since April 2010.) Instead, in studies conducted in Chinese, Japanese, Koreans and Thai, GD was reported to associate with other class I or class II alleles [8,11,19–32] (Supplemental Table S1). There has been no conclusion regarding which HLA alleles are associated with GD in Asians [11,15]. The reports from previous studies were contradictory, at least partly because of issues related to sample sizes, sample heterogeneity (both in ethnic background and phenotype), population stratifica-tion, genotyping resolustratifica-tion, and extent of coverage. Direct HLA allele genotyping (instead of using nearby SNPs as surrogates) is very expensive and requires special techniques, which might explain why most previous studies only could afford small sample sizes and limited extent of coverage.
In this study, we conducted a case-control association study (499 unrelated GD cases and 504 controls) by direct and comprehen-sive genotyping of 6 classical HLA loci (HLA-A, -B, -C, -DPB1, -DQB1and-DRB1) to 4-digit resolution. For replication, we used an independent cohort of family samples (419 GD individuals and their 282 relatives in 165 extended families) genotyped with a different platform with the same 6-locus coverage and 4-digit resolution. We also managed to reduce heterogeneity in genetic background by including only ethnic Chinese Han individuals, and in disease phenotype (in our family samples) by excluding subjects with family history of hypothyroidism [13]. In contrast to the known associated HLA alleles in Caucasians, we found a whole distinct spectrum of associated alleles.
Results
HLA association tests using unrelated GD cases and controls
In the case-control association study, we observed a total of 196 HLA alleles from 6 loci (minimum: 18 alleles fromHLA-DQB1, maximum: 60 alleles from HLA-B) (Supplemental Table S2). Because of limited power to detect association with rare alleles, we only tested for disease association with common alleles (with a
frequency higher than 5% in either cases or controls) (HLA-A: 6 alleles;HLA-B: 4 alleles; HLA-C: 5 alleles; HLA-DPB1: 4 alleles; HLA-DQB1: 7 alleles andHLA-DRB1: 8 alleles). For the results to be robust, we reported Bonferroni correctedPvalues as our main results in the text as well as in the Tables. However, for the purpose of comprehensiveness, we also kept some nominal P values in certain columns of the Tables. (Please see the ‘‘Statistical analysis’’ section in ‘‘Materials and Methods’’ for details.) Of these 34 alleles tested, we found 8 alleles showing frequency difference with nominalPvalues smaller than 0.05 in the Armitage trend test, as well as in allelic test and in association test under dominant-model. However, only 4 of the 8 alleles were statistically significant after Bonferroni correction (DPB1*05:01, odds ratio under dominant model [OR] = 2.34, Bonferroni-corrected P= 1.66 1026
; DQB1*05:02, OR = 2.34, Bonferroni-corrected P= 1.561024
;DRB1*12:02, OR = 0.51, Bonferroni-correctedP= 1.76 1022;DRB1*16:02, OR = 2.63, Bonferroni-correctedP= 5.461026) (Table 1). Both susceptibility alleles and protective alleles were found. It is noteworthy that the alleles associated with GD in Caucasians showed either no evidence of association (DRB1*03, DQB1*02, C*07and C*03) or were not observed in our samples (C*16) (Supplemental Table S3 and Table S4).DQA1*05:01, another allele on the risk haplotype (DRB1*03:01-DQA1*05:01-DQB1*02) in Caucasians, was not genotyped in our study. However, in Asians, DQA1*05:01is not known to have noticeable linkage disequilibrium with any of the susceptibility alleles we reported [33].
Replication using the family-based study and other supporting evidence from previous association reports in Asians
We next tested the familial cohort for replication using a different genotyping platform. The comprehensive FBATPvalues were summarized in Table 2 and Supplemental Table S4. We then calculated the Bonfferoni correctedPvalues of our combined case-control and family-based analysis. We found that B*46:01 (odds ratio under dominant model [OR] = 1.33, Bonferroni corrected combinedP [PBc] = 1.1761022),DPB1*05:01 (OR = 2.34, PBc= 2.58610210), DQB1*03:02 (OR = 0.62, PBc= 1.9761022), DQB1*05:02 (OR = 1.89, PBc= 1.6061023), DRB1*15:01 (OR = 1.68, PBc= 1.2261022) and DRB1*16:02 (OR = 2.63,PBc= 1.4661025) were associated with GD. Review of GD association studies previously conducted in Asian populations revealed that 4 (B*46:01,DPB1*05:01,DQB1*05:02
Table 1.Association results (from 499 Graves’ disease cases and 504 controls) of the four alleles with Bonferroni correctedPvalue smaller than 0.05.
HLA allele
Allele Frequency (cases vs. controls)
Allelic testa
(nominal Pvalue)
Genotypic testa
(nominal Pvalue)
Armitage trend testa(nominal
Pvalue)
Dominant modela
(nominal Pvalue)
Dominant modela
(Bonferroni corrected Pvalue)
DPB1*05:01 52.6% vs. 43.5% OR = 1.44 P =1.061024
3.061027 1.061026 OR = 2.34
P =4.761028
P =1.661026
DQB1*05:02 16.3% vs. 9.3% OR = 1.89 P =2.961026
3.061025 1.061025 OR = 2.00
P =4.361026
P =1.561024
DRB1*12:02 4.7% vs. 8.6% OR = 0.53 P =5.661024
1.161023 5.6
61024 OR = 0.51 P =4.961024
P =1.761022
DRB1*16:02 10.9% vs. 4.8% OR = 2.43 P =3.561027
8.961027 1.961027 OR = 2.63
P =1.661027
P =5.461026
aAllPvalues (except for those in the last column) reported were nominalPvalues. The study-wide significance cut-off nominalPvalue should be 0.00147 ( = 0.05/34,
which is the Bonferroni correction for a total of 34 tested alleles). The statistically significance level for Bonferroni correctedPvalue (reported in the last column) should be 0.05. OR, odds ratio.
andDRB1*16:02) of our alleles were reported as risk alleles in at least two studies, and one allele (DRB1*12:02) (, which showed protective effect in our case-control study but was unable to be replicated in our family-based study), was reported as a protective allele previously (Supplemental Table S1). Again, neither our family-based association study nor the literature review showed supports for alleles associated in Caucasian populations (Supple-mental Table S1 and Table S4).
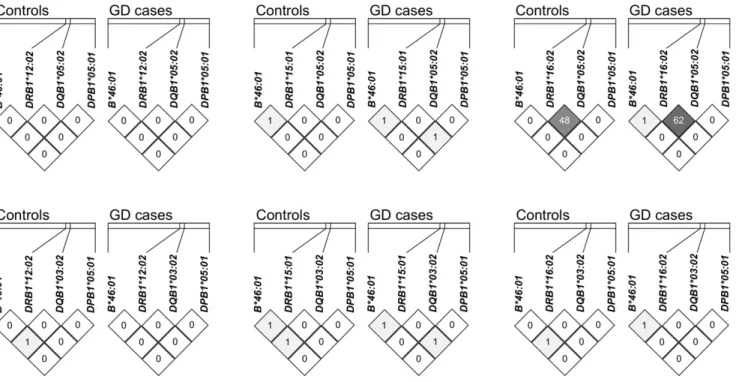
Dissection of individual effect of each associated allele It is well known that there are certain extended haplotypes across classical HLA loci [33]. In order to know if some of the observed associations represented the same association signal caused by linkage disequilibrium (LD), we therefore analyzed the LD between these 7 alleles (of 4 loci) with association signals (B*46:01 of the HLA-B locus; DRB1*12:02, DRB1*15:01 and DRB1*16:02 of the HLA-DRB1 locus; DQB1*03:02 and DQB1*05:02 of theHLA-DQB1 locus;DPB1*05:01 of the HLA-DPB1locus). The pairwise r2values of almost all allele pairs were ,0.02 (Figure 1), indicating that most of the association signals were independent from each other. The only exception was the LD between DQB1*05:02 and DRB1*16:02 (cases: r2= 0.62; controls: r2= 0.48) (Figure 1). Further analysis showed that all DRB1*16:02 alleles were on the DQB1*05:02-DRB1*16:02 haplotype, and the haplotype frequency was 4.77% in controls and 10.89% in GD cases (P= 3.5061027). On the other hand, those chromosomes containingDQB1*05:02but not carrying this haplotype showed similar frequencies in controls (4.57%) and cases (5.44%) (P= 0.383). Therefore, the observed association of DQB1*05:02 is secondary to its LD with DRB1*16:02, and by itselfDQB1*05:02did not confer independent susceptibility.
HLA-DPB1*05:01confers susceptibility through a dominant mode of effect
It is not clear previously whether HLA alleles confer susceptibility/protective effect to GD through a dominant, additive or recessive mode. We found that the subjects with one DPB1*05:01 allele (OR = 2.37, 95% confidence interval [CI] =
1.72–3.62) and those with two alleles (OR = 2.25, CI = 1.51– 3.34) had similar OR compared to the individuals with zero allele, suggesting thatHLA-DPB1*05:01confers susceptibility through a dominant mode of inheritance (Table 3). For other alleles, the allele frequencies were not high enough for us to perform similar analyses. It is noteworthy thatDPB1*05:01showed deviation from Hardy-Weinberg (HW) equilibrium in GD cases (P= 1.6610210) but not in controls (P= 0.14) (Table 3). There were more heterozygotes in the unrelated GD cases than expected under HW equilibrium, which is compatible with the dominant mode. TheDPB1*05:01genotypes from the family sample also showed similar HW disequilibrium pattern with increased heterozygotes in probands (P= 0.0059), but not in family founders (P= 0.67) (Table 3).
Sizeable population-attributable risk percentage of these HLA alleles
These HLA alleles conferred sizeable population-attributable risk percentage (PAR%) for GD (Table 4). DPB1*05:01 singly accounts for 48.4% of population-attributable risk. We built a logistic regression model for Chinese Han population in Taiwan based on the data of these 6 alleles and gender, and the area under curve of the receiver operating characteristic (ROC) curve was 0.75 (Figure 2). Examining the PAR% (Table 4) and logistic regression models (data not shown) further supported that the association signal from DQB1*05:02 was due to its LD with DRB1*16:02.
Discussion
Association analysis is powerful for genetic mapping, but has been criticized for frequent spurious signals resulted from population stratification. The ways to ensure more robust results include using family-based samples and/or getting independent replications. Herein we report convincing data using both ways. Before our study, HLA-B*46 might be the only HLA allele associated with GD with good replications in Asians [8,11,19]. In this study, we establish the paramount role of one allele (
HLA-Table 2.Replication with our family-based study and/or previous studies in Asians.
HLA allele
Case-control study under dominant model (nominalP value)
Family-based study under dominant model
(nominalPvalue)
CombinedPvalue (nominalPvalue)
CombinedPvalue (Bonferroni correctedPvalue)
Positive results in previous studies in Asian populationsa
B*46:01 4.961022 5.561023 3.461024 1.261022 Chanet al. 1978 [20]; Hawkinset al, 1985 [21]; Yeoet al. 1989 [22]; Donget al. 1992 [23]; Inoueet al. 1992 [24]; Onumaet al. 1994 [25]; Cavenet al. 1994 [26]; Huanget al. 2003 [19]; Parket al. 2005 [27]
DPB1*05:01 4.761028 7.3
61025 7.6
610212 2.6
610210 Donget al. 1992 [23]; Onumaet al. 1994 [25];
Takahashiet al. 2006 [28].
DQB1*03:02 8.961023(Pro)b 4.761022(Pro) 5.861024(Pro) 2.061022 Nil
DQB1*05:02c 4.3
61026 8.0
61021(Pro) 4.7
61025 1.6
61023 Parket al. 2005 [27]; Wongsurawatet al. 2006
[29]
DRB1*15:01 2.861023 4.961022 3.661024 1.261022 Nil
DRB1*16:02 1.661027 6.5
61021 4.3
61027 1.5
61025 Parket al. 2005 [27]; Wongsurawatet al. 2006
[29]
aThe more detailed summary of previous Asian HLA-GD association studies can be found in Supplemental Table S1. bThe annotation ‘‘(Pro)’’ indicates ‘‘protective’’ effect.
cAlthoughDQB1*05:02got association signals from multiple independent studies, we consider these association signals were caused by the linkage disequilibrium
DPB1*05:01), discover two novel associated alleles (DQB1*03:02 and DRB1*15:01), provide convincing replications of other three alleles (B*46:01, DRB1*12:02 and DRB1*16:02), and exclude independent effect of one allele (DQB1*05:02). We consider these 6 alleles to be genuine susceptibility/protective HLA alleles in our ethnic Chinese population, and probably in other Asian populations.
A recent geoepidemiology review [6] demonstrated that, unlike other autoimmune diseases (such as type 1 diabetes, multiple
sclerosis and inflammatory bowel disease) which in general have higher prevalence in Caucasians, Graves’ disease seems to have slightly higher prevalence in Asians. Be the relatively high prevalence of GD caused by genetic factors or environmental factors (or the interplay of both) is still an open question. However, the well-established HLA risk alleles of GD in Caucasians ( HLA-DRB1*03, C*03, C*07, C*16) have either low or extremely low allele frequencies in Asians [33,34]. The risk allele ofPTPN22, a major autoimmune susceptibility gene of GD and several other
Table 3.Analysis ofDPB1*05:01genotype distribution and odds ratio.
X/Xa 05:01/Xa 05:01/05:01a Hardy-Weinberg equilibrium
test
Founders (Family samples)
66 (23.1%)b 146 (51.2%) 73 (25.6%) P= 0.67
Probands (Family samples)
24 (14.5%) 99 (60.0%) 42 (25.5%) P= 5.961023
Controls
(Unrelated samples)
151 (30.0%) 264 (52.5%) 88 (17.5%) P= 0.14
Cases
(Unrelated samples)
77 (15.5%) 319 (64.2%) 101 (20.3%) P= 1.6610210
Odds ratioc
(X/X as reference)
Reference 2.37
CI (1.72–3.26)
2.25 CI (1.51–3.34)
Odds ratio (X/0501 as reference)
0.42 CI (0.31–0.58)
Reference 0.95
CI (0.68–1.32)
a‘‘X’’ indicates ‘‘anyDPB1allele except forDPB1*05:01’’. Therefore X/X means zeroDPB1*05:01allele,05:01/X means oneDPB1*05:01allele and05:01/05:01means two
DPB1*05:01alleles.
bForDPB1*05:01genotype distribution of 4 different groups of individuals (4 different rows), each cell is presented as count of individuals of that specific genotype
followed by the row percentage (inside the parenthesis).
cOdds ratio is calculated based on unrelated cases and unrelated controls. CI, 95% confidence interval.
doi:10.1371/journal.pone.0016635.t003
Figure 1. Linkage disequilibrium analysis ofHLA-B,HLA-DRB1,HLA-DQB1andHLA-DPB1alleles showing significant associations with GD.The distances between consecutive loci are approximately 1225 Kb, 81 kb and 416 Kb respectively. The r2value (
6100) of any allele pair was
plotted inside the corresponding cell. Except for strong linkage disequilibrium (r2= 0.48 in controls, r2= 0.62 in cases) betweenDRB1*16:02and DQB1*05:02, in general the r2value between other alleles was quite low.
autoimmune diseases in Caucasians, is non-polymorphic in Asians [35,36]. Therefore, it is obvious that the genetic landscapes of GD in Asians and in Caucasians are quite different. However, even after decades of research, the major susceptibility/protective genes of GD in Asians were still unclear. Our current study establishes the major role ofHLA-DPB1*05:01(PAR% = 48.4%), discovers two novel associated HLA alleles, and confirms three other HLA alleles. We believe that, after our current work and a careful comprehensive review of earlier GD association studies in Asians, the missing genetic ‘‘dark matter’’ in Asians is beginning to be observed.
Not all of the associated alleles in our case-control study were replicated in our family-based association test. Admittedly, the sample size of our family collection, although among the largest GD family collections worldwide, was still not big enough to always detect genuine association alleles with moderate effect sizes. Furthermore, due to the stochastic nature of sample collection in association study, any two independent studies (even with the same theoretical statistical power) may not detect the same association signals. In this current manuscript, for those alleles that could not be directly replicated in our family-based association test, at least the directions of effects were the same (both susceptible or both protective in our case-control study and family-based study)
Figure 2. Receiver operating characteristics (ROC) curve for the logistic regression model. Disease = 23.6802+0.44876B*46:01+ 0.88836DPB1*05:01 – 0.34946DQB1*03:02 – 0.4926DRB1*12:02+0.83886DRB1*15:01+1.07276DRB1*16:02+1.58656Female. The logistic
regression model was built based on the data from our unrelated case-control study individuals. Genotypes were coded following a dominant inheritance mode. The area under curve (AUC) of this ROC curve is 0.75.
doi:10.1371/journal.pone.0016635.g002
Table 4.Population-attributable risk percentage of seven associated alleles and one haplotype under dominant model.
HLA allele or haplotype
Frequency of
(AA+Aa)a Odds ratiob PAR%c
B*46:01 25.2% 1.33 7.7%
DPB1*05:01 70.0% 2.34 48.4%
DQB1*03:02 17.3% 0.62 27.1%
DRB1*12:02 16.7% 0.51 28.9%
DRB1*15:01 12.9% 1.68 8.1%
DRB1*16:02d 9.3% 2.63 13.3%
DQB1*05:02-DRB1*16:02d 9.3% 2.65 13.3%
DQB1*05:02d 17.9% 2.01 15.3%
aHomozygotes or heterozygotes for the specific allele of interest. This kind of
coding is to test PAR% under dominant model.
bOdds ratio under dominant model.
cPAR% would be a negative value when the allele is protective.
dThe PAR% values ofDQB1*05:02,DRB1*16:02and theDQB1*05:02-DRB1*16:02
haplotype are very similar. A single susceptibility allele (most likelyDRB1*16:02, please see the main text for details) is responsible for the risk, and therefore these three PAR% should only be counted once.
(Table 2), and support from previous studies in Asians could be found (also with the same directions of effects) (Table 2). The ultimate proof will rely on future association studies and/or functional assays.
Direct genotyping of classical HLA alleles (instead of using nearby SNPs as surrogates) is expensive and requires special techniques. Considering the aspects of sample size, genotyping resolution and loci coverage, to our knowledge this current study has hitherto been the most ambitious design worldwide for HLA association study with GD. While the advantages of big sample size and good genotyping resolution are self-evident, the importance of comprehensive loci coverage can not be over-emphasized. Possible linkage disequilibrium between HLA loci has been a thorny issue when researchers tried to identify the genuine locus responsible for the association signal [11,15,17]. We consider it crucial to examine as many classical HLA loci as possible in a single study, which may provide an opportunity to delineate the contribution of each locus. In this study, we genotyped 6 classical HLA loci (HLA-A,-B,-C,-DPB1,-DQB1and-DRB1) for all participants, a design rarely found in previous HLA-GD association studies in Asians (Supplemental Table S1) or in Caucasians [11,15]. Because of the comprehensive locus coverage, we uncovered that the association signal fromHLA-DQB1*05:02was secondary to its LD with HLA-DRB1*16:02. After careful analysis, we reported 6 susceptibility/protective alleles, each of them representing indepen-dent association signals. We did not includeDQA1orDRB3,4,5in this study, partly because of the unavailability of genotyping kits and partly because that their LD with correspondingDQB1 or DRB1 alleles would be too tight to be delineated.
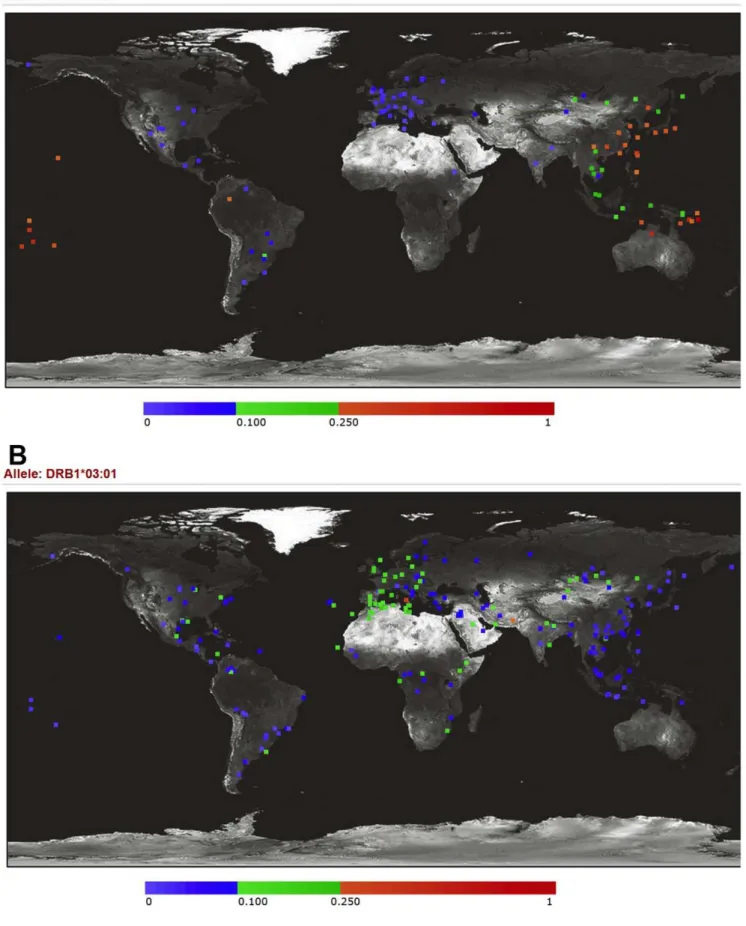
DPB1*05:01has a large effect size (OR = 2.34, under dominant model) and a very high PAR% (48.4%) in our study. It is curious why the association ofDPB1*05:01has not been addressed earlier. The association ofDPB1*05:01and GD has not been detected in Caucasians, probably because of low allele frequency (mostly,5% in Caucasians) (Figure 3) [33,34]. In Asians, the wholeHLA-DPB1 locus was simply overlooked for more than a decade. In 1992 and 1994, three published studies [23–25] covered the HLA-DPB1 locus in their study design, and actually two (Donget al.[23] and Onuma et al. [25]) of the three reported DPB1*05:01 as a susceptibility allele. However, none of later studies incorporated theHLA-DPB1locus for association tests, with the only exception that in 2006 Takahashiet al.[28] (from the same research team as the Dong et al. [23] paper) reported their results (Table 1 and Supplemental Table S1). This again justifies our approach to insist on comprehensive loci coverage across the whole HLA region instead of only focusing on certain ‘‘promising’’ loci. Although having been overlooked in the GD research field for more than a decade,HLA-DPB1*05:01was shown to be associated with several other immune-related phenotypes/diseases such as multiple sclerosis [37], primary biliary cirrhosis [38] and chronic hepatitis B infection [39], which, to some degree, supports thatDPB1*05:01 is an HLA allele with pertinent biological significance.
It has not escaped our notice that of the four susceptibility alleles reported in this current GD study, two are well-known susceptibility alleles of multiple sclerosis (MS) (DRB1*15:01 of the conventional MS worldwide [40] and DPB1*05:01 of the opticospinal MS in Asians [37]). Some (but not all) previous studies [41] supported that GD and MS might co-occur at greater than expected rates within proband patients or their families. It would be intriguing to explore if there are common pathogenesis pathways between these two diseases.
It seems to be counterintuitive that the spectra of susceptibility/ protective HLA alleles of GD are completely different between Caucasians and Asians. The main reason for this probably is the difference in allele frequencies. The most prominent susceptibility
allele in Caucasians,DRB1*03:01, has a much lower frequency in Asians, ranging from,3% in Japanese and Koreans to 4–9% in Chinese (Figure 3) [33,34] while of the six alleles we report here, four (B*46:01,DPB1*05:01,DRB1*12:02andDRB1*16:02) have very low frequencies in Caucasians (Figure 3) [33,34]. There have been several examples that certain susceptibility/protective alleles of genes for other autoimmune diseases varied in frequencies across populations [36,37].
Genetic study, aside from testing existed hypothesis, has a special capability of generating new hypothesis. Difference of susceptibility/protective alleles across populations provides a great opportunity for investigating the mechanism how HLA molecules get involved in GD pathogenesis. At least partly inspired by the successful examples of the ‘‘shared epitope hypothesis’’ for pathogenesis of rheumatoid arthritis or type 1 diabetes mellitus [36,42,43], it has been postulated that arginine at position 74 of the HLA-DRB1 chain is critical for GD pathogenesis [44], mostly based on the association findings from studies conducted in Caucasians. However, the residues at position 74 of DRB1*15:01 and DRB1*16:02 reported in our association study are both alanine [45], which is the common residue at this position considered to be neutral for GD risk [44]. Further we also found susceptibility/protective alleles at class I loci, and other class II alleles. Accounting for all available evidence, we propose that the HLA region critical for GD pathogenesis is not only limited to position 74 of the DRB1 molecule. We did not find a single sequence ‘‘signature’’ which can explain all the associated HLA alleles identified in Caucasians and Asians. Comparison of the 3-D structure of various associated alleles and careful examination of joint effect of more than one HLA molecules might provide better hints for future study.
In summary, we report the results of our case-control and family-based GD-HLA association tests, with some strong supporting evidence from previous studies in Asians. The associated alleles are quite different from those discovered in Caucasians. HLA-DPB1*05:01 is the major gene of GD in our population, and a total of 6 susceptibility/protective alleles account for sizeable population-attributable risk. Identification of population-specific association alleles is the critical first step for individualized medicine. Furthermore, comparison between dif-ferent susceptibility/protective alleles across populations could facilitate generation of novel hypothesis about GD pathophysiol-ogy and indicate a new direction for future investigation.
Materials and Methods
Ethics statement
The study was approved by the Institutional Review Board of National Taiwan University Hospital. Written informed consent was obtained from all GD patients and their relatives who participated in this project. The population-based unrelated controls were from the ‘‘Han Chinese Cell and Genome Bank in Taiwan’’ [46].
Participant enrollment and diagnosis
Figure 3. Allele frequency variations ofHLA-DPB1*05:01andHLA-DRB1*03:01across worldwide populations.The allele frequencies (6100%) are presented with different colors, shown as the color bar below the figure. (A)HLA-DPB1*05:01, the major GD susceptibility allele we
included in order to avoid heterogeneity in genetic background. GD patients were recruited from individuals attending the outpatient clinic of National Taiwan University Hospital or affiliated Far Eastern Polyclinics. Pedigrees were ascertained through a GD proband. All the individuals enrolled in this study were interviewed and assessed by board-certified endocrinologists. The population-based unrelated controls were from the ‘‘Han Chinese Cell and Genome Bank in Taiwan’’ [46]. As in other GD studies, our unrelated cases showed a higher proportion of females (82.2%) than males. The average age of unrelated GD cases was 41.9 years (s.d. = 12.4 years), and of unrelated controls was 55.7 years (s.d. = 18.5 years).
Genotyping
For samples in our case-control study, we determinedHLA-A, -B,-C,-DQB1and-DRB1genotypes using the Dynal RELI SSO typing kits (Dynal biotech Ltd, Bromborough, Wirral, U.K., now part of Life Technologies, Carlsbad, CA, USA) (http://www. invitrogen.com/) according to manufacturer’s instructions. Briefly, polymerase chain reactions (PCR) using locus-specific primer sets were applied to amplify both exon 2 and exon 3 of class I (HLA-A, -Band-C) genes or exon 2 of class II(-DQB1and-DRB1) genes. Subsequently, PCR products were hybridized with sequence-specific oligonucleotide (SSO) probes previously fixed in a linear array on a nylon membrane (HLA-A: 48 probes,-B: 61 probes,-C: 37 probes, -DQB1: 41 probes and -DRB1: 60 probes). We then interpreted the genotypes using the Pattern Matching program (Dynal biotech Ltd). Due to the lack ofDPB1genotyping kit in the Dynal RELI SSO system, we genotypedHLA-DPB1based on a sequence-specific primer (SSP) amplification method using ‘‘Gold SSPHLA-DPB1High resolution Kit’’ (Invitrogen Corp., now part of Life Technologies, Carlsbad, CA, USA) (http://www.invitrogen. com) according the manufacturer’s protocol. Briefly, forty-eight PCR reactions were performed for each DNA sample. After PCR amplification and electrophoresis, the patterns of positive amplifi-cations were used to interpret HLA-DPB1 genotypes with the company’s UniMatch software (Invitrogen Corp.).
For samples in our family-based study, we performed genotyping for all these 6 HLA loci using a different platform, the LABType SSO kit (One lambda Inc., Canoga Park, CA, USA) (http://www.onelambda.com/), in order to prevent potential spurious association caused by the same platform-related geno-typing error. Briefly, PCR products were hybridized with probes bound to fluorescently coded micro-spheres (HLA-A: 58/61/63 probes,-B: 100 probes,-C: 56 probes,-DPB1: 40 probes,-DQB1: 37 probes and-DRB1: 70 probes). Subsequently, a flow analyzer was used to identify the fluorescent intensity on each micro-sphere (LABType visual software; One lambda Inc.) and assignment of HLA genotype was obtained based on the reaction pattern.
Ambiguity, which refers to the same reaction patterns produced by several genotype combinations [47], was dealt with by assigning allele genotypes according to common alleles (allele frequency .0.01) found in Taiwanese population [48] and southern Chinese populations [33,34] as determined in the population studies of the 13thinternational histocompatibility workshop.
Statistical analysis
At any HLA loci, there are multiple alleles. We followed the common practice of most HLA association studies and coded tested alleles in a 2-allele format. For example, when we performed statistic tests for HLA-B*46:01, the allele was either coded as ‘‘HLA-B*46:01’’ or ‘‘X’’ (which meant any other possible alleles at the HLA-B locus). Consequently, in this example, the
genotype of an individual would be coded as one of the three: B*46:01/B*46:01,B*46:01/X or X/X.
For the case-control study (499 unrelated GD cases and 504 unrelated controls), we tested each of the 34 common HLA alleles (with allele frequency greater than 5%) with 1-degree-of-freedom (d.f.) allelic test, 2-d.f. genotypic test, 1-d.f. Cochran-Armitage trend test, 1-d.f. dominant logistic regression model and 1-d.f. gender-adjusted dominant logistic regression model, using PLINK [49] v1.07 (http://pngu.mgh.harvard.edu/purcell/plink/) or SAS v9.2 (http://www.sas.com). For completeness, we calculated both nominalPvalues and Bonferroni correctedPvalues. Considering that 34 alleles were tested, regardless of possible linkage disequilibrium between certain alleles, the most conservative study-wide significance cut-off nominal P value for Bonferroni correction should be 0.0015 ( = 0.05/34). For all of our main results, we reported Bonferroni corrected P values, which were nominal P values multiplied by 34, the number of measures being tested [50,51]. Bonferroni corrected P values smaller than 0.05 were considered statistically significant [50,51].
For the results to be robust, we reported Bonferroni correctedP values as our main results in the text as well as in the Tables. However, for the purpose of comprehensiveness, we also kept some nominalPvalues in certain columns of the Tables.
For the family study (419 GD cases and their 282 family members in 165 extended pedigrees), we applied PedCheck v1.1 to check for genotyping error under the known family structure. We then used family-based association test [52] (FBAT) v1.7.3 (http://www. biostat.harvard.edu/,fbat/default.html) for association analyses. A dominant model was chosen based on our observation that HLA alleles (at leastDPB1*05:01shown in our analysis) might exert the effect in a dominant mode. We applied the ‘‘-e’’ option in FBAT to produce the empirical variance and make the test robust to the presence of linkage [52].
We calculated combined P values (combination of our case-control study and our family-based association test) based on the method described by de Bakkeret al.[53]. Briefly, z statistics were calculated based on the individual originalPvalues, then summed up after considering the effect direction and weighting, and then converted back to get the combined P value. Appropriate weighting and effective sample sizes were derived from PBAT [54] and Genetic Power Calculator [55] based on the allele frequency and OR of the controls and family founders [53]. Again, nominalP values smaller than 0.0015 or Bonferroni correctedP values smaller than 0.05 were considered statistically significant.
We analyzed the linkage disequilibrium (LD) patterns between those 7 alleles with association signals (B*46:01 of the HLA-B locus;DRB1*12:02, DRB1*15:01 and DRB1*16:02 of the HLA-DRB1 locus; DQB1*03:02 and DQB1*05:02 of the HLA-DQB1 locus;DPB1*05:01of theHLA-DPB1locus) using HaploView v4.1 (http://www.broadinstitute.org/haploview/haploview) and the SAS HAPLOTYPE procedure. By definition, LD is a measure-ment between alleles at different loci (for example, between B*46:01 and DRB1*12:02); therefore we did not try to find if alleles of the same locus (for example, DRB1*12:02 and DRB1*15:01) co-existed too often or too rarely.
We estimated the population attributable risk percentage (PAR%) for the susceptibility/protective genotypes using the formula [56]:
PAR%~½Pe|ðRR{1Þ=f½Pe|ðRR{1Þz1g
low prevalence (1–1.6%) of GD [2,3],Pecan be estimated based on the genotype frequencies in healthy controls, and RR can be approximated by OR of the risk genotypes [56].
Supporting Information
Table S1 Summary of HLA association studies of Graves’ disease preformed in Asian populations.
(DOC)
Table S2 A full list of HLA genotype counts and frequencies in 499 unrelated Graves’ disease cases and 504 unrelated controls. (DOC)
Table S3 Association results (from 499 Graves’ disease cases and 504 controls) of all the 34 alleles with allele frequency greater than 5%.
(DOC)
Table S4 Association results of family-based association test.
(DOC)
Acknowledgments
We express our heartfelt gratitude to all the GD patients and their families who graciously agreed to participate in the study. We thank Drs. David Valle and Dimitrios Avramopoulos for helpful discussion. We thank the National Clinical Core, Academia Sinica, Taipei, Taiwan, for providing DNA samples.
Author Contributions
Conceived and designed the experiments: P-LC CS-JF W-SY T-CC. Performed the experiments: LC C-C Chu T-CC. Analyzed the data: P-LC CS-JF C-C Chu C-C Chang H-YH S-WC ML. Contributed reagents/ materials/analysis tools: CS-JF C-C Chu ML W-SY. Wrote the paper: P-LC CS-JF W-SY T-CC.
References
1. Weetman AP (2000) Graves’ disease. N Engl J Med 343: 1236–1248. 2. Tunbridge WM, Evered DC, Hall R, Appleton D, Brewis M, et al. (1977) The
spectrum of thyroid disease in a community: the Whickham survey. Clin Endocrinol (Oxf) 7: 481–493.
3. Jacobson DL, Gange SJ, Rose NR, Graham NM (1997) Epidemiology and estimated population burden of selected autoimmune diseases in the United States. Clin Immunol Immunopathol 84: 223–243.
4. Brix TH, Kyvik KO, Hegedus L (1998) What is the evidence of genetic factors in the etiology of Graves’ disease? A brief review. Thyroid 8: 727–734. 5. Brix TH, Kyvik KO, Christensen K, Hegedus L (2001) Evidence for a major
role of heredity in Graves’ disease: a population-based study of two Danish twin cohorts. J Clin Endocrinol Metab 86: 930–934.
6. Shapira Y, Agmon-Levin N, Shoenfeld Y (2010) Defining and analyzing geoepidemiology and human autoimmunity. Journal of Autoimmunity 34: J168–J177.
7. Simmonds MJ, Howson JM, Heward JM, Cordell HJ, Foxall H, et al. (2005) Regression mapping of association between the human leukocyte antigen region and Graves disease. Am J Hum Genet 76: 157–163.
8. Tomer Y, Davies TF (2003) Searching for the autoimmune thyroid disease susceptibility genes: from gene mapping to gene function. Endocr Rev 24: 694–717.
9. Jacobson EM, Huber A, Tomer Y (2008) The HLA gene complex in thyroid autoimmunity: from epidemiology to etiology. J Autoimmun 30: 58–62. 10. Heward JM, Allahabadia A, Daykin J, Carr-Smith J, Daly A, et al. (1998)
Linkage disequilibrium between the human leukocyte antigen class II region of the major histocompatibility complex and Graves’ disease: replication using a population case control and family-based study. J Clin Endocrinol Metab 83: 3394–3397.
11. Simmonds MJ, Gough SC (2004) Unravelling the genetic complexity of autoimmune thyroid disease: HLA, CTLA-4 and beyond. Clin Exp Immunol 136: 1–10.
12. Taylor JC, Gough SC, Hunt PJ, Brix TH, Chatterjee K, et al. (2006) A genome-wide screen in 1119 relative pairs with autoimmune thyroid disease. J Clin Endocrinol Metab 91: 646–653.
13. Chen PL, Fann CS, Chang CC, Wu IL, Chiu WY, et al. (2007) Linkage of Graves’ disease to the human leucocyte antigen region in the Chinese-Han population in Taiwan. Clin Endocrinol (Oxf) 66: 646–651.
14. Weetman AP (2009) The genetics of autoimmune thyroid disease. Horm Metab Res 41: 421–425.
15. Ayadi H, Hadj Kacem H, Rebai A, Farid NR (2004) The genetics of autoimmune thyroid disease. Trends Endocrinol Metab 15: 234–239. 16. The Wellcome Trust Case Control Consortium & The
Australo-Anglo-American Spondylitis Consortium (2007) Association scan of 14,500 nonsynon-ymous SNPs in four diseases identifies autoimmunity variants. Nat Genet 39: 1329–1337.
17. Simmonds MJ, Howson JM, Heward JM, Carr-Smith J, Franklyn JA, et al. (2007) A novel and major association of HLA-C in Graves’ disease that eclipses the classical HLA-DRB1 effect. Hum Mol Genet 16: 2149–2153.
18. Marsh SG, Albert ED, Bodmer WF, Bontrop RE, Dupont B, et al. (2010) Nomenclature for factors of the HLA system, 2010. Tissue Antigens 75: 291–455.
19. Huang SM, Wu TJ, Lee TD, Yang EK, Shaw CK, et al. (2003) The association of HLA -A, -B, and -DRB1 genotypes with Graves’ disease in Taiwanese people. Tissue Antigens 61: 154–158.
20. Chan SH, Yeo PP, Lui KF, Wee GB, Woo KT, et al. (1978) HLA and thyrotoxicosis (Graves’ disease) in Chinese. Tissue Antigens 12: 109–114.
21. Hawkins BR, Ma JT, Lam KS, Wang CC, Yeung RT (1985) Association of HLA antigens with thyrotoxic Graves’ disease and periodic paralysis in Hong Kong Chinese. Clin Endocrinol (Oxf) 23: 245–252.
22. Yeo PP, Chan SH, Thai AC, Ng WY, Lui KF, et al. (1989) HLA Bw46 and DR9 associations in Graves’ disease of Chinese patients are age- and sex-related. Tissue Antigens 34: 179–184.
23. Dong RP, Kimura A, Okubo R, Shinagawa H, Tamai H, et al. (1992) HLA-A and DPB1 loci confer susceptibility to Graves’ disease. Hum Immunol 35: 165–172.
24. Inoue D, Sato K, Enomoto T, Sugawa H, Maeda M, et al. (1992) Correlation of HLA types and clinical findings in Japanese patients with hyperthyroid Graves’ disease: evidence indicating the existence of four subpopulations. Clin Endocrinol (Oxf) 36: 75–82.
25. Onuma H, Ota M, Sugenoya A, Inoko H (1994) Association of HLA-DPB1*0501 with early-onset Graves’ disease in Japanese. Hum Immunol 39: 195–201.
26. Cavan DA, Penny MA, Jacobs KH, Kelly MA, Jenkins D, et al. (1994) The HLA association with Graves’ disease is sex-specific in Hong Kong Chinese subjects. Clin Endocrinol (Oxf) 40: 63–66.
27. Park MH, Park YJ, Song EY, Park H, Kim TY, et al. (2005) Association of HLA-DR and -DQ genes with Graves disease in Koreans. Hum Immunol 66: 741–747.
28. Takahashi M, Yasunami M, Kubota S, Tamai H, Kimura A (2006) HLA-DPB1*0202 is associated with a predictor of good prognosis of Graves’ disease in the Japanese. Hum Immunol 67: 47–52.
29. Wongsurawat T, Nakkuntod J, Charoenwongse P, Snabboon T, Sridama V, et al. (2006) The association between HLA class II haplotype with Graves’ disease in Thai population. Tissue Antigens 67: 79–83.
30. Cho BY, Rhee BD, Lee DS, Lee MS, Kim GY, et al. (1987) HLA and Graves’ disease in Koreans. Tissue Antigens 30: 119–121.
31. Wong GW, Cheng SH, Dorman JS (1999) The HLA-DQ associations with Graves’ disease in Chinese children. Clin Endocrinol (Oxf) 50: 493–495. 32. Tsai KS, Hsieh RP, Chang CC, Chen FW, Lee SC (1989) Association of
HLA-DR tissue types with Graves’ disease in Taiwan. Taiwan Yi Xue Hui Za Zhi 88: 336–341.
33. Middleton D, Menchaca L, Rood H, Komerofsky R (2003) New allele frequency database: http://www.allelefrequencies.net. Tissue Antigens 61: 403–407. 34. Meyer D, Single RM, Mack SJ, Lancaster A, Nelson MP, et al. (2006) Single
locus polymorphism of classical HLA genes. In: Hansen JA, ed. Immunobiology of the Human MHC. Seattle, Washington, USA: International Histocompat-ibility working group press. pp 653–704.
35. Mori M, Yamada R, Kobayashi K, Kawaida R, Yamamoto K (2005) Ethnic differences in allele frequency of autoimmune-disease-associated SNPs. J Hum Genet 50: 264–266.
36. Kochi Y, Suzuki A, Yamada R, Yamamoto K (2010) Ethnogenetic heterogeneity of rheumatoid arthritis-implications for pathogenesis. Nat Rev Rheumatol 6: 290–295.
37. Kira J (2003) Multiple sclerosis in the Japanese population. Lancet Neurol 2: 117–127.
38. Seki T, Kiyosawa K, Ota M, Furuta S, Fukushima H, et al. (1993) Association of primary biliary cirrhosis with human leukocyte antigen DPB1*0501 in Japanese patients. Hepatology 18: 73–78.
39. Kamatani Y, Wattanapokayakit S, Ochi H, Kawaguchi T, Takahashi A, et al. (2009) A genome-wide association study identifies variants in the HLA-DP locus associated with chronic hepatitis B in Asians. Nat Genet 41: 591–595. 40. Svejgaard A (2008) The immunogenetics of multiple sclerosis. Immunogenetics
41. Sloka JS, Phillips PW, Stefanelli M, Joyce C (2005) Co-occurrence of autoimmune thyroid disease in a multiple sclerosis cohort. J Autoimmune Dis 2: 9.
42. Gregersen PK, Silver J, Winchester RJ (1987) The shared epitope hypothesis. An approach to understanding the molecular genetics of susceptibility to rheumatoid arthritis. Arthritis Rheum 30: 1205–1213.
43. Cucca F, Lampis R, Congia M, Angius E, Nutland S, et al. (2001) A correlation between the relative predisposition of MHC class II alleles to type 1 diabetes and the structure of their proteins. Hum Mol Genet 10: 2025–2037.
44. Ban Y, Davies TF, Greenberg DA, Concepcion ES, Osman R, et al. (2004) Arginine at position 74 of the HLA-DR beta1 chain is associated with Graves’ disease. Genes Immun 5: 203–208.
45. Robinson J, Waller MJ, Parham P, de Groot N, Bontrop R, et al. (2003) IMGT/ HLA and IMGT/MHC: sequence databases for the study of the major histocompatibility complex. Nucleic Acids Res 31: 311–314.
46. Pan WH, Fann CS, Wu JY, Hung YT, Ho MS, et al. (2006) Han Chinese cell and genome bank in Taiwan: purpose, design and ethical considerations. Hum Hered 61: 27–30.
47. Erlich HA, Opelz G, Hansen J (2001) HLA DNA typing and transplantation. Immunity 14: 347–356.
48. Chu CC, Trejaut J, Lee HL, Chang SL, Lin M (2006) Anthropology/human genetic diversity population reports: Tainwan’s populations. In: Hansen JA, ed.
Immunobiology of the Human MHC. Seattle, Washington, USA: International Histocompatibility working group press. pp 611–615.
49. Purcell S, Neale B, Todd-Brown K, Thomas L, Ferreira MA, et al. (2007) PLINK: a tool set for whole-genome association and population-based linkage analyses. Am J Hum Genet 81: 559–575.
50. Wright SP (1992) Adjusted P-values for simultaneous inferences. Biometrics 48: 1005–1013.
51. Westfall PH, Young SS, Wright SP (1993) On adjusting P-values for multiplicity. Biometrics 49: 941–945.
52. Laird NM, Horvath S, Xu X (2000) Implementing a unified approach to family-based tests of association. Genet Epidemiol 19(Suppl 1): S36–42.
53. de Bakker PI, Ferreira MA, Jia X, Neale BM, Raychaudhuri S, et al. (2008) Practical aspects of imputation-driven meta-analysis of genome-wide association studies. Hum Mol Genet 17: R122–128.
54. Lange C, Laird NM (2002) Power calculations for a general class of family-based association tests: dichotomous traits. Am J Hum Genet 71: 575–584. 55. Purcell S, Cherny SS, Sham PC (2003) Genetic Power Calculator: design of
linkage and association genetic mapping studies of complex traits. Bioinformatics 19: 149–150.