Preliminary Results of National Amyotrophic
Lateral Sclerosis (ALS) Registry Risk Factor
Survey Data
Leah Bryan
1☯*
, Wendy Kaye
2☯, Vinicius Antao
3☯, Paul Mehta
3☯, Oleg Muravov
3☯, D.
Kevin Horton
3☯1Carter Consulting Incorporated, Atlanta, GA, United States of America,2McKing Consulting Corporation, Atlanta, GA, United States of America,3Division of Toxicology and Human Health Sciences, Agency for Toxic Substances and Disease Registry, Atlanta, GA, United States of America
☯These authors contributed equally to this work.
Abstract
Background
The National ALS Registry is made up of two components to capture amyotrophic lateral
sclerosis (ALS) cases: national administrative databases (Medicare, Medicaid, Veterans
Health Administration and Veterans Benefits Administration) and self-identified cases
cap-tured by the Registry
’
s web portal. This study describes self-reported characteristics of U.S.
adults with ALS using the data collected by the National ALS Registry web portal risk factor
surveys only from October 19, 2010 through December 31, 2013.
Objective
To describe findings from the National ALS Registry
’
s web portal risk factor surveys.
Measurements
The prevalence of select risk factors among adults with ALS was determined by calculating
the frequencies of select risk factors
—
smoking and alcohol (non, current and former)
histo-ries, military service and occupational history, and family history of neurodegenerative
dis-eases such as ALS, Alzheimer
’
s and/or Parkinson
’
s.
Results
Nearly half of survey respondents were ever smokers compared with nearly 41% of adults
nationally. Most respondents were ever drinkers which is comparable to national
esti-mates. The majority were light drinkers. Nearly one-quarter of survey respondents were
veterans compared with roughly 9% of US adults nationally. Most respondents were
retired or disabled. The industries in which respondents were employed for the longest
time were Professional and Scientific and Technical Services. When family history of
neurodegenerative diseases in first degree relatives was evaluated against our
a11111
OPEN ACCESS
Citation:Bryan L, Kaye W, Antao V, Mehta P, Muravov O, Horton DK (2016) Preliminary Results of National Amyotrophic Lateral Sclerosis (ALS) Registry Risk Factor Survey Data. PLoS ONE 11(4): e0153683. doi:10.1371/journal.pone.0153683
Editor:David O. Carpenter, Institute for Health & the Environment, UNITED STATES
Received:September 11, 2015
Accepted:April 1, 2016
Published:April 28, 2016
Copyright:This is an open access article, free of all copyright, and may be freely reproduced, distributed, transmitted, modified, built upon, or otherwise used by anyone for any lawful purpose. The work is made available under theCreative Commons CC0public domain dedication.
Data Availability Statement:Data were obtained from the National ALS Registry and can be retrieved in the same way the authors received them. Interested researchers should contact the ALS Registry to request data accesshttps://wwwn.cdc. gov/als/ContactUS.aspx.
comparison group, the rates of ALS were similar, but were higher for Parkinson
’
s disease,
Alzheimer
’
s disease and any neurodegenerative diseases.
Conclusions
The National ALS Registry web portal, to our knowledge, is the largest, most geographically
diverse collection of risk factor data about adults living with ALS. Various characteristics
were consistent with other published studies on ALS risk factors and will allow researchers
to generate hypotheses for future research.
Introduction
Amyotrophic lateral sclerosis (ALS) is a progressive and fatal neuromuscular disease. Most
per-sons with ALS die within 2–5 years of becoming symptomatic [
1
]. Approximately 5–10% of
ALS cases are estimated to be familial, of which over a dozen genes and loci of major effect
have been identified [
2
]. The etiology of the remaining 90–95% of cases, commonly referred to
as sporadic ALS, has challenged researchers since the disease was first described in 1869 by
French neurologist Jean-Martin Charcot.
In October 2009, the United States (US) government launched its first and only
popula-tion-based country-wide ALS registry as mandated by the National ALS Registry Act (S.
1382). This National ALS Registry allows researchers to quantify the incidence and prevalence
of ALS in the United States, to describe the demographic characteristics of persons with ALS,
and to examine risk factors for the disease. The Registry takes a two-pronged approach for
tracking ALS cases in the United States by using 1) existing national administrative databases
(i.e., Medicare, Medicaid, Veterans Heath Administration, and Veterans Benefit
Administra-tion) utilizing records starting from October 19, 2010 and 2) a secure web portal, launched on
October 19, 2010, that allows patients to self-enroll [
3
]. During October 19, 2010–December
31, 2011, a total of 12,187 persons with ALS were identified by the National ALS Registry as
living with the disease [
4
].
Most of what is known about ALS risk factors comes from epidemiological studies;
how-ever, the strength of evidence determined by these studies tends to vary. Being Caucasian
(non-Hispanic), male, over 60 years, and having a family history of the disease are largely
thought to be risk factors for ALS [
1
,
4
–
6
]. Several studies have suggested an association
between occupational exposures and ALS. The most common exposures investigated are
pes-ticides or agricultural work [
7
–
14
], electromagnetic fields (EMF) [
8
,
15
–
20
], metals (e.g., lead,
selenium) [
12
,
14
,
21
–
25
], construction work [
21
], welding, soldering, and electric plating
[
24
], formaldehyde [
26
], and diesel exhaust [
27
]. In addition, veterinarians, athletes,
hair-dressers, and armed forces personnel are professions that have been associated with ALS in an
extensive systematic review [
28
]. Nutritional intake [
29
], exposure to infectious agents [
30
],
cigarette smoking [
31
], and physical activity and trauma [
32
] also have been identified as
pos-sible risk factors. While epidemiological studies are necessary for attempting to determine
ALS etiology, many studies contain a number of limitations for assessing the risk of
develop-ing the disease (e.g., small sample sizes, insufficient power, lack of representativeness, and
lim-ited geographic catchment areas).
Unlike previous studies of adults with ALS, the data utilized in this study are the largest
collection of risk factor data about adults with ALS. This facilitated a more comprehensive
examination of the characteristics among adults living with ALS than has been possible
McKing Consulting Corporation provided support in the form of salaries for authors LB and WK, but did not have any additional role in the study design, data collection and analysis, decision to publish, or preparation of the manuscript.
in past research. The primary objective of this paper is to describe the findings of risk factors
including cigarette smoking, alcohol consumption, military service history, occupational
history, and a family history of ALS completed via the National ALS Registry secure web
portal.
Methods
Data Collection
Risk factor data were collected using a survey created and validated by the Stanford University
School of Medicine’s ALS Consortium of Epidemiologic Studies (ACES) [
33
]. The survey was
divided into shorter modules to facilitate completion over time, because of the possible
physi-cal limitations of the study population. Survey data were collected via a secure web portal
from adults who have self-identified as having ALS. To verify ALS status, six questions proven
to be reliable indicators for accurate ALS diagnoses in the U.S. Department of Veterans
Affairs ALS registry were utilized [
34
]. Adults who satisfied the six validation questions were
asked to provide consent by checking a box after reading the consent form, register online
and participate in surveys. The study, including the consent form and consent procedures,
was reviewed and approved by the Centers for Disease Control and Prevention Institutional
Review Board (IRB).
Survey Participation
There were 6,911 adults (age 18 or older) who registered via secure online portal between
Octo-ber 19, 2010 and DecemOcto-ber 31, 2013. To calculate survey participation rates, the numOcto-ber of
adults who completed applicable surveys was divided by the number of registrants.
Participa-tion rates varied by survey module: demographics—54.0%; employment history—49.5%;
mili-tary service history—48.6%; cigarette smoking and alcohol consumption—48.1%; first-degree
relative history of ALS, Alzheimer’s disease or Parkinson’s disease diagnosis—46.0%.
Measures
implemented. Self-reported family history of select neurodegenerative diseases was defined
as having at least one first degree relative that has been diagnosed by a physician with ALS,
Alzheimer’s disease and/or Parkinson’s disease. First degree relatives were defined as parent,
sibling or child(ren). The occurrence of ALS, Alzheimer’s disease, Parkinson’s disease or any
of those neurodegenerative diseases among siblings of adults with ALS was calculated by
dividing the number of siblings with each condition by the total number of siblings. The rate
among first degree relatives was calculated similarly for the total number of children, siblings
and parents reported. Because a control group was not available for this study, the rates
among the aforementioned groups were then compared to similar measures found during
literature review [
6
]. Nationally representative estimates of risk factor prevalence among the
U.S. general population are presented when applicable. SAS
©9.3 was used to calculate the
prevalence of risk factors among adults with ALS [
36
].
Results
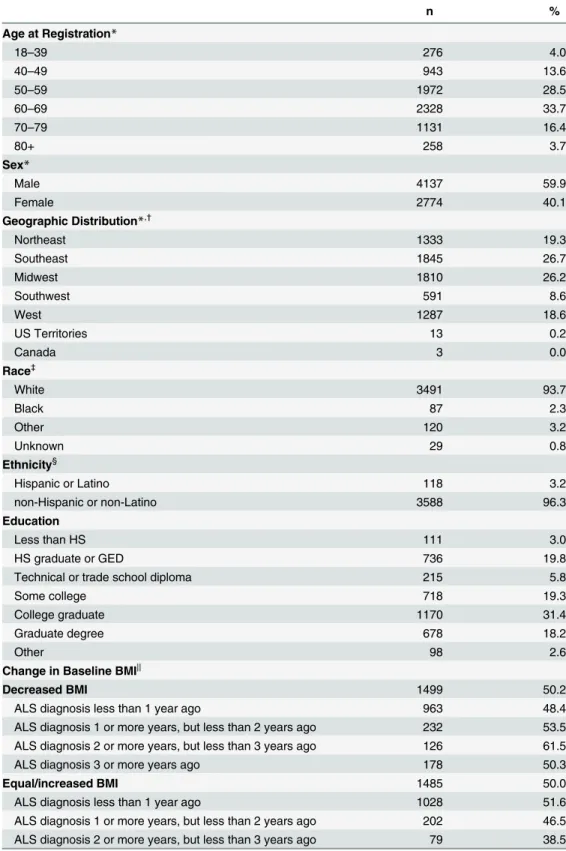
Demographic characteristics of web portal respondents are presented in
Table 1
. Most
respon-dents reported being 50–69 years of age at registration. Among survey participants, 94% were
white, 2% were black, 3% were Other and 60% were men. Most (96%) adults surveyed
self-identified as non-Hispanic or non-Latino. Of survey respondents, 72% had completed some
college or higher level of education. More than half of all survey responders reported currently
living in the Southeast or Midwest regions of the United States. Among survey respondents
who were older than 40 years and diagnosed after 40 years, half of respondents experienced a
decrease in BMI when compared to their baseline BMI measure. More respondents diagnosed
with ALS within two years but less than three experienced a decrease in BMI.
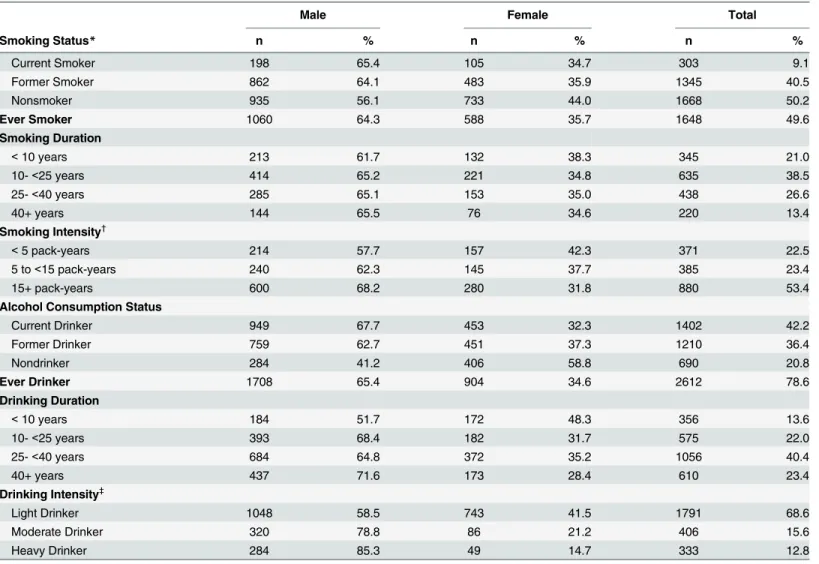
ALS risk behaviors are presented in
Table 2
. Among web portal survey respondents, rougly
half were smokers. More men were ever smokers. Overall, of the 50% of ever smokers, more
than 78% had smoked for more than 10 years and 76% smoked at least 5 pack-years. More
men were ever drinkers. Overall, a total of 79% of respondents reported ever drinking; 86%
drank at least one alcoholic beverage per month for more than 10 years. Approximately 69%
were light drinkers as measured by the number of alcoholic drinks per month.
History of military service is presented in
Table 3
. Veterans made up 24% of survey
respon-dents with 35% serving in the Army, 23% serving in the Navy and 19% serving in the Air
Force. Six percent of service members reported to have served in more than one branch of the
military. Of those who have served, 34% have been deployed during times of military conflict.
The military conflict with the largest proportion of deployed service members was Afghanistan
(59%). Ten percent of those deployed were in Vietnam, and 10% of service members were
deployed to more than one location.
Occupational history is presented in
Table 4
. Over 33% of respondents were retired and
nearly 39% were disabled at the time of registration. Jobs held for the longest time were
Teacher, Professor or Educator (9%); Physician, Nurse, Dental or Health Care Worker (7%);
Secretary, Administrative Assistant or Receptionist (5%); Engineer, Architect or Draftsperson
(5%); Retail Salesperson, Sales Clerk, or Sales Representative (4%).Industries worked for the
longest time were Professional, Scientific, and Technical Services (11%); Educational Services
(11%); Health Care and Social Assistance (11%); Manufacturing (Metal, Electrical, Transport,
Professional) (8%); Other Services (except Public Administration) (6%); Construction (6%);
and Retail Trade I (Cars, Gas, Furniture, Electronics, Food-Beverage, Clothing) (6%).
Table 1. Demographic Characteristics among Adults with ALS (October 19, 2010–December 31,
2013).
n %
Age at Registration*
18–39 276 4.0
40–49 943 13.6
50–59 1972 28.5
60–69 2328 33.7
70–79 1131 16.4
80+ 258 3.7
Sex*
Male 4137 59.9
Female 2774 40.1
Geographic Distribution*,†
Northeast 1333 19.3
Southeast 1845 26.7
Midwest 1810 26.2
Southwest 591 8.6
West 1287 18.6
US Territories 13 0.2
Canada 3 0.0
Race‡
White 3491 93.7
Black 87 2.3
Other 120 3.2
Unknown 29 0.8
Ethnicity§
Hispanic or Latino 118 3.2
non-Hispanic or non-Latino 3588 96.3
Education
Less than HS 111 3.0
HS graduate or GED 736 19.8
Technical or trade school diploma 215 5.8
Some college 718 19.3
College graduate 1170 31.4
Graduate degree 678 18.2
Other 98 2.6
Change in Baseline BMI||
Decreased BMI 1499 50.2
ALS diagnosis less than 1 year ago 963 48.4
ALS diagnosis 1 or more years, but less than 2 years ago 232 53.5
ALS diagnosis 2 or more years, but less than 3 years ago 126 61.5
ALS diagnosis 3 or more years ago 178 50.3
Equal/increased BMI 1485 50.0
ALS diagnosis less than 1 year ago 1028 51.6
ALS diagnosis 1 or more years, but less than 2 years ago 202 46.5
ALS diagnosis 2 or more years, but less than 3 years ago 79 38.5
group. However, the rate of disease among siblings was higher in our analysis (60 per 10,000)
for Alzheimer’s disease than our comparison group (11 per 10,000). In our analyses, the rates
of reported disease among all first degree relatives of adults living with Parkinson’s disease,
Alzheimer’s disease, ALS, or any neurodegenerative disease was higher when compared with
the rate of reported disease among all first degree relatives in the comparison groups.
Discussion
Since October 19, 2010, over 35,000 risk factor surveys have been completed by
Registry-enrolled persons with ALS. To our knowledge, this is the largest and most geographically
diverse collection of risk factor data available about adults with ALS in the United States. Brief
surveys about possible risk factors for ALS are available through the Registry’s secure web
por-tal for completion by registrants. Findings from risk factor surveys may provide important
insights into the pathology of ALS. Furthermore, the quantity of risk factor data collected helps
to eliminate limitations traditionally associated with epidemiological studies (e.g., sample size,
representativeness).
Date of registration was automatically captured by the National ALS Registry web portal
and was, therefore, more reliable than a respondent-recalled diagnosis date which is subject to
recall bias. The definition of diagnosis date may not be consistent if a respondent were to
“self-diagnose”
and recall the date of ALS symptom onset as his date of diagnosis versus the date
that the ALS diagnosis was actually confirmed by a healthcare provider. This difference in time
has been shown, on average, to be approximately 12 months[
37
]. As a result, registration date
was used as the standard point of reference in this study. Because most risk factor surveys were
completed at the time of registration, for consistency, survey respondent characteristics were
described at the same point in time. The date of registration and date of diagnosis differed, on
average, by less than two years which did not suggest a need to use date of diagnosis instead of
date of registration.
Several studies have indicated that cigarette smoking may be related to the development of
ALS [
31
,
38
–
41
]. Smoking is thought to increase the risk of developing ALS through several
mechanisms, including inflammation, oxidative stress and neurotoxicity caused by heavy
met-als and other chemical compounds present in cigarette smoke [
22
,
42
,
43
]. However, a
Table 1. (Continued)n %
ALS diagnosis 3 or more years ago 176 49.7
All registrants (N = 6,911). Respondents with missing demographic information were excluded—(among all registrants) age at registration 3 (0.0%), state of residence 29 (0.4%); (among survey 1 respondents) ethnicity 21 (0.6%), education 1 (0.0%). Survey 1 (n = 3727).
*among all registrants,
†
Definition of geographic regions can be found in Appendix.
‡
Race was defined as either identifying with one racial group or, if racial identification included more than one racial group, respondents were classified as Other. If only Hispanic ethnicity and no racial group were chosen or if Race = Don't Know, race was defined as Unknown.
§Ethnicity was defined as identifying with either Hispanic/Latino or non-Hispanic/non-Latino ethnic groups. ||Change in baseline was calculated among those currently older than 40 years and diagnosed after 40
years. Time since diagnosis was calculated as difference between date of diagnosis and date of registration.
definitive link between smoking and ALS has not been proven. Nationally, nearly 41% of adults
have smoked in their lifetime[
44
]. In our study, half of adults were either current or former
smokers. Of those ever smokers, more than half (52%) had 15 pack-years or more of smoking
history. This level of tobacco exposure may be related to an increased risk of ALS [
40
,
41
].
Additionally, the prevalence of ever smoking was somewhat higher than expected among
Table 2. Risk Behaviors among Adults with ALS (October 19, 2010–December 31, 2013).Male Female Total
Smoking Status* n % n % n %
Current Smoker 198 65.4 105 34.7 303 9.1
Former Smoker 862 64.1 483 35.9 1345 40.5
Nonsmoker 935 56.1 733 44.0 1668 50.2
Ever Smoker 1060 64.3 588 35.7 1648 49.6
Smoking Duration
<10 years 213 61.7 132 38.3 345 21.0
10-<25 years 414 65.2 221 34.8 635 38.5
25-<40 years 285 65.1 153 35.0 438 26.6
40+ years 144 65.5 76 34.6 220 13.4
Smoking Intensity†
<5 pack-years 214 57.7 157 42.3 371 22.5
5 to<15 pack-years 240 62.3 145 37.7 385 23.4
15+ pack-years 600 68.2 280 31.8 880 53.4
Alcohol Consumption Status
Current Drinker 949 67.7 453 32.3 1402 42.2
Former Drinker 759 62.7 451 37.3 1210 36.4
Nondrinker 284 41.2 406 58.8 690 20.8
Ever Drinker 1708 65.4 904 34.6 2612 78.6
Drinking Duration
<10 years 184 51.7 172 48.3 356 13.6
10-<25 years 393 68.4 182 31.7 575 22.0
25-<40 years 684 64.8 372 35.2 1056 40.4
40+ years 437 71.6 173 28.4 610 23.4
Drinking Intensity‡
Light Drinker 1048 58.5 743 41.5 1791 68.6
Moderate Drinker 320 78.8 86 21.2 406 15.6
Heavy Drinker 284 85.3 49 14.7 333 12.8
Missing smoking status 8 (0.2%), smoking duration 10 (0.6%), smoking intensity 12 (0.7%), alcohol consumption status 22 (0.7%), drinking duration 15 (0.6%), drinking intensity 82 (3.1%).
Survey 4 (n = 3324).
*Current smokers have smoked one or more cigarettes per day for six months or longer and still smoke; former smokers have smoked one or more cigarettes per day for six months or longer but currently do not; nonsmokers have not smoked one or more cigarettes per day for six months or longer. Current drinkers consumed alcoholic beverages at least once a month for 6 months or more and still drink; former drinkers consumed alcoholic beverages at least once a month for 6 months or more and do not currently drink; nondrinkers have not consumed alcoholic beverages at least once a month for 6 months or more.
†
Pack-years are defined as multiplying the number of packs of cigarettes smoked per day by the number of years the person has smoked.
‡
Abel, EL, Kruger, ML, Friedl, J. (1998). How do physicians define "light", "moderate" and "heavy" drinking? 22(5) 979–984. Alcoholism: Clinical and Experimental Research.
women in our study (44%) when compared with women nationally (35%)[
45
] which is
consis-tent with past research that suggests an increased susceptibility to ALS exists among women
who smoke [
40
,
46
]. The relationship between alcohol consumption and an increased risk of
ALS is unclear. It is unknown whether alcohol consumption increases the risk of developing
ALS or has a protective effect (38,40).
Occupational exposures such as military service have been linked with ALS [
25
,
47
–
50
].
Veterans, regardless of branch of the military, deployed during times of combat were found to
experience a higher risk of ALS compared to veterans who were not deployed during wartime
[
48
] while another study links deployment to the first Persian Gulf War to ALS [
47
]. It remains
unclear whether that increase is due to exposure to toxic or infectious agents resulting from
deployment location or to some more general aspect of military life [
47
,
48
]. Men who served
in the military throughout the twentieth century might have been exposed to toxic agents (i.e.,
N,N-diethyl-m-toluamide, aerosolized lead (DEET, an insect repellant)) and various infectious
agents [
50
]. One suggested hazardous exposure is the occupational exposure to diesel fuel of
veterans from a variety of sources that generally occur during military conflict [
51
]. Nationally,
9% of adults are veterans [
52
]. In our analyses, veterans comprised 24% of survey respondents
and about one-third (34%) of veteran respondents were deployed to at least one military
con-flict. Over one-half (56%) were deployed to the Afghanistan War and 9% in Persian Gulf Wars
Table 3. Military History among Adults with ALS (October 19, 2010–December 31, 2013).Military Service History
n %
Veterans 789 23.5
Nonveterans 2561 76.2
Branch of Military Service
Army 274 34.9
Navy 177 22.5
Marines 53 6.8
Air Force 150 19.1
Reserves 68 8.7
Coast Guard 17 2.2
More than one branch of military service 46 5.9
Deployment to a War Arena
Yes 264 33.5
No 524 66.4
Deployment Location
WWII 7 2.7
Korea 9 3.4
Vietnam 26 9.8
Persian Gulf 4 1.5
Afghanistan 156 59.1
Persian Gulf II 18 6.8
Other 20 7.6
More than one deployment location 24 9.1
Respondents with missing military service information—service 10 (0.3%), branch 4 (0.5%). Survey 3 (n = 3360).
I and II combined. The overrepresentation of veterans who participated in the Afghanistan
War may be explained by the age distribution of our study population who tended to be
youn-ger when compared to other ALS study populations rather than exposure to toxic or infectious
agents specific to a deployment location.
Table 4. Occupational History of Adults with ALS (October 19, 2010–December 31, 2013).
n %
Employment Status (at Registration)
Full-time employed 603 17.6
Part-time employed 163 4.8
Retired 1122 32.8
Disabled 1318 38.5
Full-time student 5 0.2
Homemaker 63 1.8
Unemployed 87 2.5
Other 59 1.7
Job Title Held for the Longest Time (Top 10)
Teacher, professor or educator 297 8.7
Physician, nurse, dental or health care worker 245 7.2
Secretary, administrative assistant or receptionist 168 4.9
Engineer, architect or draftsperson 157 4.6
Retail salesperson, sales clerk, or sales representative 146 4.3
Manufacturing laborer, production worker, or assembler/fabricator 118 3.4
Accountant, auditor, or bookkeeper 107 3.1
Supervisor or manager offinancial or marketing workers 107 3.1
Chief executive or owner 91 2.7
Supervisor or manager of manufacturing or production workers 86 2.5 Industry Worked in for the Longest Time (Top 10)
Professional, Scientific, and Technical Services 380 11.1
Educational Services 359 10.5
Health Care and Social Assistance 361 10.5
Manufacturing (Metal, Electrical, Transport, Professional) 265 7.7
Other Services (except Public Administration) 212 6.2
Construction 209 6.1
Retail Trade I (Cars, Gas, Furniture, Electronics, Food-Beverage, Clothing) 209 6.1
Finance and Insurance 183 5.3
Manufacturing—(Paper, Printing, Chemicals, Petroleum, Leather, Lumber, Stone) 138 4.0 Transportation and Warehousing I (Air, Rail, Water, Ground, Pipeline) 120 3.5 Years of Employment at Longest Held Occupation
<= 10 years 497 14.5
10<time<= 20 years 975 28.5
20<time<= 30 years 1012 29.6
>30 years 868 25.4
Respondents with missing employment history information were excluded—employment status 4 (0.1%), job title held for the longest time 57 (1.7%), industry worked in for the longest time 196 (5.7%), years of employment at longest held occupation 72 (2.1%). Survey 2 (n = 3424).
Total # siblings
# siblings with condition
Rate of condition
among siblings
Total 1st degree relatives*
# 1st degree relatives
with condition*
Rate of condition among 1st
degree*
# siblings with condition
Rate of condition
among siblings
# 1st degree relatives
with condition*
Rate of condition among 1st
degree*
Ratio among siblings
Ratio among
1st degree*
ALS 8948 68 0.0076 21529 198 0.0092 13 0.0149 15 0.0084 0.5086 1.0950 Parkinson's
Disease
9005 32 0.0036 21502 177 0.0082 4 0.0046 8 0.0045 0.7729 1.8377
Alzheimer's Disease
8903 53 0.0060 21460 467 0.0218 1 0.0011 12 0.0067 5.1792 3.2388
Neurodegenerative Disease
9005 153 0.0170 21529 842 0.0391 18 0.0207 35 0.0196 0.8212 1.9957
*1st degree relative was defined as either parent(s), sibling(s) or child(ren). Survey 6 (n = 3176).
doi:10.1371/journal.pone.0153683.t005
Prelimi
nary
Results
of
National
ALS
Registry
Risk
Factor
Survey
ONE
|DOI:10.137
1/journal.p
one.0153683
April
28,
As anticipated, given the incapacitating nature of ALS and the average age of diagnosis,
more than three quarters of cases reported their employment status at registration as either
disabled or retired. Among those reporting longest held occupation, teachers, health care
workers, secretaries, salespersons, and engineers were the most common jobs. Although this
might indicate that persons with higher education may be more likely to self-register,
Gun-narsson et al. reported that office workers and medical service workers were more likely to
have died from ALS in Sweden, with odds ratios of 1.8 (95% CI 1.0–3.3) and 1.7 (95% CI 1.0–
3.0), respectively [
11
].
ALS patients also reported industries where they worked for the longest period.
“Specialty
trade contractors”
and
“Construction of buildings”
appear among the top 10 of those
indus-tries. Both of these sub-categories belong to the construction sector, according to NAICS. Fang
et al. conducted a case-control study in New England using 109 ALS patients and found an
odds ratio of 2.9 (95% CI 1.2–7.2) for construction workers, excluding supervisors [
21
].
Con-struction workers may be exposed to many hazardous substances, depending on the specific
task performed. These may include welding and electrical work, which have been associated
with ALS. Strickland et al. demonstrated an odds ratio of 5.3 (95% CI 1.4–20.1) for workers
exposed to welding or soldering materials [
24
]. Electric current injuries, also a common hazard
among construction workers [
53
], have been associated with ALS in independent studies in the
United States (odds ratio = 3.8 [95% CI 1.4–13.0]) [
54
] and Denmark (standardized mortality
ratio = 2.7 [95% CI 1.0–6.0]) [
55
].
Studies have shown an increased risk of developing ALS among relatives who have a
fam-ily history of ALS and other neurodegenerative diseases such as Parkinson’s disease and
dementia [
6
,
56
,
57
]. This increased risk is reported for sporadic ALS cases as well as familiar
ALS cases[
6
]. Previous studies have shown that persons with ALS have higher rates of
neuro-degenerative diseases among their family members [
6
,
56
]. Because a control group was not
available for this study, we compared the rates of disease in our population to those rates
pre-sented in the paper by Fallis [
6
]. Our results were very similar and showed a higher rate of
neurodegenerative diseases reported in first degree relatives. It is unclear why the rate of
dis-ease in siblings was lower except for Alzheimer’s disdis-ease because Alzheimer’s disdis-ease was
spe-cifically asked and not dementia in general. Although the rates of disease were lower in
siblings, they were still higher than the control group in this study. The Fallis study has
limi-tations. Its study universe was a less populated area, Ireland, which may have resulted in
smaller disease counts. However, similarities existed between our study and Fallis. While the
comparison study does not provide racial data, it is assumed to be largely white because of its
study location. The National ALS Registry population was also largely white. In addition,
information about the same neurodegenerative diseases, Parkinson’s Disease, Alzheimer’s
Disease and ALS was collected. The comparison study also limited its analysis to first-degree
relatives, more specifically, siblings. Because of the scarcity of research about the familial
occurrence of neurodegenerative diseases among ALS patients for specific types of
first-degree relatives, additional research is necessary.
maintaining sufficient cognitive and physical ability that allowed registration and completion
of risk factor surveys. This finding may suggest slower disease progression among this group.
Further study is warranted.
There are several known limitations to this study. Our study population tended to differ
demographically from the nation. Survey respondents were less racially diverse. This may be
the result of ALS being more prevalent among whites and men [
60
,
61
] or a reflection of
racial disparity in Internet access and usage [
62
] which could result in a higher utilization of
online ALS-related resources for particular groups. In addition, a majority of survey
respon-dents were educated (74% had some college or higher) which has also been associated with
higher Internet use [
62
]. However, of those who registered, there was no difference in age,
sex, or geographic distribution between those who took surveys and those who did not take
surveys. The underrepresentation of various demographic groups may result in an
underesti-mation of the prevalence of risk factors among adults living with ALS. It is expected that
more representative data will be collected as the Registry web portal matures. In addition,
risk behavior surveys described in this study were completed by adults with ALS and not by a
similar non-disease population. As a result, more definitive associations could not be tested.
Thus, it was not possible to assess whether associations of risk factors of ALS were consistent
or biased due to self-registration. However, general population national estimates were used
as proxy comparison groups when applicable. Detailed information on specific exposures to
hazardous agents and their duration and latency was not collected for occupational and
mili-tary history risk factors, thereby, limiting the ability to extrapolate these results to a broader
population or infer any causative links. Other potential exposures from such things as the use
of home pesticides or hobbies were not assessed but have been added to information collected
and will be analyzed in the future. Survey data were collected by self-reports which could
underestimate negative health behaviors. However, past studies have shown some self-report
measures to be sensitive and fairly specific [
63
,
64
]. Answering surveys is voluntary and not
everyone who registered took the surveys. In 2012, the Behavioral Risk Factor Surveillance
System had a median response rate of 45.2% for all states and Washington, DC with a range
from 27.7% - 60.4% [
65
]. Survey participation rates in the National ALS Registry ranged
from 43.6%-49.2%, which is within the expected range for this type of research. Additionally,
although every attempt was made to include only unique registrations in our analyses, there
remains a possibility that duplicate registrations were included. However, further review of
the data indicates that very few duplicate registrations likely existed, thus minimizing the
effects on the overall conclusions. Results presented here include only National ALS Registry
participants who completed risk factor surveys on the secure online web portal and may not
be representative of all persons with ALS in the Registry. Lastly, these results were descriptive.
Statistical testing including the control of potential covariates and confounders did not occur
in this study. As a result, these finding should not be interpreted to suggest causation.
Conclusions
Appendix
Demographics
Height (post-baseline for respondents older than 40 years)
“What is your current height?”
Weight (post-baseline for respondents older than 40 years)
“What is your current weight?”
Height at 40 years old (baseline) “What was your height at age 40 years?”
Weight at 40 years old (baseline) “What was your weight at age 40 years?”
Race and/or ethnicity Race was defined as the primary race. If more than one race was chosen or race was Asian or Native Hawaiian or Pacific Islander, respondents were categorized as Other. If only ethnicity were specified or if respondent did not know race, race was defined as Unknown.“Do you consider yourself Spanish, Hispanic, or Latino/Latina?” “What do you consider to be your race or ethnic group? If you belong to more than one of these groups, please indicate all groups that apply to you.”
Risk Factors
Cigarette Smoking Status “Have you ever smoked one or more cigarettes per day for six months or longer?”
Current Smokers Respondents who smoked one or more cigarettes
per day for6 months and currently smoking.
Former Smokers Respondents who smoked one or more cigarettes
per day for6 months but not currently smoking.
Nonsmokers Respondents who had never smoked one or more
cigarettes per day for6 months.
Ever Smokers Current or former smokers.
Smoking Duration Ever smokers were asked,“During periods when
you smoked, for how many years in total did you smoke?”
Smoking Intensity Ever smokers were asked,“During periods when
you smoked, how many cigarettes did you usually smoke in a day? One pack contains 20 cigarettes.”
Cigarette smoking intensity was defined in pack years, the number of packs of cigarettes smoked per day per year of smoking.
Alcohol Consumption Status “Did you ever drink alcoholic beverages such as wine, beer and spirits at least once a month for 6 months or more?”
Current Drinkers Respondents who had consumed alcoholic
beverages at least once a month for6 months and currently drinking alcohol.
Former Drinkers Respondents who had consumed alcoholic
beverages at least once a month for6 months and not currently drinking alcohol.
Nondrinkers Respondents who had not consumed any alcoholic
beverages in a month for6 months.
Ever Drinkers Current or former drinkers.
Drinking Duration Ever drinkers were asked, "During periods when you were drinking alcoholic beverages, for how many years in total did you drink alcoholic beverages?”A drink is 12 oz. beer, 4 ounces of wine or a drink containing 1 oz. of liquor. Please select week or month.”
(Continued)
Drinking Intensity Ever drinkers were asked,“During periods when you were drinking, how many alcoholic beverages did you usually have in a week OR month? A drink is 12 oz. beer, 4 ounces of wine or a drink containing 1 oz. of liquor. Please select week or month.”Light drinkers were defined as having consumed fewer than 8.4 alcohol drinks per week, moderate drinkers consumed between 8.4 and 15.4 alcohol drinks per week and heavy drinkers consumed more than 15.4 alcohol drinks per week (Abel 1998).
Military Service History
Veterans Status “Were you ever a member of the armed forces?”
Branch of Military Service If yes, veterans were asked,“In which branch of service were you employed?”Available answer options were Army, Navy, Marines, Air Force, Reserves/National Guard or Coast Guard. Some veterans served in more than one branch of the military.
Deployment to War Arena Veterans were asked,“Were you ever deployed to a war arena?”If yes,“To which war arena were you deployed?”Available answer options were World War II, Korean Conflict, Vietnam War, Persian Gulf, Afghanistan War, Persian Gulf II, Other. Some veterans were deployed to more than one deployment location. "
Occupational History
Employment Status “What is your current employment status?”
Job Title Held for the Longest Time “Thinking about your entire working career, in which job were you employed for the longest period of time? Please indicate your job title and the industry in which you worked.”
Years of Employment at Longest Held Occupation “For how many years were you employed in this occupation?”
Titles of longest held jobs and corresponding industries
predetermined drop-down menus
Family History “Has your mother/father/brother/sister/child(ren) ever been diagnosed by a physician with any of these conditions—ALS, Alzheimer’s Disease, Parkinson’s Disease?
Geographic Distribution
Northeastern region HHS Regions 1,2,3
Southeastern region HHS Region 4
Midwestern region HHS Regions 5,7
Southwestern region HHS Region 6
Western region HHS Regions 8,9,10
Region 1—Connecticut, Maine, Massachusetts, New Hampshire, Rhode Island, Vermont
Region 2—New Jersey, New York, Puerto Rico, the Virgin Islands
Region 3—Delaware, District of Columbia, Maryland, Pennsylvania, Virginia, West Virginia Region 4—Alabama, Florida, Georgia, Kentucky, Mississippi, North Carolina, South Carolina, Tennessee
Author Contributions
Conceived and designed the experiments: LB WK VCA PM OM DKH. Analyzed the data: LB.
Wrote the paper: LB WK VCA PM OM DKH.
References
1. Mitsumoto H, Chad DA, Pioro EP. Amyotrophic lateral sclerosis. Philadelphia: F.A. Davis Company; 1998.
2. Andersen PM, Al-Chalabi A. Clinical genetics of amyotrophic lateral sclerosis: what do we really know? Nature Reviews Neurology. 2011; 7:603–15 PMID:21989245
3. Antao V, Horton DK. The national amyotrophic lateral sclerosis (ALS) registry. Journal of Environmental Health. 2012; 75(1):28–30. PMID:22866401
4. Mehta P, Antao V, Kaye W, Sanchez M, Williamson D, Bryan L, et al. Prevalence of Amyotrophic Lat-eral Sclerosis—United States, 2010–2011. Morbidity and Mortality Weekly Report. 2014; 63(SS07):1–
13.
5. Plato CC, Galasko D, Garruto RM, Plato M, Gamst A, Craig UK, et al. ALS and PDC of Guam Forty-year follow-up. Neurology. 2002; 58:765–73. PMID:11889241
6. Fallis BA, Hardima O. Aggregation of neurodegenerative disease in ALS kindreds. Amyotrophic Lateral Sclerosis 2009; 10:95–8. doi:10.1080/17482960802209664PMID:18608094
7. Bonvicini F, Marcello N, Mandrioli J, Pietrini V, Vinceti M. Exposure to pesticides and risk of amyotro-phic lateral sclerosis: a population-based case-control study. Ann Ist Super Sanita. 2010; 46(3):284–7. PMID:20847462
8. Das K, Nag C, Ghosh M. Familial, environmental, and occupational risk factors in development of amyotrophic lateral sclerosis. N Am J Med Sci. 2012; 4(8):350–5. doi:10.4103/1947-2714.99517
PMID:22912943
9. Furby A, Beauvais K, Kolev I, Rivain JG, Sebille V. Rural environment and risk factors of amyotrophic lateral sclerosis: a case-control study. Journal of Neurology. 2010; 257(5):792–8. doi: 10.1007/s00415-009-5419-5PMID:20012543
10. Govoni V, Granieri E, Fallica E, Casetta I. Amyotrophic lateral sclerosis, rural environment and agricul-tural work in the Local Health District of Ferrara, Italy, in the years 1964–1998. Journal of Neurology. 2005; 252(11):1322–7. PMID:15995797
11. Gunnarsson LG, Lindberg G, Soderfeldt B, Axelson O. Amyotrophic lateral sclerosis in Sweden in rela-tion to occuparela-tion. Acta Neurology Scand. 1991; 83(6):394–8.
12. Johnson FO, Atchison WD. The role of environmental mercury, lead and pesticide exposure in develop-ment of amyotrophic lateral sclerosis. Neurotoxicology. 2009; 30(5):761–5. doi:10.1016/j.neuro.2009. 07.010PMID:19632272
13. McGuire V, Longstreth WT, Nelson LM, Koepsell TD, Checkoway H, Morgan MS, et al. Occupational exposures and amyotrophic lateral sclerosis: a population-based case-control study. American Journal of Epidemiology. 1997; 145(12):1076–88. PMID:9199537
14. Malek AM, Barchowsky A, Bowser R, Heiman-Patterson T, Lacomis D, Rana S, et al. Environmental and Occupational Risk Factors for Amyotrophic Lateral Sclerosis: A Case-Control Study. Neurogenera-tive Diseases. 2013. Epub November 12, 2013.
(Continued)
Region 5—Illinois, Indiana, Michigan, Minnesota, Ohio, Wisconsin
Region 6—Arkansas, Louisiana, New Mexico, Oklahoma, Texas
Region 7—Iowa, Kansas, Missouri, Nebraska Region 8—Colorado, Montana, North Dakota, South Dakota, Utah, Wyoming
Region 9—Arizona, California, Hawaii, Nevada, American Samoa, Commonwealth of the Northern Mariana Islands, Federated States of Micronesia, Guam, Marshall Islands, Republic of Palau
15. Savitz DA, Loomis DP, Tse CK. Electrical occupations and neurodegenerative disease: analysis of US mortality data. Archives of Environmental Health. 1998; 53(1):71–4. PMID:9570311
16. Davanipour Z, Sobel E, Bowman JD, Qian Z, Will AD. Amyotrophic lateral sclerosis and occupational exposure to electromagnetic fields. Bioelectromagnetics. 1997; 18(1):28–35. PMID:9125230
17. Hakansson N, Gustavsson P, Johansen C, Floderus B. Neurodegenerative diseases in welders and other workers exposed to high levels of magnetics fields. Epidemiology. 2003; 14(4):420–6. PMID:
12843765
18. Li CY, Sung FC. Association between occupational exposire to power frequency electromagnetic fields and amyotrophic lateral sclerosis: a review. American Journal of Ind Med. 2003; 43(2):212–20. 19. Noonan CW, Reif JS, Yost M, Touchstone J. Occupational exposure to magnetic fields in case-referent
studies of neurodegenerative diseases. Scand J Work Environ Health. 2002; 28(1):42–8. PMID:
11871851
20. Zhou H, Chen G, Chen C, Yu Y, Xu Z. Association between extremely low-frequency electromagnetic fields occupations and amyotrophic lateral sclerosis: a meta-analysis. PLoS One. 2012; 7(11). 21. Fang F, Quinlan P, Ye W, Barber MK, Umbach DM, Sandler DP, et al. Workplace exposure and the risk
of amyotrophic lateral sclerosis. Environmental Health Perspectives. 2009; 117(9):1387–92. doi:10. 1289/ehp.0900580PMID:19750102
22. Kamel F, Umbach DM, Hu H, Munsat TL, Shefner JM, Taylor JA, et al. Lead exposure as a risk factor for amyotrophic lateral sclerosis. Neurogenerative Diseases. 2005; 2(3–4):195–201.
23. Roelofs-Iverson RA, Mulder DW, Elveback LR, Kurland LT, Molgaard CA. Als and heavy metals: a pilot case-control study. Neurology. 1984; 34(3):393–5. PMID:6538286
24. Strickland D, Smith SA, Dolliff G, Goldman L, Roelofs RI. Amyotrophic lateral sclerosis and occupa-tional history. A pilot case-control study. Archives of Neurology. 1996; 53(8):730–3. PMID:8759978
25. Sutedja NA, Veldink JH, Fischer K, Kromhout H, Heederik D, Huisman MH, et al. Exposure to chemi-cals and metals and risk of amyotrophic lateral sclerosis: a systematic review. Amyotrophic Lateral Sclerosis. 2009; 10(5–6):302–9. doi:10.3109/17482960802455416PMID:19922117
26. Weisskopf MG, Morozova N, O'Reilly EJ, McCullough ML, Calle EE, Thun MJ, et al. Prospective study of chemical exposures and amyotrophic lateral sclerosis. J Neurol Neurosurg Psychiatry. 2009; 80 (5):558–61. doi:10.1136/jnnp.2008.156976PMID:19372290
27. Pamphlett R, Rikard-Bell A. Different occupations associated with amyotrophic lateral sclerosis: is die-sel exhaust the link? PLoS One. 2013; 8(11).
28. Sutedja NA, Fischer K, Veldink JH, van der Heijden GJ, Kromhout H, Heederik et al. What we truly know about occupation as a risk factor for ALS: a critical and systematic review. Amyotrophic Lateral Sclerosis. 2009; 10(5–6):295–301. doi:10.3109/17482960802430799PMID:19922116
29. Wang H, O’Reilly EJ, Weisskopf MG, Logroscino G, McCullough ML, Schatzkin A, et al. Vitamin E intake and risk of amyotrophic lateral sclerosis: A pooled analysis of data from 5 prospective cohort studies. American Journal of Epidemiology. 2011; 173(6):595–602. doi:10.1093/aje/kwq416PMID:
21335424
30. Fang F, Chen H, Wirdefeldt K, Ronnevi LO, Al-Chalabi A, Peters TL, et al. Infection of the central ner-vous system, sepsis, and amyotrophic lateral sclerosis. PLoS One. 2011; 6(12):e29749. doi:10.1371/ journal.pone.0029749PMID:22216353
31. Kamel F, Umbach DM, Hu H, Munsat TL, Shefner JM, Sandler DP. Association of cigarette smoking with amyotrophic lateral sclerosis. Neuroepidemiology. 1999; 18(4):194–202. PMID:10364720
32. Beghi E, Logroscino G, ChiòA, Hardiman O, Millul A, Mitchell et al. Amyotrophic lateral sclerosis, physi-cal exercise, trauma and sports: Results of a population-based pilot case-control study. Amyotrophic Lateral Sclerosis. 2010; 11(3):289–92. doi:10.3109/17482960903384283PMID:20433412
33. ALS Consortium of Epidemiologic Studies (ACES). ALS Consortium of Epidemiologic Studies (ACES): Stanford School of Medicine. Available from:http://aces.stanford.edu/.
34. Allen KD, Kasarskis EJ, Bedlack RS, Rozear MP, Morgenlander JC, Sabet A, et al. The national regis-try of veterans with amyotrophic lateral sclerosis. Neuroepidemiology. 2008; 30:180–90. doi:10.1159/ 000126910PMID:18421218
35. US Department of Health and Human Services. US Department of Health and Human Services Regions Washington, DC [updated June 19, 2006June 10, 2014]. Available from:http://www.hhs.gov/ about/regionmap.html.
36. SAS Institute. SAS 9.3. 9.3 ed. Cary, NC.
38. Armon C. Smoking may be considered an established risk factor for sporadic ALS. Neurology. 2009; 73 (20):1693–8. doi:10.1212/WNL.0b013e3181c1df48PMID:19917993
39. Weisskopf MG, Mccullough ML, Calle EE, Thun MJ, Cudkowicz M, Ascherio A. Prospective study of cigarette smoking and amyotrophic lateral sclerosis. American Journal of Epidemiology. 2004; 160 (1):26–33. PMID:15229114
40. Nelson LM, Mcguire V, Longstreth WT, Matkin C. Population-Based Case-Control Study of Amyotro-phic Lateral Sclerosis in Western Washington State. I. Cigarette Smoking and Alcohol Consumption. American Journal of Epidemiology. 2000; 151(2):156–63. PMID:10645818
41. Gallo V, Bueno-de-mesquita HB, Vermeulen R. Smoking and risk for amyotrophic lateral sclerosis: analysis of the EPIC cohort. Annals of Neurology. 2009; 65(4):378–85. doi:10.1002/ana.21653PMID:
19399866
42. De jong SW, Huisman MH, Sutedja NA. Smoking, alcohol consumption, and the risk of amyotrophic lat-eral sclerosis: a population-based study. American Journal of Epidemiology. 2012; 176(3):233–9. doi:
10.1093/aje/kws015PMID:22791740
43. Barber SC, Shaw PJ. Oxidative stress in ALS: Key role in motor neuron injury and therapeutic target. Free Radical Biology & Medicine. 2010; 48 629–41.
44. Schiller JS, Lucas JW, Peregoy JA. Summary health statistics for U.S. adults: National Health Interview Survey, 2011. Hyattsville, MD: National Center for Health Statistics, 2012.
45. Schiller JS, Lucas JW, Peregoy JA. Summary health statistics for US adults: National Health Interview Survey, 2011. Vital Health Statistics. 2012; 10(256).
46. Alonso A, Logroscino G, Hernan MA. Smoking and the risk of amyotrophic lateral sclerosis: a system-atic review and meta-analysis. J of Neurol Neurosurg Psychiatry. 2010; 81:1249–52.
47. Haley RW. Excess incidence of ALS in young Gulf War veterans. Neurology. 2003; 60:750–6. 48. Horner RD, Kamins KG, Feussner JR. Occurrence of amyotrophic lateral sclerosis among Gulf War
veterans. Neurology. 2003; 60:742–9.
49. Coffman C, Horner RD, Grambow GJ, Lindquist J. Estimating the occurence of amyotrophic lateral sclerosis among Gulf War (1990–1991) veterans using capture-recapture methodology. Neuroepide-miology. 2005; 24:141–50. PMID:15650320
50. Weisskopf MG, OReilly EJ, McCullough ML. Prospective study of military service and mortality from amyotrophic lateral sclerosis. Neurology. 2005; 64:32–7. PMID:15642900
51. Ritchie GD, Still KR, Alexander WK, Nordholm AF, Wilson CL, Rossi J, et al. A Review of the Neurotox-icity of Selectted Hydrocarbon Fuels. Journal of Toxicology and Environmental Health. 2001; 4:223–
312. PMID:11503417
52. Abel EL, Kruger ML, Friedl J. How Do Physicians Define "Light", "Moderate", and "Heavy" Drinking? Alcoholism: Clinical and Experimental Research. 1998; 22(5):979–84.
53. Cawley JC, Homce GT. Occupational electrical injuries in the United States,1992–1998, and recom-mendations for safety research. J Safety Res. 2003; 34(3):241–8. PMID:12963070
54. Deapen DM, Henderson BE. A case-control study of amyotrophic lateral sclerosis. American Journal of Epidemiology. 1986; 123(5):790–9. PMID:3962963
55. Johansesn C, Olsen JH. Mortality from amyotrophic lateral sclerosis, other chronic disorders, and elec-tric shocks among utility workers. American Journal of Epidemiology. 1998; 148(4):362–8. PMID:
9717880
56. Plato CC, Galasko D, Garruto RM, Plato M, Gamst A, Craig UK, et al. ALS and PDC of Guam: Forty year follow-up. Neurology 2002:765–73. PMID:11889241
57. Majoor-Krakauer D, Ottman R, Johnson WG, Roland LP. Familial Aggregation of amyotrophic lateral sclerosis, dementia, and Parkinson’s disease: Evidence of shared genetic susceptibility. Neurology. 1994; 44:1872–7. PMID:7936240
58. Jawaid A, Murthy SB, Wilson AM, Qureshi SU, Amro MJ, Wheaton M, et al. A decrease in body mass index is associated with faster progression of motor symptoms and shorter survival in ALS. Amyotro-phic Lateral Sclerosis. 2010; 11(6):542–8. doi:10.3109/17482968.2010.482592PMID:20500116
59. Shimizu T, Nagaoka U, Nakayama Y, Kawata A, Kugimoto C, Kuroiwa Y, et al. Reduction rate of body mass index predicts prognosis for survival in amyotrophic lateral sclerosis: A multicenter study in Japan. Amyotrophic Lateral Sclerosis. 2012; 13:363–6. doi:10.3109/17482968.2012.678366PMID:
22632442
61. Gundogdu B, Al-Lahham T, Kadlubar F, Spencer H, Rudnicki SA. Racial differences in motor neuron disease. Amyotrophic Lateral Sclerosis and Frontotemporal Degeneration. 2014; 15(1–2):114–8. doi:
10.3109/21678421.2013.837930PMID:24067242
62. US Census Bureau. Computer and Internet Use in the United States Population Characteristics. Wash-ington, DC: US Census Bureau, 2013 May 2013. Report No.: Contract No.: P20-569.
63. MacDonald R, Baken L, Nelson A, Nichol KL. Validation of Self-Report of Influenza and Pneumococcal Vaccination Status in Elderly Outpatients. American Journal of Preventive Medicine. 1999; 16(3):173–
7. PMID:10198654
64. Irving SA, Donahue JG, Shay DK, Ellis-Coyle TL, Belongia EA. Evaluation of self-reported and registry-based influenza vaccination status in a Wisconsin cohort. Vaccine. 2009; 27:6546–9. doi:10.1016/j. vaccine.2009.08.050PMID:19729083