©2014 Science Publication
doi:10.3844/ajabssp.2014.64.71 Published Online 9 (1) 2014 (http://www.thescipub.com/ajabs.toc)
EVALUATION OF NITROGEN APPLICATION METHODS AND
RATES WITH NUTRISPHERE
-
N ON SOIL NITRATE-NITROGEN
IN SOUTHEASTERN COASTAL PLAINS
Pawel Wiatrak
School of Agricultural, Forest and Environmental Sciences, Clemson University, Edisto REC, Blackville, USA
Received 2013-11-18; Revised 2013-11-30; Accepted 2013-12-23
ABSTRACT
Nitrogen (N) application with Nutrisphere-N polymer may affect soil Nitrate-Nitrogen (NO3-N) movement in the soil. The objective was to evaluate two N application methods (all at planting and split application) and five N rates (0, 45, 90, 135 and 180 kg N ha−1) with Nutrisphere-N polymer on soil NO3-N in dryland corn (Zea mays L.) near Blackville, SC from 2010 to 2012. Soil samples were collected from the soil depth of 90 cm and divided into 15 cm increments following corn harvest. Compared to uncoated fertilizer, Nutrisphere-N improved NO3-N concentration by 29.8% with 180 kg N ha−1 in split applications at 0-15 cm depth and by 44.7% at 90 kg N ha−1 applied at planting at 15-30 cm depth. Soil NO3-N content increased with Nutrisphere-N by 26.2, 36.1, 28.0 and 17.3% at 45 kg, 90 kg, 135 kg and 180 kg Nutrisphere-N ha−1 in split applications at 15-30 cm depth, respectively. Nutrisphere-N improved soil NO3-N concentration by 40.1 and 31.6% at 90 kg and 135 kg ha−1 over uncoated treatment for N applied in split applications at 30-45 cm depth, respectively. Soil NO3-N content improved with Nutrisphere-N by 36.9% at 135 kg N ha−1 applied at planting, while NO3-N concentration improved by 33.9 and 34.9% at 135 kg and 180 kg N ha−1 with Nutrisphere-N applied in split applications at 45-60 cm depth, respectively. At 60-75 cm depth, Nutrisphere-N decreased soil NO3-N content by 22.0% at 180 kg N ha−1 applied at planting and increased content by 37.5 and 59.9% with split N applications of 90 kg and 135 kg ha−1, respectively. Soil NO3-N concentration increased with Nutrisphere-N by 30.6% over untreated fertilizer at 135 kg N ha−1 in split applications at 75-90 cm depth. Generally, N applications with Nutrisphere-N helped to reduce soil NO3-N losses.
Keywords: Corn, Polymer, Nutrisphere-N, Nitrate-Nitrogen, NO3-N
1. INTRODUCTION
Fertilizer recommendations depend on estimating supplied and immobilized nutrients in the soil (Anthony et al., 2012). More applied fertilizers to sustain crop production may lead to environmental issues (Ni et al., 2011) and soil and groundwater Nitrogen (N) pollution, which is a concern for animals and humans (Hubbard et al., 2004). Franzen et al. (2011) noted that nitrification and ammonia volatility are vital in improving N use efficiency. Leaching of NO3-N and NO2-N to groundwater are important issues, especially in the southeastern Coastal Plain due to warm temperatures and
This study was conducted on Dothan loamy sand (fine loamy, kaolinitic, thermic Plinthic Kandiudult) at Clemson University, Edisto Research and Education Center (REC) near Blackville, SC (33° 21’N, 81°19’W) under dryland conditions from 2010 to 2012. These are deep, well drained soils with slow permeability and soil pH was 6.2. Wheat cover crop was planted in November/December of 2009, 2010 and 2011and was killed in early March of the following year. Corn cv. ‘Pioneer 31G71’ was planted following wheat cover crop at 69,200 seeds ha−1 in strip-till using a Univerferth Ripper-Stripper (Unverferth Mtg. Co., Inc., Falida, OH) implement and John Deere 1700 MaxEmerge XP Vaccum planters (John Deere Co., Moline, IL) on 25, 18 and 14 March in 2010, 2011 and 2012, respectively. The plot size was 6.1 m long by 3.9 m wide with four corn rows and 0.96 m row spacing.
Nitrogen treatments consisted of two N application methods (all at once at planting and as a split application with 35 kg N ha−1 applied at planting and the rest as a side-dress application at V6 corn stage) and five nitrogen rates (0, 45, 90, 135 and 180 kg N ha−1).
Liquid fertilizer 25-S (formulation of 25 N and 3.5% S) was applied on both sides of corn rows to selected plots using a Reddick fertilizer applicator (Reddick Equipment Co., Inc., Williamson, NC) following corn planting. Corn in selected plots was side-dressed with different N rates at V6 stage using a Reddick fertilizer applicator on 14 May 2010 and 9 May in 2011 and 2012. Weed control was based on the South Carolina Extension recommendations. Corn was harvested using either Almaco (Almaco, Nevada, Iowa) or Kinkaid 8XP (Kinkaid Equip. Mtg, Haven, Kansas) small grain plot combine on 27, 8 and 4 August in 2010, 2011 and 2012, respectively.
Soil samples were collected for NO3-N following corn harvest from the soil depth of 90 cm using Giddings hydraulic soil probe (Giddings Machine Co.
error bars were shown for N rates by N application methods.
3. RESULTS
3.1. Weather Conditions
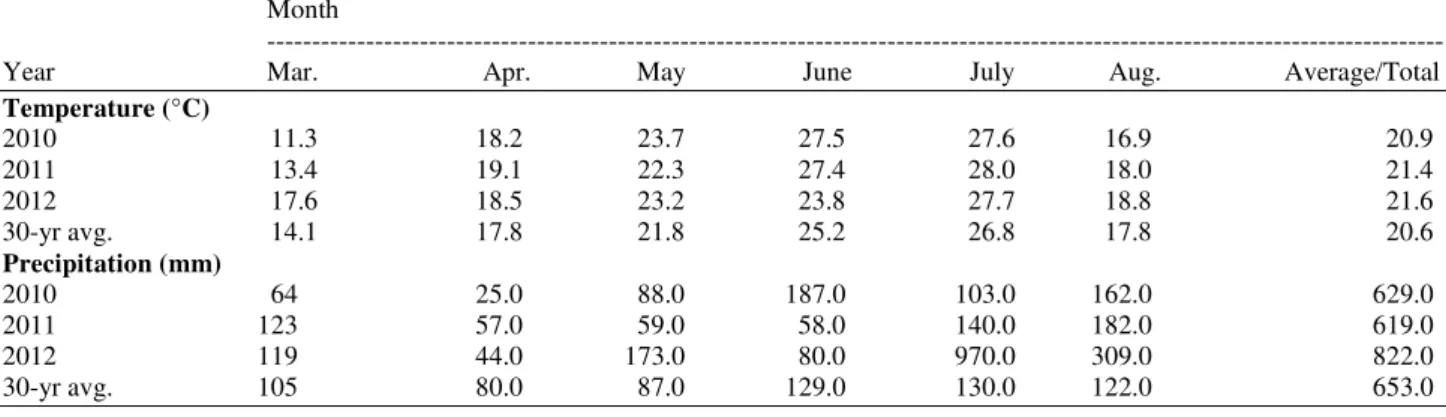
The average monthly air temperature was generally similar to 30-yr average, except for March 2012, April 2011, May 2010 and 2012, June 2010 and 2011, July 2011 and August 2012 when temperature was 3.5, 1.3, 1.8, 1.3, 2.3, 2.3, 1.3 and 1.1°C higher and March 2012 and June 2012 when temperature was 2.8 and 1.4°C lower than 30-yr average, respectively (Table 1).
Precipitation was 169 mm greater during corn growing season in 2012 and 24 and 34 mm lower in 2010 and 2011 than 30-yr average, respectively (Table 1). Insufficient precipitation was recorded in March and July 2010, April in all 3 years, May 2011, June 2011 and 2012 and July in 2010 and 2012. Higher than 30-yr precipitation was recorded in March 2011 and 2012, May 2012, June 2010, July 2012 and August in 2010, 2011 and 2012.
3.2. Soil Nitrate
-
Nitrogen (NO
3-
N)
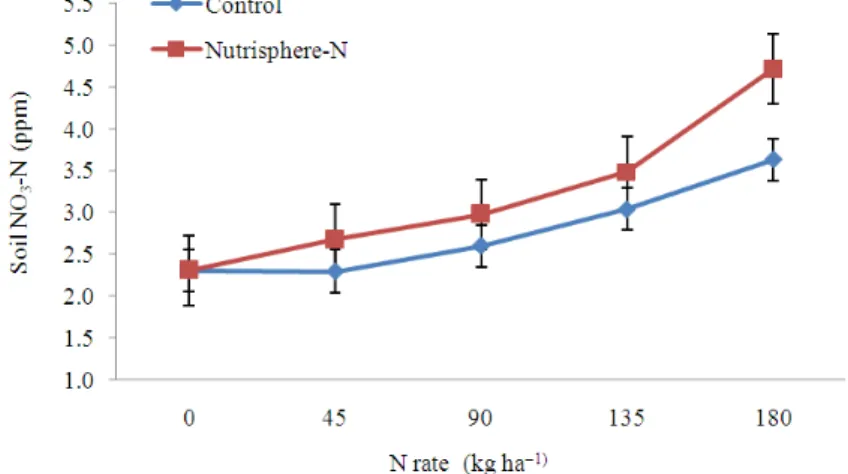
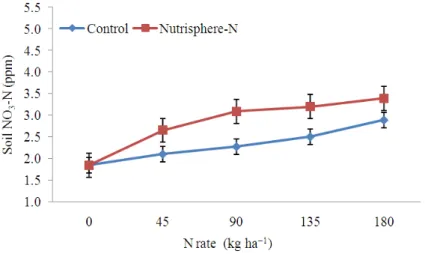
Soil NO3-N content varied for application methods and N rates (Fig. 1 and 2). Application of 180 kg N ha−1 in split with Nutrisphere-N polymer improved soil N content by 29.8% over untreated fertilizer at 0-15 cm soil depth. Similar or slightly higher NO3-N content was observed with Nutrisphere-N polymer for other N application rates and also similar for N applied at planting.
Fig. 1. Influence of N application rate at planting with Nutrisphere-N on soil NO3-N at 0-15 cm. Vertical bars indicate standard error
Fig. 2. Influence of split N application rates with Nutrisphere-N on soil NO3-N at 0-15 cm. Vertical bars indicate standard error
Fig. 4. Influence of split N application rates with Nutrisphere-N on soil NO3-N at 15-30 cm. Vertical bars indicate standard error
Fig. 5. Influence of N application rate at planting with Nutrisphere-N on soil NO3-N at 30-45 cm. Vertical bars indicate standard error
Fig. 7. Influence of N application rate at planting with Nutrisphere-N on soil NO3-N at 45-60 cm. Vertical bars indicate standard error
Fig. 8. Influence of split N application rates with Nutrisphere-N on soil NO3-N at 45-60 cm. Vertical bars indicate standard error
Fig. 10. Influence of split N application rates with Nutrisphere-N on soil NO3-N at 60-75 cm. Vertical bars indicate standard error
Fig. 11. Influence of N application rate at planting with Nutrisphere-N on soil NO3-N at 75-90 cm. Vertical bars indicate standard error
Table 1. Monthly average air temperature and precipitation during soybean growth near Blackville, SC from 2010 to 2012 Month
---
Year Mar. Apr. May June July Aug. Average/Total
Temperature (°C)
2010 11.3 18.2 23.7 27.5 27.6 16.9 20.9
2011 13.4 19.1 22.3 27.4 28.0 18.0 21.4
2012 17.6 18.5 23.2 23.8 27.7 18.8 21.6
30-yr avg. 14.1 17.8 21.8 25.2 26.8 17.8 20.6
Precipitation (mm)
2010 64 25.0 88.0 187.0 103.0 162.0 629.0
2011 123 57.0 59.0 58.0 140.0 182.0 619.0
2012 119 44.0 173.0 80.0 970.0 309.0 822.0
30-yr avg. 105 80.0 87.0 129.0 130.0 122.0 653.0
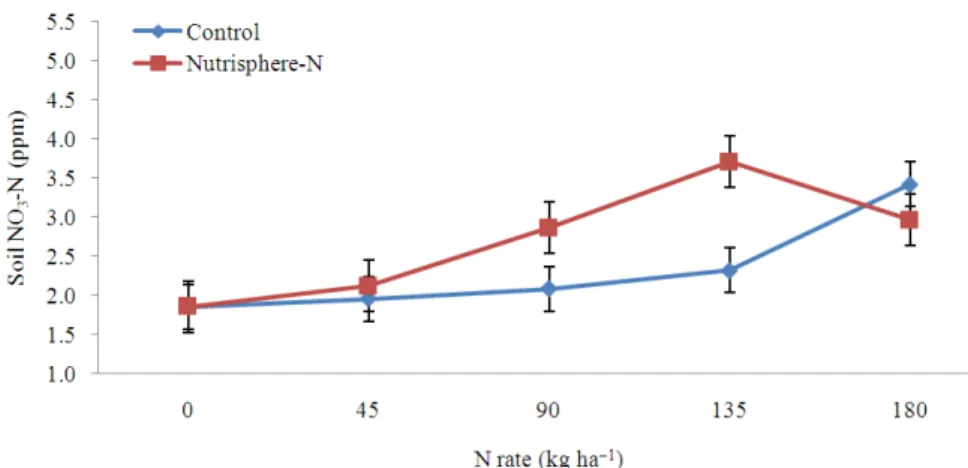
For N applied at planting, soil NO3-N content at 30-45 cm was similar for treatments with and without Nutrisphere-N polymer (Fig. 5). However, Nutrisphere-N improved soil NO3-N concentration by 40.1 and 31.6% at 90 kg and 135 kg ha−1 over uncoated treatment at the same soil depth for N applied in split applications (Fig. 6).
At 45-60 cm depth, Nutrisphere-N polymer improved soil NO3-N content by 36.9% at 135 kg N ha−1 applied at planting, while NO3-N concentration improved by 33.9 and 34.9% at 135 kg and 180 kg N ha−1 with Nutripshere-N in split applications, respectively (Fig. 7 and 8).
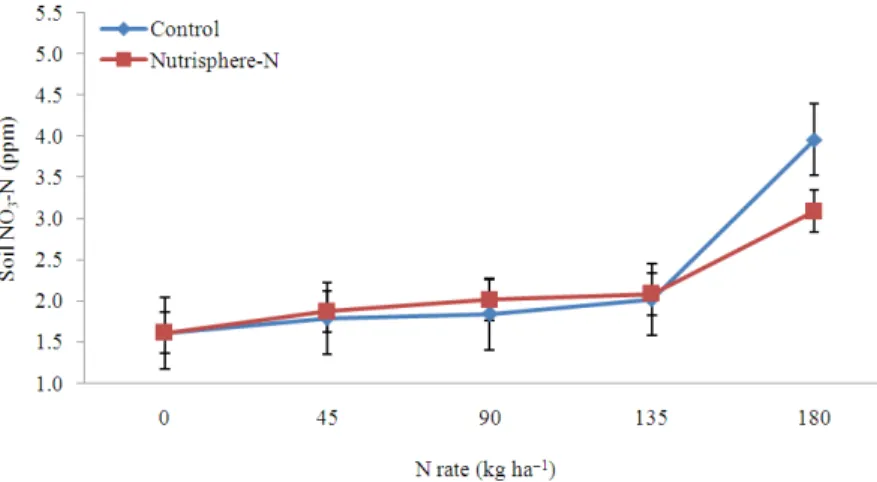
The NO3-N content in soil at depth of 60-75 cm decreased with Nutrisphere-N polymer by 22.0% at 180 kg N ha−1 applied at planting (Fig. 9). With split N applications of 90 kg and 135 kg ha−1, Nutrisphere-N increased soil NO3-N by 37.5 and 59.9%, respectively (Fig. 10).
At 75-90 cm depth, similar soil NO3-N concentrations were observed for N applied at planting with and without Nutrisphere-N (Fig. 11). However, at the same depth soil NO3-N concentration increased with Nutrisphere-N polymer by 30.6% over untreated fertilizer at 135 kg N ha−1 in split applications (Fig. 12).
4. DISCUSSION
Results from previous studies generally showed reduction in soil N loss and improved N use efficiency with products slowing N release. Wen et al. (2001) reported greater N recovery from coated than regular fertilizer, because N release better matched crop N demand and uptake. Controlled release fertilizers, especially polymer-coated urea helped to reduce NO3-N leaching in potato (Solanum tuberosum L.) and may allow reduction of split N applications (Wilson et al., 2009).
Slow release products reduced nutrient losses and improved water use efficiency under insufficient rainfall (Ni et al., 2011) and polymer-coated urea was very
effective under higher soil moisture conditions due to reduced N2O emissions (Drury et al., 2012).
This study showed that compared to uncoated treatment, Nutrisphere-N polymer improved NO3-N concentration by 29.8% with 180 kg N ha−1 in split applications at 0-15 cm depth. Soil NO3-N content increased with Nutrisphere-N by 44.7% at 90 kg N ha−1 applied at planting and by 26.2, 36.1, 28.0 and 17.3% at 45 kg, 90 kg, 135 kg and 180 kg N ha−1 in split applications at 15-30 cm depth, respectively.
For N applied in split applications at 30-45 cm depth, Nutrisphere-N improved soil NO3-N concentration by 40.1 and 31.6% at 90 kg and 135 kg ha−1 over uncoated treatment, respectively. Soil NO3-N content improved with Nutrisphere-N by more than 30% at 135 kg N ha−1 applied at planting and 135 kg and 180 kg N ha−1 applied in split applications at 45-60 cm depth.
At 60-75 cm depth, Nutrisphere-N decreased soil NO3-N content by 22.0% over control at 180 kg N ha−1 applied at planting and increased NO3-N content by 37.5 and 59.9% with split N applications of 90 kg and 135 kg ha−1, respectively. Compared to untreated fertilizer, soil NO3-N concentration increased with Nutrisphere-N by 30.6% at 135 kg N ha−1 in split applications at 75-90 cm depth. Similar concentrations for treatments with and without Nutrisphere-N were observed at 0-15 cm, 30-45 cm and 75-90 cm depth for N applied to corn at planting.
5. CONCLUSION
Nutrisphere-N increased soil NO3-N by 37.5 and 59.9% with split N applications of 90 kg and 135 kg ha−1, respectively. At 75-90 cm depth, soil NO3-N concentration increased with Nutrisphere-N polymer by 30.6% over untreated fertilizer at 135 kg N ha−1 in split applications. Similar soil NO3-N concentrations were observed for treatments with N applied at planting with and without Nutrisphere-N at 0-15 cm, 30-45 cm and 75-90 cm soil depth. More research is needed to evaluate NO3-N movement in the soil after fertilizer application with Nutrisphere-N under different soil types and irrigation.
6. ACKNOWLEDGEMENT
I greatly appreciate a financial support from Specialty Fertilizer Products (SFP) for conducting field research.
7. REFERENCES
Anthony, P., G. Malzer, M.C. Zhang and S. Sparrow, 2012. Soil nitrogen and phosphorus behavior in a long-term fertilization experiment. Agron. J., 104: 1223-1237. DOI: 10.2134/agronj2012.0020
Drury, C.F., W.D. Reynolds, X.M. Yang, N.B. McLaughlin and T.W. Welacky et al., 2012. Nitrogen source, application time and tillage effects on soil nitrous oxide emissions and corn grain yields. Soil Sci. Soc. Am. J., 76: 1268-1279. DOI: 10.2136/sssaj2011.0249
Franzen, D., R.J. Goos, R.J. Norman, T.W. Walker and T.L. Roberts et al., 2011. Field and laboratory studies comparing Nutrisphere-nitrogen urea with urea in North Dakota, Arkansas and Mississippi. J.
Plant Nutr., 34: 1198-1222. DOI:
10.1080/01904167.2011.558162
Hubbard, R.K., J.M. Sheridan, R. Lowrance, D.D. Bosch and G. Vellidis, 2004. Fate of nitrogen from agriculture in the southeastern Coastal Plain. J. Soil Water Cons., 59: 72-86.
Nash, P.R., P.P. Motavalli and K.A. Nelson, 2012. Nitrous oxide emissions from claypan soils due to nitrogen fertilizer source and tillage/fertilizer placement practices. Soil Sci. Soc. Am. J., 76: 983-993. DOI: 10.2136/sssaj2011.0296
Ni, B., M. Liu, S. Lu, L. Xie and Y. Wang, 2011. Environmentally friendly slow-release nitrogen fertilizer. J. Agric. Food Chem., 59: 10169-10175. DOI: 10.1021/jf202131z
Pelster, D.E., F. Larouche, P. Rochette, M.H. Chantigny and S. Allaire et al., 2011. Nitrogen fertilization but not soil tillage affects nitrous oxide emissions from a clay loam soil under a maize-soybean rotation.
Soil Till. Res., 115: 16-26. DOI:
10.1016/j.still.2011.06.001
SAS, 2011. SAS/STAT(R) 9.3 User’s Guide. SAS Institute Inc, Cary, NC.
Shoji, S., J. Delgado, A. Mosier and Y. Miura, 2001. Use of controlled release fertilizers and nitrification inhibitors to increase nitrogen use efficiency and to conserve air and water quality. Commun. Soil Sci. Plant Anal., 32: 1051-1070. DOI: 10.1081/css-100104103
Vaio, N., M.L. Cabrera, D.E. Kissel, J.A. Rema and J.F. Newsome et al., 2008. Ammonia volatilization from urea-based fertilizers applied to tall fescue pastures in Georgia, USA. Soil Sci. Soc. Am. J., 72: 1665-1671. DOI: 10.2136/sssaj2007.0300
Wen, G., T. Mori, T. Yamamoto, J. Chikushi and M. Inoue, 2001. Nitrogen recovery of coated fertilizers and influence on peanut seed quality for peanut plants grown in sandy soil. Commun. Soil Sci. Plant Anal., 32: 3121-3140. DOI: 10.1081/css-120001111 Wilson, M.L., C.J. Rosen and J.F. Moncrief, 2009.