A Multiplex Immunoassay Method for
Simultaneous Quantification of Iron,
Vitamin A and Inflammation Status
Markers
Eleanor Brindle1*., Daniel Stevens2., Christopher Crudder2, Carol E. Levin3, Dean Garrett2,4, Chris Lyman5, David S. Boyle2
1.Center for Studies in Demography and Ecology, University of Washington, 218D Raitt Hall, Box 353412, Seattle, Washington, United States of America,2.PATH, 2201 Westlake Avenue, Suite 200, Seattle, Washington, United States of America,3.Disease Control Priorities Network, University of Washington, 325 Ninth Avenue, Box 359931, Seattle, Washington, United States of America,4.ICF International, 530 Gaither Road, Suite 500, Rockville, Maryland 20850, United States of America,5.Quansys Biosciences, 365 N. 600 W, Logan, Utah 84321, United States of America
.These authors contributed equally to this work.
Abstract
Deficiencies of vitamin A and iron affect a significant portion of the world’s
population, and efforts to characterize patterns of these deficiencies are hampered by a lack of measurement tools appropriate for large-scale population-based surveys. Vitamin A and iron are not easily measured directly, so reliable proxy markers for deficiency status have been identified and adopted. Measurement of inflammatory markers is necessary to interpret vitamin A and iron status markers, because circulating levels are altered by inflammation. We developed a multiplex immunoassay method for simultaneous measurement of five markers relevant to assessing inflammation, vitamin A and iron status:a-1-acid glycoprotein, C-reactive
protein, retinol binding protein 4, ferritin and soluble transferrin receptor. Serum and plasma specimens were used to optimize the assay protocol. To evaluate assay performance, plasma from 72 volunteers was assayed using the multiplex technique and compared to conventional immunoassay methods for each of the five markers. Results of the new and conventional assay methods were highly correlated (Pearson Correlations of 0.606 to 0.991, p,.0001). Inter-assay
imprecision for the multiplex panel varied from 1% to 8%, and all samples fell within the limits of quantification for all assays at a single dilution. Absolute values given by the multiplex and conventional assays differed, indicating a need for further work to devise a new standard curve. This multiplexed micronutrient immunoassay OPEN ACCESS
Citation:Brindle E, Stevens D, Crudder C, Levin CE, Garrett D, et al. (2014) A Multiplex Immunoassay Method for Simultaneous Quantification of Iron, Vitamin A and Inflammation Status Markers. PLoS ONE 9(12): e115164. doi:10. 1371/journal.pone.0115164
Editor:Shantanu Sengupta, CSIR-INSTITUTE OF GENOMICS AND INTEGRATIVE BIOLOGY, India
Received:August 13, 2014
Accepted:November 19, 2014
Published:December 19, 2014
Copyright:ß2014 Brindle et al. This is an open-access article distributed under the terms of the Creative Commons Attribution License, which permits unrestricted use, distribution, and repro-duction in any medium, provided the original author and source are credited.
Data Availability:The authors confirm that all data underlying the findings are fully available without restriction. All relevant data are within the paper.
Funding:Partial support for this research came from a Eunice Kennedy Shriver National Institute of Child Health and Human Development research infrastructure grant, R24 HD042828, to the Center for Studies in Demography & Ecology at the University of Washington, from the Bill and Melinda Gates Foundation to PATH, and from the United States Agency for International Development to PATH. The funders had no role in study design, data collection and analysis, decision to publish, or preparation of the manuscript.
technique has excellent potential as a cost effective tool for use in large-scale deficiency assessment efforts.
Introduction
Micronutrient (MN) malnutrition is a significant public health problem that affects all segments of society in high, middle and low income countries. In low income countries, deficiencies in MNs such as iron, vitamin A (VA), iodine, zinc, and folic acid are associated with adverse health outcomes especially in groups such as pregnant women and children [1–3]. As a consequence, the focus of many public health initiatives is to prevent mild, moderate, and severe MN
malnutrition. While many cost-effective interventions exist for the control of MN malnutrition, including both food fortification and supplementation programs, tools that can effectively assess MN deficiencies are needed to accurately establish the magnitude of the problem and identify subpopulations at greatest risk for prioritizing interventions. Improved MN assessment tools will generate high quality national data on deficiency status that contribute to well-designed control programs [4]. They can also contribute to monitoring the impact of the progress of MN programs after implementation.
In this study we focused on the biochemical detection of VA and iron deficiencies, two of the four most common MN deficiencies, with the others including those of iodine and zinc [5]. MN deficiencies are primarily due to poor diet or malnourishment or both [4]. VA is a critical MN, essential for embryonic development, adult growth and development, cellular differentiation, immune function, reproduction and vision [6]. Therefore pregnant women and young children are especially vulnerable to VA deficiency (VAD). VAD is associated with low dietary intake and sub clinical and clinical deficiency cause increased
morbidity and mortality [7]. Worldwide, 190 million preschool-age children and 19.1 million pregnant women are estimated to have low serum retinol [8], and it is estimated that 157,000 children under 5 years of age die each year from VAD-related illness [9]. The diagnosis of clinical VAD can be performed by assessing vision-related symptoms, such as night blindness [10,11]. Alternatively, clinical and subclinical VAD can be identified by biochemical analysis measuring vitamin A in the form of serum retinol via high pressure chromatography [12], by fluorimetry [13] or by assessing the levels of an accepted surrogate biomarker, retinol binding protein 4 (RBP) [14]. Retinol and RBP are under homeostatic control, and thus are not directly reflective of liver VA stores and are poor indicators of VA excess, but both decrease in the case of VAD [15,16].
deaths and 115,000 maternal deaths linked to IDA worldwide [19]. A variety of laboratory tests can be used to determine the iron status of an individual. Two biomarkers, ferritin and the soluble transferrin receptor (sTfR) are now
commonly used to assess iron status in serum or plasma via enzyme-linked immunosorbent assay (ELISA) based methods [20–22]. Serum ferritin, the major carrier protein of iron in blood, is a good indicator of iron storage as its
concentration declines early in the development of iron deficiency [23–25], but increases with inflammation, independent of iron levels [24]. The sTfR level reflects the functional iron component and its levels increases with the onset of IDA [26]. Elevated sTfR in relation to IDA has been confirmed by the evaluation of stainable marrow iron [27], and sTfR has added value in establishing IDA as, unlike ferritin, it is not influenced by inflammation. However, sTfR is only a marker of iron status in the deficient range, and is not an indicator of iron overload [26]. The combined measurement of both ferritin and sTfR allows the data to be further displayed as the ratio of sTfR/ferritin [28,29], sTfR/log ferritin [30], or log (sTfR/ferritin) [28] to reflect depletion of body iron stores [26]. For the measurement of iron stores, low serum ferritin is noted in the absence of inflammation as the better predictor than sTfR, which reflects tissue iron deficiency rather than body iron stores [26].
Because RBP is a negative acute-phase protein and ferritin is a positive acute phase protein, both their values are altered by subclinical inflammation [31]. C-reactive protein (CRP) anda-acid glycoprotein (AGP) are biomarkers commonly
used to adjust for the influence of subclinical inflammation. Recently, a meta-analysis of datasets of ferritin, CRP and AGP values has shown that correction values for ferritin can be calculated based on the levels of CRP and AGP [32,33].
These biomarkers are typically measured one at a time via a variety of
conventional ELISA kits which, while proven to be accurate, are expensive when used in large volumes. Securing adequately trained and equipped labor needed for screening large specimen sets using conventional ELISA also represents a
significant challenge in most laboratories. One study described the construction of several ELISAs to assess RBP, ferritin, sTfR, and CRP [34]. However, this was not multiplexed in the conventional sense and instead four separate ELISA plates were prepared and analyzed. In addition, each assay required that specific dilutions were used.
Limited funding means that many health agencies and researchers must now analyze smaller data sets, which may not accurately represent the micronutritional status of the target populations.
Multiplex assay methods, in which a single test procedure yields results for multiple analytes, have potential for reducing the labor, supplies, and sample volumes required for MN screening. However, some existing multiplex platforms are not well-suited to use in low to middle income country laboratory
environments. Suspended microscopic bead-based assay platforms [36], like those offered by Luminex (Austin, TX, USA), rely on fluidics systems that require significant routine maintenance and maintenance supplies (e.g. sheath fluid) for proper operation. These systems operate on very different principles from the conventional ELISA protocols with which most lab staff are already familiar, and thus require extensive specialized training and additional equipment. They also involve a longer process of data acquisition, in which bead arrays are passed by a laser in sequential fashion, making even brief interruptions in power supply a significant problem. Planar arrays, in which the assay reactions occur in discrete areas of a rigid, 2-dimensional surface [36], generally require less routine maintenance than bead-based systems and can offer a more familiar assay procedure for those trained in conventional ELISA, particularly when the array is immobilized on the surface of a microtiter plate. One such platform, the Meso Scale Discovery (Rockville, MD, USA), is based on electrochemiluminescent detection, but the instrument required to quantify the assay signal is expensive. The Searchlight multiplexed assay technology offered by Thermo Fisher Scientific (Walthamstow, MA, USA) uses chemiluminescent detection of signals with equipment that is complex and expensive. However, with other appropriately designed assay platforms, chemiluminescent endpoints for multiplexed reactions can also be quantified using comparatively inexpensive and low-maintenance imaging instruments that would be practical for laboratories with limited resources.
In this study we describe the development of a multiplexed MN assessment tool (MMAT) which permits the concurrent measurement of five analytes relevant to vitamin A and iron deficiency surveillance–AGP, CRP, ferritin, RBP and sTfR– from a single 8 mL volume of serum or plasma. The MMAT uses multiplex assay
basic cost analysis of the prototype array was USD$12 per sample compared to a combined cost of USD$34 using five conventional commercial ELISA kits as purchased in the USA.
Materials and Methods
Testing of the MMAT was undertaken in two distinct phases. Phase 1 of testing, led by Program for Appropriate Technology in Health (PATH; Seattle, WA, USA), included contracting Quansys Biosciences to perform initial development of the multiplex assay method and produce assay kits. Preliminary assessments of the MMAT kits and refinements to the protocol were then performed independently by a lab at PATH. Phase 2 of testing included evaluation of MMAT performance as compared to conventional ELISAs, and was conducted by the Biodemography Lab at the University of Washington’s Center for Studies in Demography and Ecology (Seattle, WA, USA).
Phase 1
MMAT assay principles and development
Quansys Biosciences were contracted to conduct the initial assay development using their proprietary Q-Plex technology to construct low density protein arrays with capture antibodies printed on the base of a flat bottomed microtiter plate well [37,38]. The binding of detection moieties, e.g. a biotin labeled antigen or secondary antibody, is measured via the chemiluminescence produced by streptavidin horseradish peroxidase (S-HRP) in the presence of a luminol-based substrate. The intensity of chemiluminescence from each array was measured using the Q-View chemiluminescent imager (Quansys Biosciences). Data were then analyzed using Q-View software (Quansys Biosciences). To assess
quantitation and sensitivity of each assay across their respective ranges, the analyte’s standard dilution series data was analyzed using a 5 parameter logistic (5-PL) regression.
Phosphate buffered saline (PBS) was purchased from Sigma Aldrich Chemical Company (St Louis, MO, USA). Capture antibodies were purchased from HyTest Ltd. (Turku, Finland) including CRP (4C28 C6), RBP 4RB2 RB42, sTfR (4Tr26 13E4) and Sigma Aldrich for AGP (GW22927F). A pair of capture (F23) and detector (F31) antibodies to ferritin was also purchased from HyTest (4F32). Purified sTfR (8Tr56), CRP (8C72) and RBP (8RF9) antigens were purchased from HyTest, Ferritin (RP-87068) was from Thermo Fisher and AGP (G9885) from Sigma Aldrich. The EZ-Link Sulfo-NHS-LC-Biotin labeling kit was purchased from Thermo Fisher. Standards curves were prepared from the Liquichek Immunology control 3 (Bio-Rad Laboratories, Inc., Hercules, CA) as described below.
microtiter plates (Sigma Aldrich) to assess their performance as capture agents (Fig. 1A). The performance of each capture antibody was initially screened via a simple competitive assay which measured the linear depletion of biotinylated antigens in the presence of increasing amounts of unlabeled antigen (seeFig. 1B). Aliquots of each purified antigen were labeled with biotin (EZ-Link Sulfo-NHS-LC-Biotin kit) according to the user instructions for use in the competitive assay format.
The assay for ferritin in a competitive format was not sensitive enough as its working concentration is approximately ten times less than that of the other analytes used in this study. Therefore a more sensitive sandwich immunoassay [39] was developed for ferritin whereby a secondary ferritin monoclonal antibody (F31) was used to bind to ferritin already captured by the fixed capture antibody (F23). This secondary antibody was also labeled with biotin (EZ-Link Sulfo-NHS-LC-Biotin kit) and therefore could be detected by same the S-HRP reporter method. In this format the ferritin assay had sufficient sensitivity over physiologically relevant concentration ranges. All assays were then integrated together as five spot multiplexed arrays printed in single wells of a 96 well plate (Fig. 1).
Quansys Biosciences supplied the MMAT assays to PATH in a kit format with the five assays multiplexed in each well for evaluation using serum and plasma specimens. The kits contained prepared plates, sample diluent and lyophilized diluent additive containing the biotin labeled antigen competitors (AGP, CRP, RBP, sTfR) and detection mix containing labeled secondary antibody (ferritin), wash solution concentrate, streptavidin-horseradish peroxidase (S-HRP) con-jugate and chemiluminescent substrate.
Conventional immunoassays
Conventional ELISA kits widely used in previous MN status surveillance efforts [35,40] were selected as the reference method to which the new multiplex method would be compared (Table 1). A kit from Ramco Laboratories Inc. (Stafford, TX, USA; cat # TFC-94) was used to measure sTfR. According to the manufacturer’s evaluation of assay performance, the limit of detection (LOD) is 0.07 mg/mL,
intra-assay CV for six serum specimens assayed in 10 replicate wells ranged from 2.4% to 5.8% for mean sTfR concentrations ranging from 5.5 to 14.9 mg/mL, and
Fig. 1. Fig. 1A. The arrangement of multiplexed assays in each well.A, alpha-1-acid glycoprotein; C, C-reactive protein; F, ferritin; R, retinol binding protein 4; sT, soluble transferrin receptor.Fig. 1B. An image of 8 array wells demonstrating the chemiluminescence generated from assay spots.The top left hand well (well 1) indicates the highest concentration of standard followed by six subsequent two-fold dilutions (wells 2 through 7). The final lower right hand well (well 8) is the buffer-only negative control.
inter-assay CV, evaluated by assaying 12 serum specimens in duplicate over five weeks, ranged from 3.6%–8.1% for concentrations from 4.1 to 16.1 mg/mL.
Ramco Laboratories also supplied the ferritin kit (cat #S-22). The LOD is 0.59 ng/ mL. Intra-assay CV, evaluated using 8 assay runs, ranges from 4.7%–9.6% and inter-assay CV, evaluated using 12 assay runs, ranges from 6.8% to 8.7%. RBP4 was measured using the Scimedx Scanlisa RBP EIA (Scimedx Corp., Denville, NJ, USA; cat #RBP196), originally developed and validated at PATH [41]. The assay LOD is 1.1 mg/mL. Intra-assay CV is 6.7% and inter-assay CV is 8.9%. AGP was
measured using an ELISA reagent kit supplied by Genway Biotech, Inc. (San Diego, CA, USA; cat# 40-288-22927F). The LOD is 0.00391 mg/mL. Intra- and
inter- assay CVs for controls prepared in assay buffer from pure human AGP and run in duplicate were 6.2% and 7.1%, respectively, for the low (0.0087 mg/mL)
control and 4.0% and 0.5% for the high (0.0318 mg/mL) control (n510 plates). An assay kit supplied by IBL-America (Minneapolis, MN, USA; cat # IB79102) was used to measure CRP. The kit had a LOD of ,1 mg/mL. Intra-assay CV
(n510) ranged from 5.12% to 6.84% and inter-assay CV (n57) ranged from 11.6%–12.7%. Each immunoassay was carried out according to the manufac-turer’s specific instructions. Spectral data was read using a SpectraMax M2 reader (Molecular Devices, Sunnyvale, CA, USA).
MMAT assay protocol optimization and preliminary evaluation
A commercially available control, the Liquichek Immunology control level 3 (Bio-Rad), was used to produce standard curves for the MMAT. Liquichek 3 is a pooled
Table 1.Assay precision and limits of detection (LOD) for conventional ELISAs.
Assay Supplier LOD Control
Intra-assay precision (mean, CV)
Inter-assay precision (mean, CV)
AGP (mg/mL) Genway 0.0039 High 0.0318, 4.0% 0.0318, 0.5%
Low 0.0087, 6.2% 0.0087, 7.1%
CRP (mg/mL) IBL America (PATH lab) ,1 High 48.3, 6.84% 67.2, 12.7%
Medium — 31.0, 11.6%
Low 5.2, 5.12% 4.3, 14.3%
in-house (UW lab) 0.00015 High 0.0063, 2.7% 0.0063, 9.9%
Low 0.0033, 3.5% 0.0033, 9.4%
Ferritin (ng/mL) Ramco Laboratories, Inc. 0.59 High 208.0, 4.7% 219.0, 8.7%
Medium 54.5, 9.6% 55.7, 7.7%
Low 10.4, 5.8% 11.0, 6.8%
RBP (mg/mL) Scimedx Corp. 1.1 { 8.9–37.8, 6.7% 8.9–37.8, 8.9%
sTfR (mg/mL) Ramco Laboratories, Inc. 0.07 High* 14.9, 3.5% 16.1, 5.0%
Medium 9.4, 5.8% 7.3, 7.3%
Low 5.5, 2.4% 4.1, 4.4%
Coefficients of variation (CV) for the conventional ELISA kits against which the multiplexed micronutrient assessment tool (MMAT) was compared. AGP, alpha-1-acid glycoprotein; CRP, C-reactive protein; RBP, retinol binding protein 4; sTfR, soluble transferrin receptor.
{For RBP, precision given as average intra- and inter-assay CVs in the calibrated range.
*For sTfR, 3 values are presented from the 6 reported for intra- and 12 provided for inter-assay CV in the kit insert.
serum-based matrix and has previously been described to contain the biomarkers within the critical ranges required to assess VAD, IDA and inflammation [34]. In the prototype design work the median values supplied with the product insert were used for AGP, CRP and ferritin and the concentrations of RBP and sTfR determined via conventional ELISA kit measurement. However, because the Liquichek controls are derived from pooled human serum, there is lot-to-lot variance and values specified in the product insert vary by analysis method used. Before analyzing samples with both the conventional ELISA kits and MMAT, the concentration of each of the five analytes in a new lot of Liquichek 3 was estimated using the conventional ELISA kits. Liquichek 3 samples were prepared in either two or three dilution sets that reflected the mid-range concentration of the standard curve for each assay. Each dilution of Liquichek 3 was screened ten times per plate, and the average resulting concentrations were used as known doses to form the basis for MMAT calibration.
Using the Liquichek 3 dilution series, the general performance of the MMAT for low to high concentrations of the pooled analytes was assessed. A series of serial dilutions of the Liquichek 3 were used to establish the LOD to ensure that the assays could accurately detect low concentrations of each analyte below the thresholds used to determine sufficiency/deficiency. The data sets used to estimate the analyte concentrations for the Bio-Rad Liquichek 3 standard curve data were also used to assess inter- and intra-assay coefficient of variation (CV). The high, medium and low concentrations of the analytes were used for both measurements. The inter-assay CV used 3 dilutions sets of the Liquichek standards. For the intra-assay CV individual values were pooled from 3 plates (9 single data points per analyte concentration). Assay linearity was assessed by assaying three serum samples at 1:2, 1:4, 1:8 and 1:16 and comparing results at the 1:2 dilution series to results at each subsequent dilution.
Serum and plasma specimens
For Phase 1 of testing, we purchased specimen sets from eight adults as serum, lithium heparin plasma and K-EDTA plasma from Bioreclamation Inc.
(Westbury, NY, USA). Each sample was centrifuged at 1,500 rpm (approximately 6706g) in a swing-bucket centrifuge for 10 minutes at 4
˚
C and multiple 450 mLaliquots were stored at 280
˚
C until use. Preliminary testing of MMATperformance with a variety of sample types was conducted by comparing MMAT results with conventional ELISA kit measurements from these 8 matched
MMAT assay procedure
Standard curves for each analyte were prepared by diluting the Liquichek 3 by 1 in 10 in sample diluent and then as a further series of six twofold dilutions to create a seven point dilution set in addition to a sample diluent only negative control (see
Table 2). 50 mL of serum or plasma specimens diluted 1:20 in sample diluent were
added to the plate in duplicate wells.
After addition of the standards and samples, each plate was incubated at room temperature on a flatbed shaker (Thermo Fisher) at 500 rpm for 1 hour. The wells were then aspirated and washed 5 times with 300 mL of 1x PBS (ELx50 plate
washer, BioTek Instruments, Inc., Winooski, VT, USA). A 50 mL aliquot of the
detection mix was then added to each well and the plate then mixed for a further hour and then washed as described above. Labeling was performed by adding 50 mL S-HRP to each well and shaking for 15 minutes at 500 rpm. The substrate
parts A and B were mixed in equal volumes and 50 mL of the mixture was added
to each well. Each plate was then imaged three times using the Q-View imager with exposure times of 60, 150 and 300 seconds respectively. Using Q-View software the images were then automatically overlaid and the chemiluminescent intensity of each spot, in each well measured. The software was programmed to create standard curves using a 5-PL regression for the 5 biomarker standards based on the concentrations derived from monoplex analysis (Table 2). The concentration of each analyte in each test well was then automatically generated using the standard curves as reference.
Phase 2
In phase 2 of testing, a set of 72 specimens (lithium heparin plasma) from 36 males and 36 females, procured from Bioreclamation, was used to evaluate MMAT performance using conventional ELISAs as a gold-standard. Samples were prepared and stored as described above. These 72 lithium heparin plasma specimens were assayed in the Biodemography Lab at the University of
Washington using the MMAT assay procedure as described above, but with the addition of 10 mM EDTA to the sample diluent, as was indicated by the results of Phase 1 testing, described in more detail below.
The same monoplex assays described above for Phase 1 were used for sTfR, RBP and AGP. Bioreclamation provided conventional assay data for ferritin. To reduce costs, the CRP ELISA kit used in Phase 1 was replaced with an in-house sandwich ELISA using monoclonal capture (clone C5) and detection (clone C6) antibodies (Meridian Life Science, Inc., Cincinnati, OH, USA) [42]. The CRP assay has high sensitivity, with a limit of quantification of 0.00015 mg/L. For plasma controls, intra- and inter-assay CVs were 3.5% and 9.4% respectively for the low
Results from the conventional ELISAs and the MMAT for the set of 72 heparinized plasma specimens were compared by a variety of methods. Comparisons by Pearson correlation and scatter plots were used to evaluate whether results from the assays covaried. Absolute levels were compared by Bland–Altman analysis [43,44] and by expressing results from the MMAT assay as a percentage of the results from conventional assays.
Results
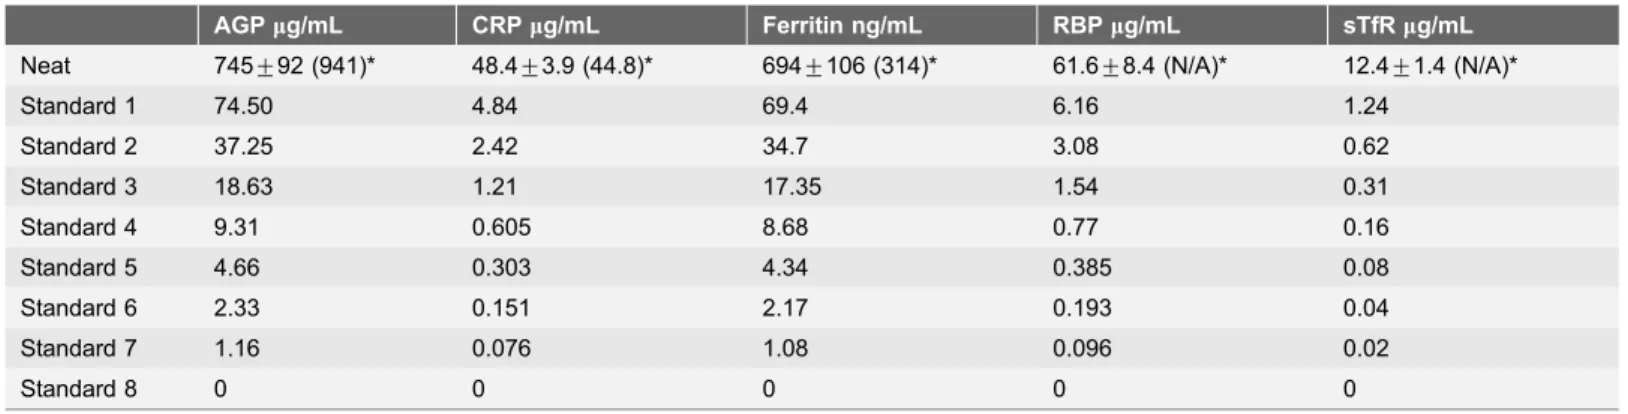
Final concentration values as determined by conventional ELISAs for each analyte in the Liquichek 3 control are listed in the top row of Table 2. The average concentration of AGP in the Liquichek 3 control was described by the
manufacturer as being 941 mg/mL. The concentration of AGP Liquichek 3 control
using the GenWay assay was established by making three dilutions of 1:5000, 1:25000 and 1:125000. In this analysis the mean ¡SD concentration of AGP was estimated to be 745¡92 mg/mL. The average CRP concentration for Liquichek 3
control as reported by the manufacturer was 44.8 mg/mL. The dilution series for
use with the CRP assay were 1:1, 1:2 and 1:4 and the final concentration established to be 48.4¡3.9 mg/mL. The mean concentration of ferritin was
314 ng/mL. Our reanalysis of this gave a markedly higher value of 694¡106 ng/ mL. The RBP concentration in the Liquichek 3 control was not supplied by the manufacturer’s datasheet and in this case a dilution series of 1:2, 1:4 and 1:8 were used based on previous observations (data not shown). The RBP concentration was established to be 61.6¡8.4 mg/mL (2.93¡0.4mmol/L). Likewise
concentra-tion was not supplied for sTfR. The control was diluted 1:1 and 1:2 prior to further dilution according to kit protocol. The sTfR concentration was estimated to be 12.4¡1.4 mg/mL.
Table 2.Standard concentrations.
AGPmg/mL CRPmg/mL Ferritin ng/mL RBPmg/mL sTfRmg/mL Neat 745¡92 (941)* 48.4¡3.9 (44.8)* 694¡106 (314)* 61.6¡8.4 (N/A)* 12.4¡1.4 (N/A)*
Standard 1 74.50 4.84 69.4 6.16 1.24
Standard 2 37.25 2.42 34.7 3.08 0.62
Standard 3 18.63 1.21 17.35 1.54 0.31
Standard 4 9.31 0.605 8.68 0.77 0.16
Standard 5 4.66 0.303 4.34 0.385 0.08
Standard 6 2.33 0.151 2.17 0.193 0.04
Standard 7 1.16 0.076 1.08 0.096 0.02
Standard 8 0 0 0 0 0
The revised concentration of the Liquichek 3 control analytes in the test well as measured via the conventional ELISAs (mean¡SD). The standard spans points 1–7 of subsequent twofold dilutions with 8, a diluent only negative control, completing the set. AGP, alpha-1-acid glycoprotein; CRP, C-reactive protein; RBP, retinol binding protein 4; sTfR, soluble transferrin receptor.
* The mean concentrations provided with the Liquichek 3 product insert.
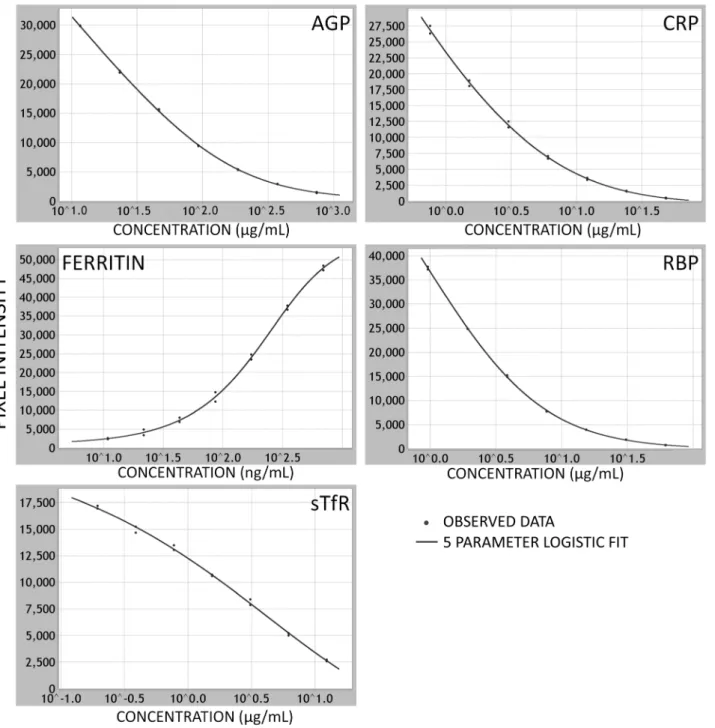
Initial MMAT assay development conducted by Quansys Biosciences resulted in assay kits with a dose-response relationship across the relevant physiological ranges for all five analytes. Using the Liquichek 3 as a standard, the data from the dilution series for each analyte indicated that the performance of each assay in the prototype multiplexed array is sufficient across the relevant concentration ranges required to assess deficiency or inflammation (Fig. 2). Screening of the
multiplexed arrays with purified individual antigens did not show any cross reactivity with the other capture assays on the array.
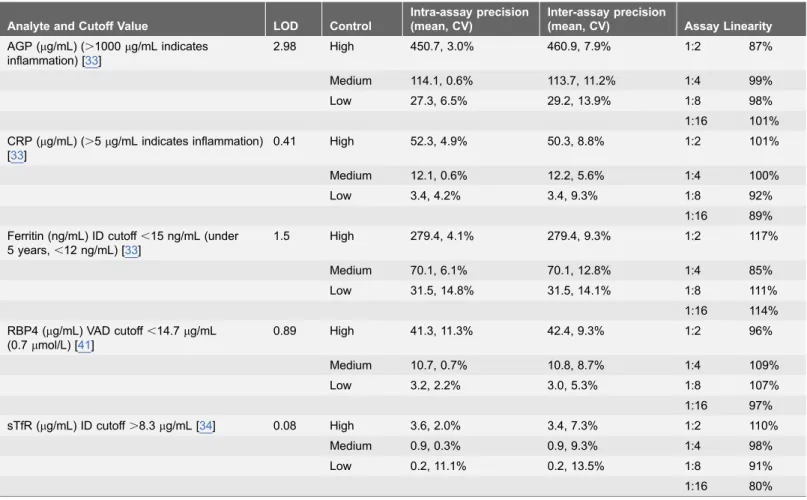
Estimates of LOD and intra- and inter-assay imprecision are shown inTable 3. CVs fell within acceptable ranges (,15%) for all analytes. Tests of assay linearity yielded results ranging from 80% to 117% with no evidence of systematic non-parallelism across dilutions for any analyte (Table 3).
Phase 1 MMAT testing conducted using a set of 8 matched serum, heparin plasma and EDTA plasma revealed significant differences in concentration by sample matrix for some sample type-analyte combinations (Fig. 3). In particular, MMAT CRP, ferritin and sTfR concentrations from serum and heparin plasma specimens differed more from monoplex results than did MMAT results for EDTA plasma, and in some cases were outside the assay range at the same dilution that provided valid results for EDTA plasma specimens. When the dilutions of serum and heparin plasma were prepared in sample diluent containing 10 mM EDTA, a concentration similar to that of EDTA plasma samples, results were in closer agreement with monoplex assays and results for EDTA plasma in the MMAT. The presence or absence of 10 mM EDTA in the sample diluent did not show marked effects on AGP or RBP results.
After optimizing the MMAT protocol for use across sample types, results from this small set of specimens indicated that a dilution of 1:20 was effective for these samples for all analytes. 160 mL of 1:20 pre-diluted samples were prepared to
provide sufficient volume to add 50 mL per well in duplicate using a
multi-channel pipette. Thus, the total initial sample volume required to measure all five analytes was only 8 mL.
In the following evaluation, 72 heparin plasma specimens were measured in the MMAT assay and conventional monoplex assays. At a dilution of 1:20, the MMAT produced results within range for all specimens and all analytes, with the exception of 9 specimens for which ferritin results were below the LOD. Those 9 specimens were assayed again at a 1:10 dilution, and were quantifiable at that dilution, but still fell near the lower end of the Quansys ferritin assay range.
Fig. 2. Standard curves for each of the 5 analytes.The standard curves generated after 5-PL regression analysis across seven twofold dilutions of the Liquichek 3 standards for each assay in the multiplexed array. AGP, CRP, RBP and sTfR assay plots are from the basic antigen competitor assays and show concomitant decrease in chemiluminescence as the concentration of analyte is increased reflecting the non-labeled antigen out-competing the biotinylated antigen. In the ferritin sandwich assay, the chemiluminescence increases with analyte concentration reflecting the increased binding of the labeled secondary antibody to the captured ferritin. AGP, alpha-1-acid glycoprotein; CRP, C-reactive protein; RBP, retinol binding protein 4; sTfR, soluble transferrin receptor.
Discussion
Our evaluation found that this multiplex assay method performed well for simultaneous assessment of 5 analytes, AGP, CRP, ferritin, sTfR and RBP, using only 8 mL of specimen. This method offers a promising alternative to carrying out
five individual assays to measure these markers. At approximately USD$12 per specimen, this assay kit costs significantly less than measuring the same five analytes with separate kits, which would total about USD $35 for the commercial conventional assay kits we used here. The MMAT method also takes less time to carry out and uses significantly less sample volume. If a technician were to run five separate conventional ELISAs on a single sample set, a significant amount of time must be taken in preparing samples at the appropriate dilution for each kit, whereas with Quansys assay only one sample dilution preparation step is required. Furthermore, preparation of the standard curve need only be performed once on the Quansys platform as opposed to five separate standard serial dilutions for individual kits. The complexity of preparing multiple dilution series can also
Table 3.Assay precision, ranges, lower limits of detection (LOD) and assay linearity for MMAT.
Analyte and Cutoff Value LOD Control
Intra-assay precision (mean, CV)
Inter-assay precision
(mean, CV) Assay Linearity AGP (mg/mL) (.1000mg/mL indicates
inflammation) [33]
2.98 High 450.7, 3.0% 460.9, 7.9% 1:2 87%
Medium 114.1, 0.6% 113.7, 11.2% 1:4 99%
Low 27.3, 6.5% 29.2, 13.9% 1:8 98%
1:16 101% CRP (mg/mL) (.5mg/mL indicates inflammation)
[33]
0.41 High 52.3, 4.9% 50.3, 8.8% 1:2 101%
Medium 12.1, 0.6% 12.2, 5.6% 1:4 100%
Low 3.4, 4.2% 3.4, 9.3% 1:8 92%
1:16 89% Ferritin (ng/mL) ID cutoff,15 ng/mL (under
5 years,,12 ng/mL) [33]
1.5 High 279.4, 4.1% 279.4, 9.3% 1:2 117%
Medium 70.1, 6.1% 70.1, 12.8% 1:4 85%
Low 31.5, 14.8% 31.5, 14.1% 1:8 111%
1:16 114% RBP4 (mg/mL) VAD cutoff,14.7mg/mL
(0.7mmol/L) [41]
0.89 High 41.3, 11.3% 42.4, 9.3% 1:2 96%
Medium 10.7, 0.7% 10.8, 8.7% 1:4 109%
Low 3.2, 2.2% 3.0, 5.3% 1:8 107%
1:16 97% sTfR (mg/mL) ID cutoff.8.3mg/mL [34] 0.08 High 3.6, 2.0% 3.4, 7.3% 1:2 110%
Medium 0.9, 0.3% 0.9, 9.3% 1:4 98%
Low 0.2, 11.1% 0.2, 13.5% 1:8 91%
1:16 80%
AGP, alpha-1-acid glycoprotein; CRP, C-reactive protein; RBP, retinol binding protein 4; sTfR, soluble transferrin receptor; ID, iron deficiency; VAD, vitamin A deficiency; MMAT, multiplexed micronutrient assessment tool; CV, coefficient of variation.
create a greater opportunity for catastrophic error in setting up the varied conventional ELISAs. Finally, the Quansys Q-plex platform offers significant reduction of consumables waste, such as pipette tips and wash solution, since only
Fig. 3. Effects of sample type and addition of EDTA to diluent.AGP, alpha-1-acid glycoprotein; CRP, C-reactive protein; RBP, retinol binding protein 4; sTfR, soluble transferrin receptor.
doi:10.1371/journal.pone.0115164.g003
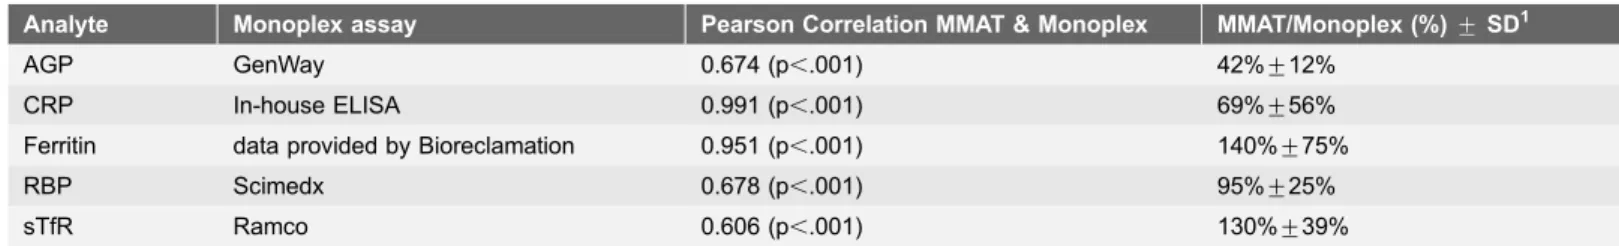
Table 4.Comparisons of MMAT and conventional monoplex assay results from 72 heparin plasma specimens.
Analyte Monoplex assay Pearson Correlation MMAT & Monoplex MMAT/Monoplex (%)¡SD1
AGP GenWay 0.674 (p,.001) 42%¡12%
CRP In-house ELISA 0.991 (p,.001) 69%¡56%
Ferritin data provided by Bioreclamation 0.951 (p,.001) 140%¡75%
RBP Scimedx 0.678 (p,.001) 95%¡25%
sTfR Ramco 0.606 (p,.001) 130%¡39%
MMAT, multiplexed micronutrient assessment tool; AGP, alpha-1-acid glycoprotein; CRP, C-reactive protein; RBP, retinol binding protein 4; sTfR, soluble transferrin receptor.
1
MMAT/Monoplex (%)¡SD refers to concentration of analyte as measured by MMAT as a percent of that measured in the conventional monoplex assay.
Fig. 4. Scatterplots of Quansys MMAT results versus conventional assay results.Concentrations of each analyte as measured in the Quansys MMAT (y-axes) plotted against concentrations measured using conventional assays (x-axes) for 72 plasma specimens (log scales). Solid line is linear regression. AGP, alpha-1-acid glycoprotein; CRP, C-reactive protein; RBP, retinol binding protein 4; sTfR, soluble transferrin receptor.
doi:10.1371/journal.pone.0115164.g004
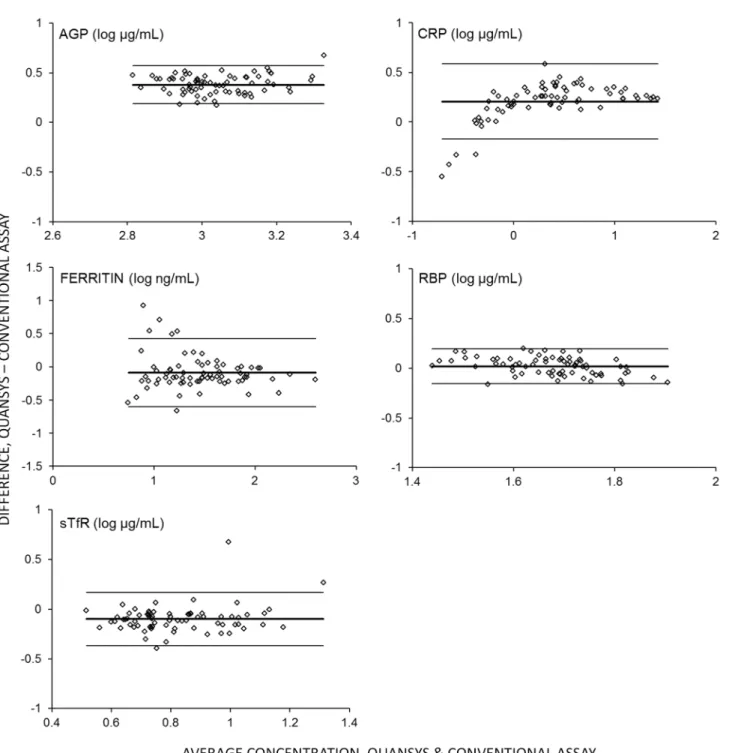
Fig. 5. Bland-Altman analysis.Bland-Altman plots of differences between log concentrations (y-axes) versus the average concentrations (x-axes) for each analyte in 72 plasma specimens assayed using the Quansys MMAT and conventional assays. Center solid line indicates mean difference; upper and lower solid lines indicate the 95% confidence interval. AGP, alpha-1-acid glycoprotein; CRP, C-reactive protein; RBP, retinol binding protein 4; sTfR, soluble transferrin receptor.
one plate’s worth of consumables is used. Overall, the labor, plate and consumable cost savings of the Quansys platform offer a significant advantage over
conventional ELISAs.
One limitation of this study, and of the MMAT in its present form, is the assay’s calibration. A commercially available control, the Bio-Rad Liquichek Immunology control level 3, was assayed in conventional ELISAs for the five analytes to estimate concentrations that were then used to calibrate the MMAT assays. This method has been used previously [34], but because the relative quantities of each analyte are fixed, this approach does not allow for optimal adjustment of the standard curve ranges to precisely span the relevant clinical range for each of the 5 analyte assays in the panel. Further investigation is required to optimize the assay calibrators using purified or recombinant antigen cocktails. This would provide flexibility to adjust the standard curve to encompass the relevant ranges and therefore minimize the need to retest specimens out of range. This is particularly important for the ferritin assay, for which some samples in our study had to be assayed again at 1:10 to achieve an accurate measurement. A threshold of 12 ng/ mL ferritin for children under 5 and 15 ng/mL for adults is indicative of depleted iron stores [33]. The current LOD for the MMAT ferritin assay (1.5 ng/mL) above those cut-off values when samples are assayed at a 1:20 dilution. While the assay LOD is adequate to allow quantification of ferritin values at or below the threshold, it would require re-assay of the specimens at a lower dilution. For the four other analytes, the MMAT assay LOD is significantly lower than the relevant threshold values even when the samples are diluted to 1:20 (Table 3).
Improvements to the calibration system will also require adjustments to produce absolute values that are in agreement with established methods. Differences in absolute value between the conventional ELISAs and the MMAT were consistent across concentration, with very few specimens falling outside the 95% confidence intervals in our Bland-Altman analysis (Fig. 5), suggesting that a simple correction may be successful in producing agreement between methods.
A limitation of our evaluation of this assay method is that the specimens used were not collected from a low or middle income country population where VAD and IDA are known to be prevalent. More work is required to evaluate this assay panel with a larger set of specimens known to represent the full physiological range of the biomarkers measured, and to compare the results to other commonly used methods, such as the assays described by Erhardt et al. [34]. However, MN deficiency is not confined to developing world populations, as the 72 specimens used in this work to evaluate the MMAT assay performance did include a broad physiological range, including specimens that would be categorized as indicating deficiencies in both iron and vitamin A, and with specimens in both the high and low ranges for AGP and CRP.
solid and liquid bead-based multiplex arrays are commercially available from a variety of vendors and are in use by many high-income country laboratories. However, bead-based arrays are complex to operate and maintain, requiring significant user training and a vacuum system or centrifuge to wash the beads. In addition, sheath fluid and other critical associated consumables increase costs and are potentially difficult to supply to developing countries. Further, the clumping of beads blocking the flow sheath is a common problem when used incorrectly. The planar arrays have similar requirements to the Quansys assay which leverage upon equipment also used for conventional ELISAs, such as a plate shaker, washers and pipettors. However, the core equipment is much more expensive and the timely maintenance of complex optical or electrical instruments in austere settings is a concern.
The Quansys Biosciences multiplex technology overcomes some, but not all, of these difficulties. The assay principle is familiar to those practiced in conventional ELISA, and thus the steps involved in executing the assay are familiar to
laboratory staff. Quantification of the chemiluminescent signal the kits generate requires relatively simple equipment. Quansys offers an imager (Q-View) but other types of imager may be used, like those used for other common laboratory methods yielding a chemiluminescent end points, like western blots. In contrast to the Luminex, for example, which requires extensive training in instrument operation and routine maintenance, imagers are, at their most basic, a high pixel intensity digital camera inside a light-proof box, and therefore require minimal training, have no moving parts and do not require routine calibration and/or extensive maintenance. This makes this platform simpler to adopt, and is better-suited to developing country laboratories where instruments may be subjected to imperfect climate control and access to basic laboratory consumables, calibration materials and maintenance contracts are limited. The Quansys system also has advantages where electrical power service may be frequently interrupted. Bead-based multiplex assay techniques rely on relatively time-consuming data
acquisition processes, whereas the Quansys plate image capture is relatively quick (under 3 minutes for the entire plate), and the chemiluminescent reaction used to quantify the assay signal is stable for several hours — long enough to allow the operator to restart the plate imaging process in the event of a power interruption.
Adapting this panel for use with dried blood spot specimens (DBS) would also improve the usefulness of the MMAT for large-scale public health surveillance projects. Because ferritin cannot be measured accurately in DBS [46], it would be necessary to include an alternative indicator of iron status, such as hepcidin [47]. The other four markers in the existing panel have been measured successfully with DBS, as have a number of other markers of infectious diseases and
non-communicable diseases that could potentially be added to this multiplex panel. Multiplex methods offer a practical solution to the difficulties in assaying multiple analytes using the small sample volumes DBS and other forms of capillary blood collection can yield.
In conclusion, we have developed the MMAT to be a valuable tool for practical and efficient assessment of a panel of analytes related to iron and vitamin A assessment at greatly reduced cost compared to current methods. The simplicity of this multiplex method makes it a better fit than other multiplex platforms for large-scale public health projects, particularly those conducted in low to middle income countries. This assay platform has excellent potential for future expansion for use with DBS and to add more markers relevant to global health concerns.
Author Contributions
Conceived and designed the experiments: EB DS CC CEL DG CL DSB. Performed the experiments: EB DS CL. Analyzed the data: EB DS CC CL DSB. Contributed reagents/materials/analysis tools: CL DSB. Wrote the paper: EB CC DSB.
References
1. Elmadfa I, Meyer AL(2012) Vitamins for the first 1000 days: preparing for life. Int J Vitam Nutr Res 82: 342–347. Available:http://www.ncbi.nlm.nih.gov/pubmed/23798053. Accessed 15 August 2013.
2. Chang S, Zeng L, Brouwer ID, Kok FJ, Yan H(2013) Effect of iron deficiency anemia in pregnancy on child mental development in rural China. Pediatrics 131: e755–63. Available:http://www.ncbi.nlm.nih. gov/pubmed/23400604. Accessed 15 August 2013.
3. Mitka M(2013) Even mild iodine deficiency during gestation may impair brain function in children. JAMA 309: 2428. Available:http://www.ncbi.nlm.nih.gov/pubmed/23780437. Accessed 15 August 2013.
4. Muthayya S, Rah JH, Sugimoto JD, Roos FF, Kraemer K, et al.(2013) The global hidden hunger indices and maps: an advocacy tool for action. PLoS One 8: e67860. Available:http://www.
pubmedcentral.nih.gov/articlerender.fcgi?artid53680387&tool5pmcentrez&rendertype5abstract. Accessed 15 August 2013.
5. Ahmed T, Hossain M, Sanin KI (2012) Global burden of maternal and child undernutrition and micronutrient deficiencies. Ann Nutr Metab 61 Suppl 1: 8–17. Available:http://www.ncbi.nlm.nih.gov/ pubmed/23343943. Accessed 15 August 2013.
6. Bender D (2003) Vitamin A: retinoids and carotenoids. Nutritional Biochemistry of the Vitamins. Cambridge: Cambridge University Press. pp. 30–76.
7. Ezzati M, Lopez AD, Rodgers A, Vander Hoorn S, Murray CJL(2002) Selected major risk factors and global and regional burden of disease. Lancet 360: 1347–1360. Available:http://www.ncbi.nlm.nih.gov/ pubmed/12423980.
9. Black RE, Victora CG, Walker SP, Bhutta ZA, Christian P, et al. (2013) Maternal and child undernutrition and overweight in low-income and middle-income countries. Lancet 382: 427–451. Available:http://www.ncbi.nlm.nih.gov/pubmed/23746772. Accessed 25 May 2014.
10. Courtright P, Hutchinson AK, Lewallen S(2011) Visual impairment in children in middle- and lower-income countries. Arch Dis Child 96: 1129–1134. Available:http://www.ncbi.nlm.nih.gov/pubmed/ 21868404. Accessed 15 August 2013.
11. Cascella M, Ba¨rfuss S, Stocker A (2013) Cis-retinoids and the chemistry of vision. Arch Biochem Biophys. Available:http://www.ncbi.nlm.nih.gov/pubmed/23791723. Accessed 15 August 2013.
12. De Ruyter MG, De Leenheer AP(1976) Determination of serum retinol (vitamin A) by high-speed liquid chromatography. Clin Chem 22: 1593–1595. Available:http://www.ncbi.nlm.nih.gov/pubmed/975502. Accessed 15 August 2013.
13. Chaimongkol L, Pinkaew S, Furr HC, Estes J, Craft NE, et al.(2011) Performance of the CRAFTi portable fluorometer comparing with the HPLC method for determining serum retinol. Clin Biochem 44: 1030–1032. Available:http://www.ncbi.nlm.nih.gov/pubmed/21664345. Accessed 15 August 2013.
14. Gamble MV, Ramakrishnan R, Palafox NA, Briand K, Berglund L, et al.(2001) Retinol binding protein as a surrogate measure for serum retinol: studies in vitamin A-deficient children from the Republic of the Marshall Islands. Am J Clin Nutr 73: 594–601. Available:http://www.ncbi.nlm.nih.gov/pubmed/ 11237937. Accessed 15 August 2013.
15. Tanumihardjo S a(2011) Vitamin A: biomarkers of nutrition for development. Am J Clin Nutr 94: 658S– 65S. Available:http://www.pubmedcentral.nih.gov/articlerender.fcgi?artid53142734&tool5pmcentrez& rendertype5abstract.
16. de Pee S, Dary O(2002) Biochemical indicators of vitamin A deficiency: serum retinol and serum retinol binding protein. J Nutr 132: 2895S–2901S. Available:http://www.ncbi.nlm.nih.gov/pubmed/12221267. Accessed 26 September 2011.
17. Miller JL(2013) Iron deficiency anemia: a common and curable disease. Cold Spring Harb Perspect Med 3. Available:http://www.ncbi.nlm.nih.gov/pubmed/23613366. Accessed 15 August 2013.
18. McLean E, Cogswell M, Egli I, Wojdyla D, de Benoist B(2009) Worldwide prevalence of anaemia, WHO Vitamin and Mineral Nutrition Information System, 1993–2005. Public Health Nutr 12: 444–454. Available:http://www.ncbi.nlm.nih.gov/pubmed/18498676. Accessed 8 August 2013.
19. Stoltzfus R, Mullany L, Black R(2004) Iron Deficiency Anaemia. In: Ezzati M, Lopez AD, Rodgers A, Murray CJL, editors. Comparative quantification of health risks: The global and regional burden of disease attributable to selected major risk factors. Geneva: World Health Organization.
20. Ishikawa K, Narita O, Saito H, Kato K(1982) Determination of ferritin in urine and in serum of normal adults with a sensitive enzyme immunoassay. Clin Chim Acta 123: 73–81. Available:http://www.ncbi. nlm.nih.gov/pubmed/6749338. Accessed 13 June 2014.
21. Hikawa A, Nomata Y, Suzuki T, Ozasa H, Yamada O(1996) Soluble transferrin receptor-transferrin complex in serum: measurement by latex agglutination nephelometric immunoassay. Clin Chim Acta 254: 159–172. Available:http://www.ncbi.nlm.nih.gov/pubmed/8896904. Accessed 13 June 2014.
22. Akesson A, Bjellerup P, Vahter M(1999) Evaluation of kits for measurement of the soluble transferrin receptor. Scand J Clin Lab Invest 59: 77–81. Available:http://www.ncbi.nlm.nih.gov/pubmed/10353319. Accessed 13 June 2014.
23. Ng RH, Brown BA, Valdes R(1983) Three commercial methods for serum ferritin compared and the high-dose ‘‘hook effect’’ eliminated. Clin Chem 29: 1109–1113. Available:http://www.ncbi.nlm.nih.gov/ pubmed/6851105. Accessed 15 August 2013.
24. Cook JD(2005) Diagnosis and management of iron-deficiency anaemia. Best Pract Res Clin Haematol 18: 319–332. Available:http://www.ncbi.nlm.nih.gov/pubmed/15737893. Accessed 15 August 2013.
25. Guagnozzi D, Severi C, Ialongo P, Viscido A, Patrizi F, et al.(2006) Ferritin as a simple indicator of iron deficiency in anemic IBD patients. Inflamm Bowel Dis 12: 150–151. Available:http://www.ncbi.nlm. nih.gov/pubmed/16432381. Accessed 15 August 2013.
27. Ervasti M, Kotisaari S, Romppanen J, Punnonen K(2004) In patients who have stainable iron in the bone marrow an elevated plasma transferrin receptor value may reflect functional iron deficiency. Clin Lab Haematol 26: 205–209. Available:http://www.ncbi.nlm.nih.gov/pubmed/15163319.
28. Malope BI, MacPhail AP, Alberts M, Hiss DC(2001) The ratio of serum transferrin receptor and serum ferritin in the diagnosis of iron status. Br J Haematol 115: 84–89. Available:http://www.ncbi.nlm.nih.gov/ pubmed/11722416. Accessed 15 August 2013.
29. Rimon E, Levy S, Sapir A, Gelzer G, Peled R, et al.(2002) Diagnosis of iron deficiency anemia in the elderly by transferrin receptor-ferritin index. Arch Intern Med 162: 445–449. Available:http://www.ncbi. nlm.nih.gov/pubmed/11863478. Accessed 15 August 2013.
30. Cermak J, Brabec V (1998) Transferrin receptor-ferritin index: a useful parameter in differential diagnosis of iron deficiency and hyperplastic erythropoiesis. Eur J Haematol 61: 210–212. Available:
http://www.ncbi.nlm.nih.gov/pubmed/9753418. Accessed 13 June 2014.
31. Northrop-Clewes CA(2008) Interpreting indicators of iron status during an acute phase response— lessons from malaria and human immunodeficiency virus. Ann Clin Biochem 45: 18–32. Available:http:// www.ncbi.nlm.nih.gov/pubmed/18275670. Accessed 19 April 2013.
32. Thurnham DI, McCabe LD, Haldar S, Wieringa FT, Northrop-Clewes CA, et al.(2010) Adjusting plasma ferritin concentrations to remove the effects of subclinical inflammation in the assessment of iron deficiency: a meta-analysis. Am J Clin Nutr 92: 546–555. Available:http://www.ncbi.nlm.nih.gov/ pubmed/20610634. Accessed 15 August 2013.
33. Thurnham DI (2014) Interactions between nutrition and immune function: using inflammation biomarkers to interpret micronutrient status. Proc Nutr Soc 73: 1–8. Available:http://www.ncbi.nlm.nih. gov/pubmed/24169363. Accessed 25 March 2014.
34. Erhardt JG, Estes JE, Pfeiffer CM, Biesalski HK, Craft NE(2004) Combined measurement of ferritin, soluble transferrin receptor, retinol binding protein, and C-reactive protein by an inexpensive, sensitive, and simple sandwich enzyme-linked immunosorbent assay technique. J Nutr 134: 3127–3132. Available:http://www.ncbi.nlm.nih.gov/pubmed/15514286. Accessed 15 August 2013.
35. Baingana RK, Matovu DK, Garrett DA (2008) Application of retinol-binding protein enzyme immunoassay to dried blood spots to assess vitamin A deficiency in a population-based survey: the Uganda Demographic and Health Survey 2006. Food Nutr Bull 29: 297–305. Available:http://www.ncbi. nlm.nih.gov/pubmed/19227054.
36. Ellington A a, Kullo IJ, Bailey KR, Klee GG (2010) Antibody-based protein multiplex platforms: technical and operational challenges. Clin Chem 56: 186–193. Available:http://www.pubmedcentral.nih. gov/articlerender.fcgi?artid52901849&tool5pmcentrez&rendertype5abstract. Accessed 11 July 2011.
37. Chiba A, Mizuno M, Tomi C, Tajima R, Alloza I, et al.(2012) A 4-trifluoromethyl analogue of celecoxib inhibits arthritis by suppressing innate immune cell activation. Arthritis Res Ther 14: R9. Available:http:// www.pubmedcentral.nih.gov/articlerender.fcgi?artid53392797&tool5pmcentrez&rendertype5abstract. Accessed 4 March 2014.
38. Lattie EG, Antoni MH, Fletcher MA, Penedo F, Czaja S, et al. (2012) Stress management skills, neuroimmune processes and fatigue levels in persons with chronic fatigue syndrome. Brain Behav Immun 26: 849–858. Available:http://www.pubmedcentral.nih.gov/articlerender.fcgi?artid53572196& tool5pmcentrez&rendertype5abstract. Accessed 4 March 2014.
39. Davies C (2005) Introduction to Immunoassay Principles. In: Wild D, editor. The Immunoassay Handbook. Oxford, UK: Elsevier. pp. 3–40.
40. Garrett DA, Sangha JK, Kothari MT, Boyle D (2011) Field-friendly techniques for assessment of biomarkers of nutrition for development. Am J Clin Nutr 94: 685S–90S. Available:http://www. pubmedcentral.nih.gov/articlerender.fcgi?artid53142738&tool5pmcentrez&rendertype5abstract. Accessed 7 March 2014.
41. Hix J, Martinez C, Buchanan I, Morgan J, Tam M, et al.(2004) Development of a rapid enzyme immunoassay for the detection of retinol-binding protein. Am J Clin Nutr 79: 93–98.
43. Bland JM, Altman DG(1986) Statistical methods for assessing agreement between two methods of clinical measurement. Lancet 1: 307–310. Available:http://www.ncbi.nlm.nih.gov/pubmed/2868172. Accessed 31 January 2013.
44. Bland JM, Altman DG(1999) Measuring agreement in method comparison studies. Stat Methods Med Res 8: 135–160. Available:http://www.ncbi.nlm.nih.gov/pubmed/10501650. Accessed 14 July 2011.
45. Baingana RK, Matovu-Kasozi D, Garrett DA(2012) The importance of controlling for the acute-phase response in the population-based assessment of vitamin A status: a study in children of pre-school age in Uganda. Public Health Nutr: 1–8. Available:http://www.ncbi.nlm.nih.gov/pubmed/23021569. Accessed 2 January 2013.
46. Cook JD, Flowers CH, Skikne BS(1998) An assessment of dried blood-spot technology for identifying iron deficiency. Blood 92: 1807–1813. Available:http://www.ncbi.nlm.nih.gov/pubmed/9716612.
47. Prentice AM, Doherty CP, Abrams SA, Cox SE, Atkinson SH, et al. (2012) Hepcidin is the major predictor of erythrocyte iron incorporation in anemic African children. Blood 119: 1922–1928. Available: