Glioblastoma Patients as Revealed by iTRAQ-Based
Quantitative Proteomic Analysis
Poonam Gautam1., Sudha C. Nair1., Manoj Kumar Gupta1
, Rakesh Sharma2, Ravindra Varma Polisetty1, Megha S. Uppin3, Challa Sundaram3, Aneel K. Puligopu3, Praveen Ankathi3, Aniruddh K. Purohit3, Giriraj R. Chandak1, H. C. Harsha2, Ravi Sirdeshmukh1,2*¤
1Centre for Cellular and Molecular Biology (CSIR), Hyderabad, India,2Institute of Bioinformatics, Bangalore, India,3Nizam’s Institute of Medical Sciences, Hyderabad, India
Abstract
Glioblastomas (GBMs) are the most common and lethal primary tumors of the central nervous system with high level of recurrence despite aggressive therapy. Tumor-associated proteins/peptides may appear in the plasma of these patients as a result of disruption of the blood-brain barrier in them, raising the scope for development of plasma-based tests for diagnosis and monitoring the disease. With this objective, we analyzed the levels of proteins present in the plasma from GBM patients using an iTRAQ based LC-MS/MS approach. Analysis with pooled plasma specimens from the patient and healthy control samples revealed high confidence identification of 296 proteins, of which 61 exhibited a fold-change$1.5 in the patient group. Forty-eight of them contained signal sequence. A majority have been reported in the differentially expressed transcript or protein profile of GBM tissues; 6 have been previously studied as plasma biomarkers for GBM and 16 for other types of cancers. Altered levels of three representative proteins–ferritin light chain (FTL), S100A9, and carnosinase 1 (CNDP1)–were verified by ELISA in a test set of ten individual plasma specimens. FTL is an inflammation marker also implicated in cancer, S100A9 is an important member of the Ca2+signaling cascade reported to be altered in GBM tissue, and CNDP1 has been reported for its role in the regulation of the levels of carnosine, implicated as a potential drug for GBM. These and other proteins in the dataset may form useful starting points for further clinical investigations for the development of plasma-based biomarker panels for GBM.
Citation:Gautam P, Nair SC, Gupta MK, Sharma R, Polisetty RV, et al. (2012) Proteins with Altered Levels in Plasma from Glioblastoma Patients as Revealed by iTRAQ-Based Quantitative Proteomic Analysis. PLoS ONE 7(9): e46153. doi:10.1371/journal.pone.0046153
Editor:Shannon M. Hawkins, Baylor College of Medicine, United States of America
ReceivedJune 30, 2012;AcceptedAugust 22, 2012;PublishedSeptember 28, 2012
Copyright:ß2012 Gautam et al. This is an open-access article distributed under the terms of the Creative Commons Attribution License, which permits
unrestricted use, distribution, and reproduction in any medium, provided the original author and source are credited.
Funding:The work reported here was carried out under the Network Project NWP 0004 and IAP 001 supported by the Council of Scientific and Industrial Research (CSIR), Government of India. The funders had no role in study design, data collection and analysis, decision to publish, or preparation of the manuscript.
Competing Interests:The authors have declared that no competing interests exist.
* E-mail: [email protected]
.These authors contributed equally to this work.
¤ Current address: Institute of Bioinformatics, Bangalore, India
Introduction
Glioblastoma (GBM) is the most common form of primary brain tumor with high mortality. Even with improved treatment modalities, the median survival of these patients is only about 15 months [1,2]. It has been reported that the blood-brain barrier in GBM patients is compromised [3], due to which proteins/peptides from the tumor tissue may appear in the blood. The proteins that are associated with these tumors and detectable in plasma would therefore be useful to develop assays for non-invasive diagnosis or post-treatment monitoring of these patients. Various individual serum biomarkers for GBM have been reported earlier such as chitinase-3-like protein 1 (YKL-40), glial fibrillary acidic protein (GFAP), matrix metalloproteinase-9 (MMP-9), epidermal growth factor receptor (EGFR) and CD14 [4–8]. Reyens et al reported
elevation of several inflammatory proteins, coagulation factors and angiogenesis factors in the plasma of GBM patients [9]. Using a combination of 2-DE/MS approach, Kumar et al observed ten
differentially expressed proteins in the sera of patients with GBM
and validated haptoglobin a2 as serum marker associated with tumor growth and migration in GBM [10]. In another study based on SELDI-TOF mass spectrometry, altered expression of alpha-chain of 2-Heremans-Schmid glycoprotein (AHSG) was shown to be correlated with prediction of survival of GBM patients [11].
Materials and Methods
Plasma Samples
The Human Ethics Committee at Nizam’s Institute of Medical Sciences, Hyderabad, India had approved the study and all the blood samples were collected with written informed consent from the patients and healthy individuals at Nizam’s Institute of Medical Sciences, Hyderabad, India. Histopathological evaluation
of the tumor resections was performed as per WHO guidelines. All tumors showed characteristic morphology of glioblastoma with frequent atypical mitosis, necrosis and microvascular proliferation. Blood samples from these GBM patients were collected before the surgery and administration of any medication. Samples were centrifuged at 15006g for 20 min to obtain clear plasma and stored at -80uC until further use. The whole process was completed within 30 min after collection. Blood samples from
healthy individuals, with no report of any cancer, were used as controls and processed in identical way.
Our experimental approach was to investigate differential levels of proteins in the pooled plasma samples from GBM patients as compared to the healthy controls and then to verify the mass spectrometry results in individual samples by alternative assays. Pooled GBM or control plasma samples (50–60 yr; 2 males, 1 female each) were depleted of the 14 most abundant proteins using Human 14 MARS column (4.66100 mm; Agilent Technologies, Santa Clara, CA, USA) as per manufacturer’s instructions. Flow-through fraction was collected and desalted using mRP column (Agilent Technologies, Santa Clara, CA, USA) as per the manufacturer’s instruction and lyophilized. The samples were reconstituted in 0.1% SDS and the protein amount was estimated using Bradford’s method. The depletion was visualized by running the samples on SDS-PAGE (Figure S1). The pooled plasma samples thus prepared were used for MS analysis as described below.
iTRAQ Labeling and SCX Fractionation
Labeling of samples with iTRAQ reagents was carried out according to the manufacturer’s instructions (iTRAQ Reagents Multiplex kit; Applied Biosystems/MDS Sciex, Foster City, CA). Briefly, 80mg of pooled control or GBM plasma protein sample was reconstituted in dissolution buffer, denatured, reduced, alkylated and then trypsinized (4mg modified sequencing grade trypsin; Promega, Madison, WI, USA) for 16 h at 37uC. Tryptic
digests were labeled with four different iTRAQ reagents. Control samples were labeled with 114 and 115 while GBM samples with 116 and 117 iTRAQ reagents. Reactions were quenched with glycine (10 mM). All the four-labeled samples were pooled, vacuum-dried and subjected to strong cation exchange (SCX) fractionation as described earlier [12]. Eight fractions were collected and subjected to LC-MS/MS analysis.
LC-MS/MS Analysis
Nanoflow electrospray ionization tandem mass spectrometric analysis of peptide samples was carried out using LTQ-Orbitrap Velos (Thermo Scientific, Bremen, Germany) interfaced with Agilent’s 1200 Series nanoflow LC system. The chromatographic capillary columns used were packed with Magic C18AQ (particle size 5mm, pore size 100A˚ ; Michrom Bioresources, Auburn, CA, USA) reversed phase material in 100% ACN at a pressure of 1000 psi. The peptide sample from each SCX fraction was enriched using a trap column (75mm62 cm) at a flow rate of 3ml/min and separated on an analytical column (75mm610 cm) at a flow rate of 350 nl/min. The peptides were eluted using a linear gradient of 7–30% ACN over 65 min. Mass spectrometric analysis was carried out in a data dependent manner with full scans acquired using the Orbitrap mass analyzer at a mass resolution of 60,000 at 400 m/z. For each MS cycle, twenty most intense precursor ions from a survey scan were selected for MS/MS and fragmentation detected at a mass resolution of 15,000 at m/z 400. The fragmentation was carried out using higher-energy collision
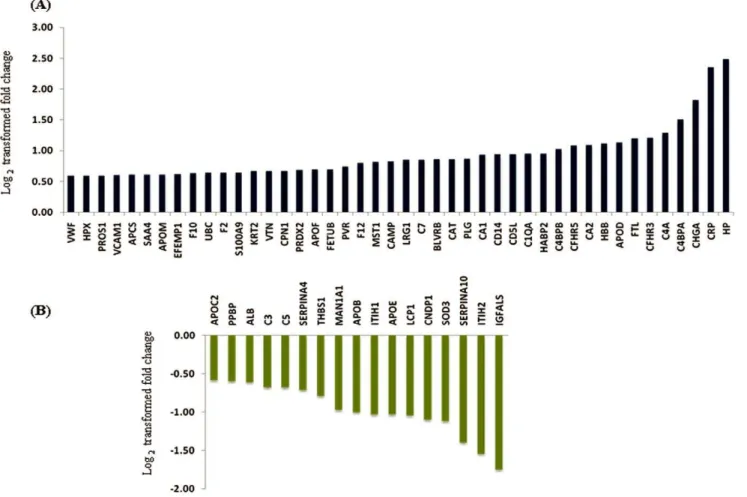
Figure 2. Log2transformed fold changes for the proteins observed with differential levels in the plasma from GBM patients.Panel A represents up regulated proteins and Panel B down regulated proteins.
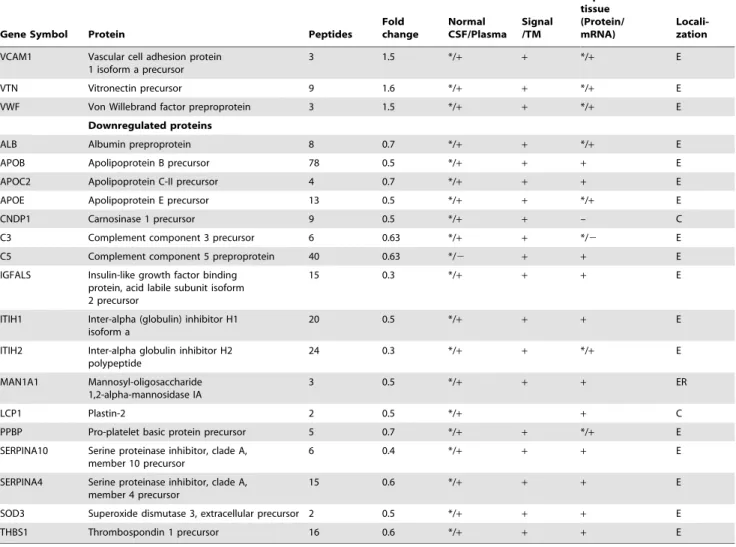
Table 1.Annotations of altered plasma proteins identified in the study [35–52].
Gene Symbol Protein Peptides
Fold change
Normal CSF/Plasma
Signal /TM
Expression in tissue (Protein/ mRNA)
Locali-zation
Upregulated proteins
APOD Apolipoprotein D precursor 3 2.2 */+ + + E
APOF Apolipoprotein F precursor 2 1.6 */+ + + E
APOM Apolipoprotein M 5 1.5 */+ + + E
CRP C-reactive protein, pentraxin-related precursor
3 5.1 */+ + + E
CA1 Carbonic anhydrase 1 5 1.9 */+ – + C
CA2 Carbonic anhydrase 2 4 2.1 */+ – */+ E
CPN1 Carboxypeptidase N, polypeptide 1 precursor
7 1.6 */+ + + E
CAT Catalase 4 1.8 */+ – + C
CAMP Cathelicidin antimicrobial peptide 3 1.8 2/+ + */+ E
CD14 CD14 antigen precursor 10 1.9 */+ + */+ E
CD5L CD5 antigen-like precursor 3 1.9 */+ + + E
CHGA Chromogranin A precursor 2 3.5 */+ + + E
F10 Coagulation factor X preproprotein 9 1.6 */+ + + E
F12 Coagulation factor XII precursor 13 1.7 */+ + + E
C1QA Complement component 1, q subcomponent, A chain precursor
3 1.9 */+ + + E
C4BPA Complement component 4 binding protein, alpha chain precursor
15 2.8 */+ + + E
C4BPB Complement component 4 binding protein, beta chain isoform 2 precursor
7 2.0 2/+ + + E
C4A Complement component 4A preproprotein 12 2.5 */+ + */2 E
C7 Complement component 7 precursor 23 1.8 */+ + + E
CFHR3 Complement factor H-related 3 isoform 1 precursor
2 2.3 */+ + – E
CFHR5 Complement factor H-related 5 precursor 6 2.1 2/+ + */+ E
EFEMP1 EGF-containing fibulin-like extracellular matrix protein 1 precursor
5 1.5 */+ + */+ E
FTL Ferritin, light polypeptide 4 2.3 */+ – */+ C
FETUB Fetuin-B precursor 7 1.6 */+ + + E
BLVRB Flavin reductase 5 1.8 2/+ – + C
HP Haptoglobin isoform 2 preproprotein 2 5.6 */+ + */+ E
HBB Hemoglobin subunit beta 6 2.2 */+ – */+ E
HPX Hemopexin precursor 28 1.5 */+ + */+ E
HABP2 Hyaluronan binding protein 2 preproprotein
7 1.9 */+ + + E
KRT2 Keratin 2 5 1.6 */+ – */+ C
LRG1 Leucine-rich alpha-2-glycoprotein 1 precursor
12 1.8 */+ + + E
MST1 Macrophage stimulating 1 precursor 11 1.8 */+ + */+ E
PRDX2 Peroxiredoxin-2 isoform a 5 1.6 */+ – */+ C
PLG Plasminogen isoform 1 precursor 43 1.8 */+ + + E
PVR Poliovirus receptor isoform gamma 2 1.7 */+ + */+ E
PROS1 Protein S, alpha preproprotein 10 1.5 */+ + + E
S100A9 Protein S100-A9 4 1.6 */+ */+ E
F2 Prothrombin preproprotein 35 1.6 */+ + */+ E
SAA4 Serum amyloid A-4 protein precursor 2 1.5 */+ + + E
APCS Serum amyloid P component precursor 6 1.5 */+ + + E
dissociation (HCD) as the activation method with 40% normalized collision energy. The ions selected for fragmentation were excluded for 30 sec. The automatic gain control for full FT MS was set to 1 million ions and for FT MS/MS was set to 0.1 million ions with a maximum time of accumulation of 500 ms, respectively. For accurate mass measurements, the lock mass option was enabled.
Protein Identification and Quantitation
The MS and MS/MS data was searched on Proteome Discoverer (Thermo Fisher Scientific, Beta Version 1.2.0.208) based on the workflow with spectrum selector and reporter ion quantifier. MS/MS search was carried out using Sequest search algorithm, against the NCBI human RefSeq database (release 40) containing 31,811 proteins. Search parameters included trypsin as the enzyme with 1 missed cleavage allowed; oxidation of methionine was set as a dynamic modification while alkylation at cysteine and iTRAQ modification at N-terminus of the peptide
and lysine were set as static modifications. Precursor and fragment mass tolerance were set to 20 ppm and 0.1 Da, respectively. The peptide and protein data were extracted using high peptide confidence and top one peptide rank filters. The false discovery rate (FDR) was calculated by enabling the peptide sequence analysis using a decoy database. High confidence peptide identifications were obtained by setting a target FDR threshold of 1% at the peptide level. Relative quantitation of proteins was carried out based on the relative intensities of reporter ions released during MS/MS fragmentation of peptides. Relative intensities of the two reporter ions for each of the peptide identifiers for a protein were used for averaging and assessing percentage variability to determine relative quantity of a protein in GBM plasma sample. Only unique peptides for each protein identified were used to determine relative protein content in the two samples.
Table 1.Cont.
Gene Symbol Protein Peptides
Fold change
Normal CSF/Plasma
Signal /TM
Expression in tissue (Protein/ mRNA)
Locali-zation
VCAM1 Vascular cell adhesion protein 1 isoform a precursor
3 1.5 */+ + */+ E
VTN Vitronectin precursor 9 1.6 */+ + */+ E
VWF Von Willebrand factor preproprotein 3 1.5 */+ + */+ E
Downregulated proteins
ALB Albumin preproprotein 8 0.7 */+ + */+ E
APOB Apolipoprotein B precursor 78 0.5 */+ + + E
APOC2 Apolipoprotein C-II precursor 4 0.7 */+ + + E
APOE Apolipoprotein E precursor 13 0.5 */+ + */+ E
CNDP1 Carnosinase 1 precursor 9 0.5 */+ + – C
C3 Complement component 3 precursor 6 0.63 */+ + */2 E
C5 Complement component 5 preproprotein 40 0.63 */2 + + E
IGFALS Insulin-like growth factor binding protein, acid labile subunit isoform 2 precursor
15 0.3 */+ + + E
ITIH1 Inter-alpha (globulin) inhibitor H1 isoform a
20 0.5 */+ + + E
ITIH2 Inter-alpha globulin inhibitor H2 polypeptide
24 0.3 */+ + */+ E
MAN1A1 Mannosyl-oligosaccharide 1,2-alpha-mannosidase IA
3 0.5 */+ + + ER
LCP1 Plastin-2 2 0.5 */+ + C
PPBP Pro-platelet basic protein precursor 5 0.7 */+ + */+ E
SERPINA10 Serine proteinase inhibitor, clade A, member 10 precursor
6 0.4 */+ + + E
SERPINA4 Serine proteinase inhibitor, clade A, member 4 precursor
15 0.6 */+ + + E
SOD3 Superoxide dismutase 3, extracellular precursor 2 0.5 */+ + + E
THBS1 Thrombospondin 1 precursor 16 0.6 */+ + + E
Footnote:
E- Extracellular; C- Cytoplasm; ER- Endoplasmic reticulum.
In column 5 (*) indicates the earlier report of a protein identified in normal CSF and (+) in normal Plasma. In column 7 (*) indicates expression of a protein in tissue at protein level (+) at mRNA level.
Protein localization, Signal/TM domain containing information was derived from HPRD [35] and information about presence in normal CSF or plasma was extracted from [36,37] respectively. Expression of the genes/proteins at tissue level was inferred from published transcriptome dataset (master list; [38]) or protein datasets [39– 52].
Bioinformatic analysis and annotations of the proteins identified were carried out based on their biological functions and cellular localization as per Human Protein Reference Database (HPRD, http://www.hprd.org), which is in compliance with gene ontology (GO) standards. Pathway grouping was done using the Ingenuity Pathway Knowledge Base (Ingenuity Systems, Redwood City, CA).
Verification Assays by ELISA
Plasma levels of human ferritin light chain (FTL), S100A9 and carnosinase 1 (CNDP1) were measured in individual GBM or control plasma samples (10 subjects from each group; age range 30–60 yr; 7 males, 3 females) using ELISA quantitation kit (USCN life sciences, Wuhan, China). Fold changes in log2 transformed ratio for FTL, S100A9 and CNDP1 were represented using scatter plot.
Results and Discussion
Glioblastomas are generally diagnosed on the basis of clinical evaluation, imaging and histopathological assessment of surgical biopsies. Identification of differentially expressed proteins in the plasma of GBM patients would be important to develop assays as diagnostic methods and for post treatment surveillance as viable alternatives to imaging. A number of reports are available which discuss molecules having strong potential as plasma biomarkers for GBM. YKL-40, also known as chitinase-3-like protein 1, is an extracellular matrix glycoprotein and has been reported as
prognostic marker for high-grade gliomas including GBM [4]. GFAP, a major intermediate filament protein and a known astrocyte marker, has been detected to be significantly elevated in the plasma of GBM patients [5]. We have been studying GBM to understand differentially expressed proteins that are biologically relevant to the tumor state. During this effort, we identified a number of membrane-associated proteins belonging to important regulatory pathways including proteins that have secretory potential. Our independent study of the plasma from GBM patients also revealed many important proteins with altered levels. All these proteins observed provide important leads for develop-ment of clinical applications.
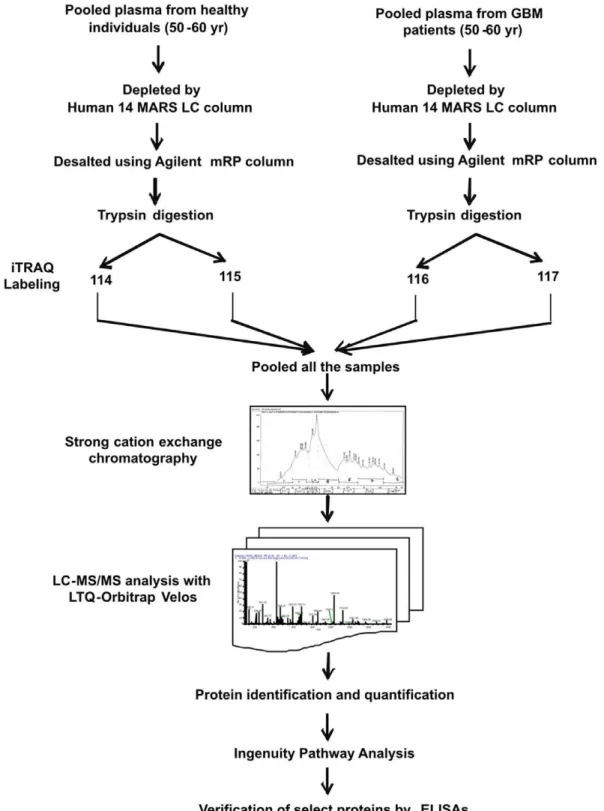
In our experimental approach, we compared the plasma specimens pooled from patients diagnosed with GBM samples derived from matched healthy individuals. Representative altered and functionally significant proteins were then tested in individual plasma specimens by ELISA. The pooled plasma specimens were processed for quantitative LC-MS/MS analysis using iTRAQ as summarized in Figure 1. A total of 12,976 peptides were identified which mapped to 296 proteins. These protein identifications along with their peptide information, molecular functions, biological processes and subcellular localization are provided in Table S1. A total of 61 proteins were noted with a fold change $1.5 and identified with at least two peptides each. The peptide represen-tation for these differential proteins is shown in Figure S2. More than 50% of the proteins are represented by.5 peptides each. Forty-four proteins were up regulated while seventeen proteins were down regulated and the differential levels of each of them are
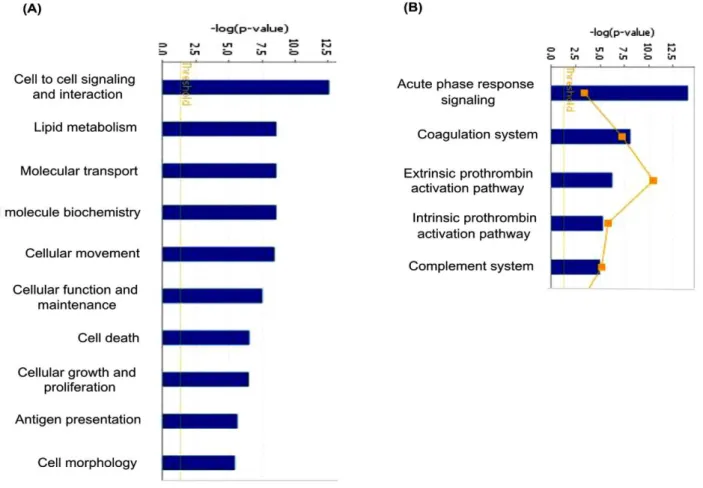
Figure 3. Mapping of 61 differentially regulated proteins to molecular and cellular processes and canonical pathways using Ingenuity Pathway Analysis.Top 10 cellular processes (A) and top 5 canonical pathways (B) are shown in the figure.
shown in Figure 2. The altered levels of virtually all of these proteins (n = 57) correlated with the differentially expressed transcriptome data from GBM tissues [13], supporting their validity, 24 of them are reported to be altered even at the protein level in GBM tissues (Table 1). Of the 61 proteins, 51 proteins are extracellular proteins, 48 contained signal sequence indicating their membrane association and potential for secretion. Fourty-six (n = 46) proteins have been already detected in (normal) cerebro-spinal fluid or plasma (Table 1). These 61 proteins could be mapped to major cellular processes such as cell-to-cell signaling and interaction, lipid metabolism, molecular transport, cellular movement, cell death and cellular growth and proliferation, on Ingenuity Pathway Analysis (IPA) analysis (Figure 3, Table S2). Top network include molecules associated with cancer, cell-to-cell signaling and interaction (Table S3A). Canonical pathways enriched were acute phase response, blood coagulation system and extrinsic prothrombin activation pathway (Table S3B).
Acute phase reactant proteins (APRPs) are associated in various types of cancers as well as other clinical conditions. These may be a result of inflammatory responses. Major APRPs observed are C-reactive protein (CRP) and haptoglobina2, which were previously reported to be elevated in the plasma of patients with GBM [9,10]. The present study reports increased levels of additional APRPs such as plasminogen and coagulation factor XII which suggest the release of active plasmin acting as a proteolytic factor in inflammatory reactions and tumor invasion [14]. Other APRPs such as ferritin light chain, hemopexin and serum amyloid A-4,observed by us, are implicated in other cancers as well [15–18]. Along with these APRPs, another striking protein observed to be altered was S100A9, a member of calcium signaling pathway. Both these groups, including FTL and S100A9 were also revealed in the analysis with GBM tissues. The signal sequence containing proteins, C-reactive protein, CD14 antigen precursor, haptoglobin a2, vascular cell adhesion protein 1, serum albumin and thrombospondin-1 identified in our analysis, have also been reported earlier in the plasma of GBM patients [8,10,19], while others (n = 42), observed here are being reported for the first time. Chromogranin (CgA) is an acidic glycoprotein commonly overexpressed in neuroendocrine tumors [20] and viewed as a biomarker for the diagnosis of neuroendocrine tumors [21,22]. Endothelial carbonic anhydrase, CA II, was earlier shown to be associated with a poor prognosis in astrocytoma patients [23]. Fibulin 3 (EFEMP1) promotes tumor cell invasion and mobility [24]. Another protein Carnosinase 1 (CNDP1) is a brain-associated protein. Serum carnosinase (CNDP1) is synthesized in the brain and secreted into the cerebrospinal fluid and then into the blood. Its deficiency has been associated with various neurologic deficits [25]. The protein may have therapeutic role (see discussion below).
We selected and further examined the level of three proteins FTL, S100A9 and CNDP1. The MS/MS spectra of the representative peptides of these three proteins along with their reporter ions, obtained for the plasma samples are shown in Figure 4. Consistent to the results of iTRAQ analysis, we observed significantly elevated levels of FTL and S100A9 and reduced levels of CNDP1 in individual plasma specimens from GBM patients. The fold changes of these proteins, as log2 transformed ratio, are shown in the scatter plot (Figure 5).
Elevated levels of FTL were observed in 7 out of 10 GBM cases whereas for S100A9 in 8 out of 10 patients. Reduced levels of CNDP1 were observed in 8 out of 10 plasma specimens. Ferritin is an acute phase protein and involved in iron storage. Almost all cells possess the ability to synthesize ferritin, including glial cells, in the central nervous system [26]. Serum ferritin, a glycosylated protein composed primarily of L-subunit type, has been reported to be elevated in various cancers including stomach and head and neck cancers [15,27]. It is also shown to be elevated in cerebrospinal fluid of GBM patients [28] suggesting its secretion by glial cells. Since, serum ferritin is also reported in other inflammatory conditions and it may simply represent tumor related inflammatory environment. S100A9 is a calcium-binding protein also likely to be contrib-uted by the inflammatory cells in the tumor microenvironment and is observed to be elevated in the tumors. S100A9 is co-expressed with S100A8 to form a functional complex and is critically involved in tumor- stroma interactions. It is mainly localized in the cytosol but translocates to membrane upon elevated intracellular calcium levels [29]. As secreted factors, they are involved in the recruitment of tumor cells into ‘pre-metastatic niches’ [30]. We did detect altered levels of S100A8 in the tumor tissue [12], although not in the plasma. Consistently observed altered levels of FTL and S100 A9 in the plasma from GBM patients qualifies them for further investigation for their clinical applications. CNDP1 is involved in the metabolism of carnosine and carnosine homeostasis is implicated in multiple functions and any disturbance in it may have crucial metabolic consequences [31]. Carnosine is also reported to have anti-growth property and has been discussed for its therapeutic potential against tumors including GBM [32]. Carnosinase, which hydrolyzes carnosine, exists in two distinct isoforms and has been discussed in the context of major neurodegenerative condition [33]. The serum isoform, CNDP1, is distinct and our identification is supported by the unique peptides for this form. Reduced levels of CNDP1 have been observed in patients with Parkinson disease or multiple sclerosis and in patients after a cerebrovascular accident [34]. Our analysis, for the first time, shows that serum CNDP1 is present at reduced levels in the plasma of GBM patients, which may be important in the maintenance of carnosine levels and bioavail-ability of carnosine as a drug for GBM [33].
In summary, plasma-based tests for diagnosing GBM or for its recurrence would be highly useful. Our initial, unbiased proteomics analysis of the plasma from GBM patients reveals altered proteins that are biologically important and implicated in the context of inflammatory reactions or cancer in general as well as glioblastoma in particular. FTL, S100A9 and CNDP1, have already shown encouraging reproducibility in a set of 10 individual specimens. These and others which would pass the reproducibility test will form useful panels for investigation for their diagnostic potential. Reduced levels of CNDP1 may have important therapeutic implications in the application of carnosine as a drug for GBM. Our results thus provide a valuable resource of proteins and permit further investigation on the plasma from GBM patients for extension to clinical applications.
Figure 5. Scatter plot representing altered levels of ferritin light chain, S100A9 and carnosinase 1, in individual specimens from control subjects and GBM patients as determined by ELISA.Elevated levels of Ferritin light chain were observed in 7 out of 10 GBM cases and in 8 out of 10 patients for S100A9. Lower levels of Carnosinase 1were observed in 8 out of 10 GBM patients. The fold changes are shown in log2
Supporting Information
Figure S1 SDS-PAGE analysis of Ag14 depleted and desalted pooled plasma proteins from control and GBM subjects.25mg of protein was loaded on 4–20% gradient gel and stained with Coomassie brilliant blue to visualize the proteins. (TIF)
Figure S2 Peptide coverage for the differential proteins observed.
(TIF)
Table S1 List of all plasma proteins (n = 296) identified in the study along with peptides, molecular function, biological process and localizations.
(XLS)
Table S2 Differentially expressed proteins associated with major molecular and cellular functions as assessed with Ingenuity Pathway Analysis (IPA). Differentially expressed proteins from Table 1 with 1.5 fold change were used for the analysis. (DOC)
Table S3 Ingenuity Pathway Analysis of the differentially expressed plasma proteins associated with major networks and processes (A) and those associated canonical pathways (B).
Differentially expressed proteins from Table 1 were used for the analysis and are shown in bold. Only top three networks or pathways are shown.
(DOC)
Acknowledgments
The mass spectrometry facility at the Institute of Bioinformatics, Bangalore used for the analysis was established under support from the Department of Biotechnology (DBT), Government of India in a collaborative project with National Institute of Mental Health and Neurosciences (NIMHANS), Bangalore, India. We thank Dr. Akhilesh Pandey, Professor at Johns Hopkins University School of Medicine, Baltimore, MD, USA, for critical reading of the manuscript. SRISTEK Hyderabad was involved in specimen collections, coordination and clinical documentation. This work is dedicated to the memory of Sudha C. Nair, who passed away while the manuscript was being written.
Author Contributions
Conceived and designed the experiments: R. Sirdeshmukh PG. Performed the experiments: PG SCN MKG RVP HCH R. Sharma. Analyzed the data: R. Sirdeshmukh PG SCN MKG RVP R. Sharma HCH. Contributed reagents/materials/analysis tools: GRC. Wrote the paper: R. Sirdeshmukh PG RVP. Clinical Samples and analysis: A. Purohit A. Puligopu PA CS MSU.
References
1. Stark AM, Nabavi A, Mehdorn HM, Blomer U (2005) Glioblastoma multiforme-report of 267 cases treated at a single institution. Surg Neurol 63: 162–169.
2. Schwartzbaum JA, Fisher JL, Aldape KD, Wrensch M (2006) Epidemiology and molecular pathology of glioma. Nat Clin Pract Neurol 2: 494–503. 3. Schneider SW, Ludwig T, Tatenhorst L, Braune S, Oberleithner H, et al. (2004)
Glioblastoma cells release factors that disrupt blood-brain barrier features. Acta Neuropathol 107: 272–76.
4. Iwamoto FM, Hottinger AF, Karimi S, Riedel E, Dantis J, et al. (2011) Serum YKL-40 is a marker of prognosis and disease status in high-grade gliomas. Neuro Oncol 13: 1244–51.
5. Jung CS, Foerch C, Scha¨nzer A, Heck A, Plate KH, et al. (2007) Serum GFAP is a diagnostic marker for glioblastoma multiforme. Brain 130: 3336–41. 6. Hormigo A, Gu B, Karimi S, Riedel E, Panageas KS, et al. (2006) YKL-40 and
matrix metalloproteinase-9 as potential serum biomarkers for patients with high-grade gliomas. Clin Cancer Res 12: 5698–704.
7. Quaranta M, Divella R, Daniele A, Tardo SD, Venneri MT, et al. (2007) Epidermal growth factor receptor serum levels and prognostic value in malignant gliomas. Tumori 93: 275–80.
8. Zhou M, Wiemels JL, Bracci PM, Wrensch MR, McCoy LS, et al. (2010) Circulating levels of the innate and humoral immune regulators CD14 and CD23 are associated with adult glioma. Cancer Res 70: 7534–42.
9. Reyne´s G, Vila V, Martı´n M, Parada A, Fleitas T, et al. (2011) Circulating markers of angiogenesis, inflammation, and coagulation in patients with glioblastoma. J Neurooncol 102: 35–41.
10. Kumar DM, Thota B, Shinde SV, Prasanna KV, Hegde AS, et al. (2010) Proteomic identification of haptoglobina2 as a glioblastoma serum biomarker: implications in cancer cell migration and tumor growth. J Proteome Res 9: 5557–67.
11. Petrik V, Saadoun S, Loosemore A, Hobbs J, Opstad KS, et al. (2008) Serum alpha 2-HS glycoprotein predicts survival in patients with glioblastoma. Clin Chem 54: 713–22.
12. Polisetty RV, Gautam P, Sharma R, Harsha HC, Nair SC, et al. (2012) LC-MS/ MS analysis of differentially expressed glioblastoma membrane proteome reveals altered calcium signalling and other protein groups of regulatory functions. Mol Cell Proteomics 11(6): M111.013565.
13. Verhaak RG, Hoadley KA, Purdom E, Wang V, Qi Y, et al. (2010) Integrated genomic analysis identifies clinically relevant subtypes of glioblastoma charac-terized by abnormalities in PDGFRA, IDH1, EGFR, and NF1. Cancer Cell 17: 98–110.
14. Kwaan HC, McMahon B (2009) The role of plasminogen-plasmin system in cancer. Cancer Treat Res 148: 43–66.
15. Nomura A, Chyou PH, Stemmermann GN (1992) Association of serum ferritin levels with the risk of stomach cancer. Cancer Epidemiol Biomarkers Prev 1: 547–50.
16. Tolosano E, Altruda F (2002) Hemopexin: structure, function, and regulation. DNA Cell Biol 21: 297–306.
17. Xu G, Hou CR, Jiang HW, Xiang CQ, Shi N, et al. (2010) Serum protein profiling to identify biomarkers for small renal cell carcinoma. Indian J Biochem Biophys 47: 211–18.
18. Weinstein PS, Skinner M, Sipe JD, Lokich JJ, Zamcheck N, et al. (1984) Acute-phase proteins or tumour markers: the role of SAA, SAP, CRP and CEA as indicators of metastasis in a broad spectrum of neoplastic diseases. Scand J Immunol 19: 193–98.
19. Salmaggi A, Eoli M, Frigerio S, Ciusani E, Silvani A, et al. (1999) Circulating intercellular adhesion molecule-1 (ICAM-1), vascular cell adhesion molecule-1 (VCAM-1) and plasma thrombomodulin levels in glioblastoma patients. Cancer Lett 146: 169–72.
20. Modlin IM, Gustafson BI, Moss SF, Pavel M, Tsolakis AV, et al. (2010) Chromogranin A-biological function and clinical utility in neuro endocrine tumor disease. Ann Surg Oncol 17: 2427–43.
21. Belli SH, Oneto A, Aranda C, O’Connor JM, Domenichini E, et al. (2009) Chromogranin A as a biochemical marker for the management of neuroendo-crine tumors: a multicenter study developed in Argentina. Acta Gastroenterol Latinoam. 39: 184–9.
22. Lawrence B, Gustafsson BI, Kidd M, Pavel M, Svejda B, et al. (2011) The clinical relevance of chromogranin A as a biomarker for gastroenteropancreatic neuroendocrine tumors. Endocrinol Metab Clin North Am. 40: 111–34. 23. Haapasalo J, Nordfors K, Ja¨rvela¨ S, Bragge H, Rantala I, et al. (2007) Carbonic
anhydrase II in the endothelium of glial tumors: a potential target for therapy. Neuro Oncol 9: 308–13.
24. Hu B, Thirtamara-Rajamani KK, Sim H, Viapiano MS (2009) Fibulin-3 is uniquely upregulated in malignant gliomas and promotes tumor cell motility and invasion. Mol Cancer Res 7: 1756–70.
25. Lenney JF, Peppers SC, Kucera CM, Sjaastad O (1983) Homocarnosinosis: lack of serum carnosinase is the defect probably responsible for elevated brain and CSF homocarnosine. Clin Chim Acta 132: 157–165.
26. Ozawa H, Nishida A, Mito T, Takashima S (1994) Development of ferritin-positive cells in cerebrum of human brain. Pediatr Neurol 10: 44–8. 27. Maxim PE, Veltri RW (1986) Serum ferritin as a tumor marker in patients with
squamous cell carcinoma of the head and neck. Cancer 57: 305–11. 28. Sato Y, Honda Y, Asoh T, Oizumi K, Ohshima Y, et al. (1998) Cerebrospinal
fluid ferritin in glioblastoma: evidence for tumor synthesis. J Neurooncol 40: 47– 50.
29. Roth J, Burwinkel F, Vanden Bos C, Goebeler M, Vollmer E, et al. (1993) MRP8 and MRP14, S-100-like proteins associated with myeloid differentiation, are translocated to plasma membrane and intermediate filaments in a calcium-dependent manner. Blood 82: 1875–83.
30. Ne´meth J, Angel P, Hess J (2009) Dual Role of S100A8 and S100A9 in Inflammation-Associated Cancer. Anti-Inflammatory & Anti-Allergy Agents in Medicinal Chemistry 8: 329–36.
31. Gaunitz F, Hipkiss AR (2012) Carnosine and cancer: a perspective. Amino Acids 43: 135–42.
32. Renner C, Zemitzsch N, Fuchs B, Geiger KD, Hermes M, et al. (2010) Carnosine retards tumor growth in vivo in an NIH3T3-HER2/neu mouse model. Mol Cancer 9: 2.
34. Wassif WS, Sherwood RA, Amir A, Idowu B, Summers B, et al. (1994) Serum carnosinase activities in central nervous system disorders. Clin Chim Acta 225: 57–64.
35. Keshava Prasad TS, Goel R, Kandasamy K, Keerthikumar S, Kumar S, et al. (2009) Human Protein Reference Database-2009 update. Nucleic Acids Res 37: D767–72.
36. Schutzer SE, Liu T, Natelson BH, Angel TE, Schepmoes AA, et al. (2010) Establishing the proteome of normal human cerebrospinal fluid. PLoS One 5: e10980.
37. Farrah T, Deutsch EW, Omenn GS, Campbell DS, Sun Z, et al. (2011) A high-confidence human plasma proteome reference set with estimated concentrations in PeptideAtlas. Mol Cell Proteomics 10(9): M110.006353.
38. Verhaak RG, Hoadley KA, Purdom E, Wang V, Qi Y, et al. (2010) Integrated genomic analysis identifies clinically relevant subtypes of glioblastoma charac-terized by abnormalities in PDGFRA, IDH1, EGFR, and NF1. Cancer Cell 17: 98–110.
39. Polisetty RV, Gautam P, Sharma R, Harsha HC, Nair SC, et al. (2012) LC-MS/ MS analysis of differentially expressed glioblastoma membrane proteome reveals altered calcium signalling and other protein groups of regulatory functions. Mol Cell Proteomics 11(6): M111.013565.
40. Haapasalo J, Nordfors K, Ja¨rvela¨ S, Bragge H, Rantala I, et al. (2007) Carbonic anhydrase II in the endothelium of glial tumors: a potential target for therapy. Neuro Oncol 9: 308–13.
41. Deininger MH, Meyermann R, Schluesener HJ (2003) Expression and release of CD14 in astrocytic brain tumors. Acta Neuropathol 106: 271–7.
42. Donev K, Scheithauer BW, Rodriguez FJ, Jenkins S (2010) Expression of diagnostic neuronal markers and outcome in glioblastoma. Neuropathol Appl Neurobiol 36: 411–21.
43. Khwaja FW, Nolen JD, Mendrinos SE, Lewis MM, Olson JJ, et al. (2006) Proteomic analysis of cerebrospinal fluid discriminates malignant and nonma-lignant disease of the central nervous system and identifies specific protein markers. Proteomics 6: 6277–87.
44. Gasque P, Julen N, Ischenko AM, Picot C, Mauger C, et al. (1992) Expression of complement components of the alternative pathway by glioma cell lines. J Immunol 149: 1381–7.
45. Rajcevic U, Petersen K, Knol JC, Loos M, Bougnaud S, et al. (2009) iTRAQ-based proteomics profiling reveals increased metabolic activity and cellular cross-talk in angiogenic compared with invasive glioblastoma phenotype. Mol Cell Proteomics 8: 2595–612.
46. Bhat KP, Salazar KL, Balasubramaniyan V, Wani K, Heathcock L, et al. (2011) The transcriptional coactivator TAZ regulates mesenchymal differentiation in malignant glioma. Genes Dev 25: 2594–609.
47. Ja¨rvela¨ S, Rantala I, Rodriguez A, Kallio H, Parkkila S, et al. (2010) Specific expression profile and prognostic significance of peroxiredoxins in grade II-IV astrocytic brain tumors. BMC Cancer 10: 104.
48. Sloan KE, Stewart JK, Treloar AF, Matthews RT, Jay DG (2005) CD155/PVR enhances glioma cell dispersal by regulating adhesion signaling and focal adhesion dynamics. Cancer Res 65: 10930–7.
49. Ma¨enpa¨a¨ A, Kovanen PE, Paetau A, Ja¨a´skela¨inen J, Timonen T (1997) Lymphocyte adhesion molecule ligands and extracellular matrix proteins in gliomas and normal brain: expression of VCAM-1 in gliomas. Acta Neuropathol 94: 216–25.
50. Gladson CL, Cheresh DA (1991) Glioblastoma expression of vitronectin and the alpha v beta 3 integrin. Adhesion mechanism for transformed glial cells. J Clin Invest 88: 1924–32.
51. McComb RD, Jones TR, Pizzo SV, Bigner DD (1982) Immunohistochemical detection of factor VIII/von Willebrand factor in hyperplastic endothelial cells in glioblastoma multiforme and mixed glioma-sarcoma. J Neuropathol Exp Neurol 41: 479–89.
![Table 1. Annotations of altered plasma proteins identified in the study [35–52].](https://thumb-eu.123doks.com/thumbv2/123dok_br/18442995.363400/4.918.97.837.126.1107/table-annotations-altered-plasma-proteins-identified-study.webp)