STRATO SPHERIC OZONE FLUC TU A TION AND
UL TRA VI O LET RA DI A TION OVER SER BIA
by
Jugoslav L. NIKOLI] 1*, Vladan D. DUCI] 2, and Nataša M. MARTI]-BURSA] 3
1
Re pub lic Hy dro-Me te o ro log i cal In sti tute of Ser bia, Bel grade, Ser bia 2
Fac ulty of Ge og ra phy, Uni ver sity of Bel grade, Bel grade, Ser bia 3
Fac ulty of Sci ence and Math e mat ics, Uni ver sity of Ni{, Ni{, Ser bia
Sci en tific pa per UDC: 54-76:546.214:504.7 DOI: 10.2298/NTRP1102119N
In creased ul tra vi o let ra di a tion po ten tially det ri men tal to health is a di rect ef fect of the re -duced ozone layer of the Earth’s at mo sphere. Strato spheric ozone over the ter ri tory of Ser bia and im me di ate sur round ing de pleted in the con sid ered pe riod of 19792008; its amount re duced by 7.6%. So lar and vol ca nic ac tiv i ties have sig nif i cant ef fect on the interannual vari abil -ity of the strato spheric ozone. Ozone layer over Ser bia is 13.8% thicker than the plan e tary layer, with the ozone hole form ing once in five years on av er age with out se ri ous health im pli -ca tions.
Key words: strato spheric ozone, ultraviolet ra di a tion, health, ozone hole, so lar ac tiv ity, vol ca nic ac tiv ity
IN TRO DUC TION
About 90% of the Earth’s at mo spheric ozone is in the strato sphere, with the great est con cen tra tion at al ti tudes be tween 22 and 25 km. De creases of ozone con cen tra tion in the strato sphere, oc cur rence of ozone holes and in creased ul tra vi o let ra di a tion (UVR), on the Earth’s sur face have be come fo cal prob lems of pub lic in ter est. The ozone layer mea sured at the Brit -ish Ant arc tic Sur vey (BAS) base has de clined each Sep tem ber and Oc to ber since 1977 at a rate of over 40% [1]. Sci en tific cause and con se quence re searches are be com ing top i cal to day.
A sig nif i cant cause in di cated by re search ers in 1928 is chloro fluoro carbons (CFC). These com -pounds, chem i cally sta ble, not toxic or flam ma ble, have found ex ten sive ap pli ca tion in in dus try, with the con se quence of the in creas ing re lease of CFC in the at -mo sphere. While mix ing with air -mol e cules in gen eral cir cu la tion of the at mo sphere, CFC are grad u ally spread ing over the globe [2] un changed in the tro po -sphere through an in ter val from 50 to 100 years [3].
CFC in the at mo sphere slowly as cend upward in the strato sphere in which UVR dis rupts chem i cal bonds of the com pounds. Chlo rine at oms re leased in the pro cess de stroy strato spheric ozone through a cat a -lytic re ac tion; each re leased chlo rine atom de stroys about 100,000 ozone mol e cules.
BAS mea sure ments in di cated un ex pected ozone de ple tion in the Ant arc tic spring time, so se vere that com put ers re ceiv ing data from sat el lite Nim bus 7 of ten re jected the ozone amounts as the mea sure ment er -rors. A par tic u lar con cern of the sci en tific pub lic is the an nual de ple tion of ozone grad u ally ap proach ing the south ern tip of South Amer ica [4].
An in ter na tional con ven tion in 1985, known as the Vi enna Con ven tion, is aimed at pro tect ing the ozone layer from harm ful man-made sub stances. Af ter the ex per i men tal ev i dence that CFC are great de stroy -ers of strato spheric ozone mol e cule [5], the Mon treal Pro to col has been signed for re stricted emis sion of sub stances harm ful to ozone. These in ter na tional mo -tions stand for re duc tion of CFC emis sion which has been sig nif i cantly re duced since the ref er ence year 1989 [6].
Sat el lite mea sure ments in du bi ta bly in di cated in -ter re la tion be tween the state of the ozone layer and UVR. In creased so lar UVR over the Earth’s sur face is a re sult of the strato spheric ozone de ple tion. The ef -fects of UVR on health are vari able. Ex po sure to UVR has a ben e fi cial ef fect on hu man or gan ism in that it ac -ti vates skin pro tec -tive mech a nisms and pro vides for con ver sion of 7-dehydroholesterole into vi ta min D3. In con trast, UVR can be det ri men tal to hu man health in ex po sures to its can cer ous, genotoxic, mutagenic, and immunotoxic ef fects. Sum ma riz ing the re search re sults the Brit ish Na tional Ra dio log i cal Pro tec tion Board [7] re port reads: “there is con vinc ing ev i dence
that UVR can cause dam age to DNA and in an i mal ex -per i ments it has been shown to be a cause of can cer. Ex po sure to UVR also in creases the risk of skin can cer in man and pro duces other un de sir able health ef fects. The main tis sues of the hu man body af fected are those of the skin and the eye. There are also ef fects on the im -mune sys tem, the sig nif i cance of which for hu man health is not yet clear. Ex cess sun ex po sure can in -crease the risk of both non-mel a noma and mel a noma skin can cers, the lat ter be ing the main cause of skin can cer death. Skin can cers cause about 2000 deaths each year in Brit ain, which is about 1.4% of all can cer deaths” (DNA in the quo ta tion de notes de oxy ri bo nu -cleic acid).
Re search data for the Re pub lic of Ser bia [8] in -clude redords of 13475 male and 12187 fe male new pa tients af fected with can cer in cen tral Ser bia, where males were mainly af fected by bronchopulmonary, co lon, and rec tum can cer, while fe males were mainly af fected by breast and cer vi cal can cer. Of the to tal num -ber of pa tients with can cer for the ob served year, skin can cer has af fected 10.9% of male pop u la tion, and 11.1% of fe male pop u la tion. Skin can cer caused death of about 0.4% of the af fected males and around 0.3% of the af fected fe males out of all can cer deaths, or about 4.0% of males and around 2.7% of fe males af -fected by skin can cer.
In the con text of the ben e fi cial UVR, UVR is used in cur ing rick ets, pso ri a sis, ec zema, and some forms of jaun dice. In small dozes, it is nec es sary for vi -ta min D and calciferol synthetization [9].
In agree ment with the Com mis sion In ter na tional de l’Eclairage def i ni tion (CIE), UVR spec trum is di vided into three wave length ranges [10]: UVC (100-280 nm), UVB (280-315 nm), and UVA (315-400 nm), where nm de notes nanometer (10–9m). The lim its be tween the di vi sions are
em pir i cal. So lar UVR of 280 nm and lon ger wave lengths (UVA and UVB) reaches the Earth’s sur face, but the rest of the UVR spec trum (UVC) is se lec tively ab sorbed by the at mo sphere [11]. There is a small prob a bil ity that wave lengths shorter than 280 nm reach the Earth’s sur face, be -cause strato spheric ozone fully ab sorbs UVC and most of UVB com po nent. Thus, UVR at the ground level con sists of high UVA and very low UVB ra di a tion which is bi o log i -cally most ef fec tive. In di vi sions as so ci ated with bi o log i cal ef fect, the limit is 290 nm, be cause wave lengths shorter than 290 nm are be lieved to cause sud den death of live cells [12]. The up per UVB bound ary at 315 nm is rather ar bi trary with re la tion to the mi cro bi o log i cal ef fect of UVB ra -di a tion. Re cent photomicrobiological re searches show that ra di a tion wave lengths in ex cess of 315 nm are photobiologically ef fec tive so that the UVB limit at 330 or 340 nm would be more ad e quate than the pres ent limit. UVB ra di a tion has highly del e te ri ous ef fect. A large amount of it does not reach the Earth, which de pends on the ozone depth.
This pa per is con cerned with the re search, based on sat el lite mea sure ments, of changes in strato spheric
ozone as an in di rect cause of UVR vari abil ity – a sig -nif i cant fac tor of health risk over an ar bi trary se lected lo ca tion which con sists of Ser bia and bor der ing ar eas of South east and Cen tral Eu rope.
METH ODS OF RE SEARCH
The first step of the re search con cerned the data base for ozone layer over the se lected lo ca tion. Sat el -lite mea sure ments from the last thirty years were used, made avail able to pub lic by the Na tional Aero nau tics and Space Ad min is tra tion (NASA), the Goddard Space Flight Cen ter – Dis trib uted Ac tive Ar chive Cen ter. The pro cessed data come from five sat el lites: Nim bus-7 – the Earth-ob serv ing sat el lites NASA and NOAA – The Na tional Oce anic and At mo spheric Ad min is tra tion (1978 1993), Meteor3 – Rus sian me te o ro log i cal sat el lites (19911994), Jap a nese Earth re -sources sat el lites ADEOS – Ad vanced Earth Ob serv ing Sat el lite (1996-1997), Earth Probe (19962006), and OMI – the Ozone Mon i tor ing In -stru ment (from 2004 to date). All above men tioned sat el lites used the same mea sure ment tech nique – Back scat tered Ul tra Vi o let (BUV) and in stru ments – Totale Ozone Map ping Spec trom e ters (TOMS).
The sat el lite data formed the main base and were most use ful in the study of the phe nom ena char ac ter is -tic of ozone in the at mo sphere. Raw sat el lite data use an al go rithm for pro cess ing in NASA/GSFC-DAAC be fore pre sen ta tion [13]. Data used in this pa per are the lat est ver sion 8 of an im proved TOMS pro cess ing al go rithm. The avail able da ta base con tains a tex tual file, the daily global re cords for each day of sat el lite mea sure ments.
The prob lem first en coun tered in form ing da ta -base was se lec tion, for a ter ri tory over 10 GB in size, from over 50,000 daily re cords through thirty years of mea sure ment. An other prob lem was the change of the sat el lite mea sure ment res o lu tion. Sat el lites Nim bus 7, Meteor 3, ADEOS, and Earth Probe made mea sure -ments at a pre de ter mined net work with res o lu tion of 1º for geo graphic lat i tude and 1.25° for geo graphic lon -gi tude. Sat el lite OMI made mea sure ments from 2004 at res o lu tion of 1º for both lat i tude and lon gi tude. The change in the net work pro vided greater global data-cov er age, but also shifted mea sur ing sites of the new se ries of data in re la tion to the pre vi ous ones and ad di tion ally com pli cated the re search.
points for Ser bia at the res o lu tion of 1º ´ 1.25 º than at the resolution of 1º ´ 1º (due to the rel a tive shift of the points with the change in the net work res o lu tion). The rest of mea sure ment sites out of to tal 24 sites are lo -cated on the terriotory of neigh bor ing coun tries in the des ig nated do main, equally dis trib uted on all sides.
A daily re port on the mea sured amount of ozone is gen er ated each day of the sat el lite observation. A sec tion with the mea sure ment in for ma tion is in the be -gin ning of the re port. An ex am ple of the daily re port sec tion on ozone mea sure ment for Feb ru ary 20, 1998, from the Earth Probe sat el lite is given in tab. 1. The same goes for the ozonemea sur ing sat el lites in func -tion be fore it.
The last two lines in the sec tion are about the mea sure ment sites of the sat el lite and data ar range -ment for sub se quent mea sure -ment.
For the for mer net work step 1º ´ 1.25º, the start -ing mea sure ment site is at the lat i tude of –89.5º (south) and the last at +89.5º (north), or 180 mea sure -ment sites with half-de gree cen tres on lat i tude. The data are di vided in groups, with one group cor re spond -ing to a lat i tu di nal zone, given in the end of the group (for ex am ple, lat. 45.5 cor re sponds to the mea sure -ments taken at lat i tude 45.5º north.). Data within each group cor re spond to 1.25º step site of the lon gi tude, with the first site at –179.375º (west) and last at +179.375º (east), or a to tal of 288 lon gi tu di nal zones. Each group in cludes three-digit in for ma tion on the amount of ozone in Dobson units (DU)1. The se rial
num ber of in for ma tion is the lon gi tude of the mea sure ment site. The to tal num ber of sites in which the sat el lite scans the Earth’s at mo sphere with the given res o -lu tion and the to tal num ber of data in each daily re port are ob tained by mul ti ply ing the to tal lon gi tu di nal and
lat i tu di nal mea sure ment zones, or 180 ´ 288 = 51840 mea sure ments.
More re cent mea sure ments from OMI sat el lite have the res o lu tion of 1º for lat i tude and 1º for lon gi -tude. Lat i tu di nal mea sure ment zones are the same as those of the pre vi ous sat el lites, be tween –89.5º (south) and +89.5º (north), or 180 zones cen tered at the half-de gree of lat i tude. Data within each lat i tu di nal zone cor re spond to the lon gi tu di nal zones which are sub di vided by 1º step be tween –179.5º (west) and +179.5º (east), or a to tal of 360 lon gi tu di nal zones. A denser net work pro vides more data. Daily re ports from OMI sat el lite are sim i lar to the re ports from ear -lier sat el lite mea sure ments. The to tal in for ma tion on sites of the Earth’s at mo sphere scanned from OMI and the to tal num ber of data in each daily re port from this sat el lite is ob tained as a mul ti pli ca tion re sult of the to -tal lon gi tu di nal and lat i tu di nal mea sure ment sites, or 180 ´ 360 = 64800.
The prob lem of data selection for the Ser bian do main was solved by spe cific soft ware that au to mat i -cally se lected rel e vant data from the tex tual files of both net works, and led to the fi nal data base for the thirty-year mea sured ozone layer over Ser bia. Man ual se lec tion of data from the daily re ports was im pos si -ble, be cause it would take years. The da ta base con tains sat el lite mea sure ments from No vem ber 1, 1998, to Oc to ber 31, 2009, with a gap for 1995 and 1996.
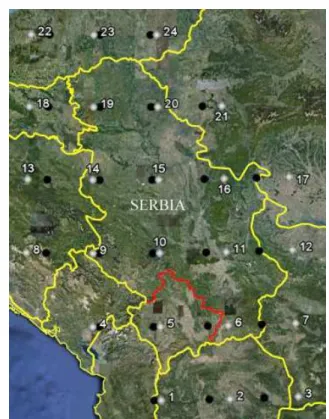
Mea sure ment sites for the Re pub lic of Ser bia do -main are be tween lat i tudes 41.5º and 46.5º north and be tween lon gi tudes 18.125º and 23.125º east, or a to tal of 24 mea sure ment sites for the given res o lu tion. The co-or di nates of the mea sure ment sites (MS) for the mea sure ment of ozone layer thick ness from the Ser -bian do main for the res o lu tions of 1º ´ 1.25 º and 1º ´ ´.1º are shown in tab. 2.
In or der to ob tain a suf fi ciently long se ries of data, the sat el lite re cords from res o lu tion sites 1º ´ ´.1.25º in 19792004 were com bined with the mea -sure ments from the sites 1º ´ 1º af ter 2004. There were mi nor dis crep an cies be tween the mea sure ment sites of the two net works (fig. 1), but the con ti nu ity of the se -ries was main tained. Net mea sure ment sites with the res o lu tion of 1 ´ 1.25 are shown in white color, while the mea sure ment sites with the res o lu tion of 1 ´ 1 are in black color. The er ror of com bin ing two se ries was even neg li gi ble, be cause the dis tance be tween two sites was al ways less than 50 km (max i mum 45 km for the east ern most sites be yond the Ser bian ter ri tory).
The other step in the re search is based on the de -duc tions from the cal cu la tions of sta tis ti cal pa ram e ters and sta tis ti cal anal y sis.
Ta ble 1. Daily re port sec tion on ozone mea sure ments from Earth Probe sat el lite for Feb ru ary 20, 1998
Day: 51 Feb. 20, 2998
Days in the year (51) and respective dates
EP/TOMS
Name of satellite
(Eart Probe)/measuring instrument (TOMS)
NRT OZONE Measured parameter (ozone)
GEN: 04.116 V8 Algorithm version of data generation (version 8)
ALECT: 12:00 AM Time of measurement
Longitudes 288 bins centeres on 179.375W to179.375E (1.25 degree steps)
Latitudes 180 bins centered on 89.5S to 89.5N(1.00 degree steps)
1 The Dobson unit [DU] is the unit mea sure for to tal ozone. A Dobson unit is de fined as the ozone col umn 10
RE SULTS AND DIS CUS SION
The av er age thick ness of ozone mea sured in 1979-2008 at 24 sites over the re search do main is 330 DU. The stan dard de vi a tion in the same mea sur ing pe -riod is 29.7 DU, max i mum 528 DU, min i mum 204 DU, and me dian 327.9 DU. Me dian thick ness some -what be low the mean value in di cates greater fre -quency of low val ues, but also more ex treme high than low strato spheric ozone thick ness, which is sig nif i cant for UVR in ten sity on the ground level.
The men tioned sta tis ti cal pa ram e ters are given in tab. 3.
Strato spheric ozone changed thick ness over the ter ri tory of Ser bia and im me di ate bor der ing area from 1979 to 2008 in a reg u lar an nual cy cle. The min i mum av er age thick ness (287.7 BU) is in Oc to ber. The mean value grad u ally in creases to 371 DU in April and then de creases to Oc to ber.
Pierson’s cor re la tion co ef fi cient is high, mostly around 0.9, be tween the mea sure ment sites. Cor re la -tion is the high est be tween two near est sites, and the low est be tween most dis tant lon gi tu di nal sites. This has been ex pected and agrees with the pre vail ing the ory on the ozone lat i tu di nal dis tri bu tion [14]. The sam ple con sid ered is rep re sen ta tive, be cause the cor re la -tion on daily ba sis is cal cu lated for a mea sure ment pe riod of 30 years. It leads to a con fi dent con clu sion that the amounts of ozone in all sites over Ser bia are strongly in ter de pen dent. The high cor re la tion be tween the mea sure ment sites was ex pected for a small lo ca -tion like Ser bia. The covariance of all sites is pos i tive, very high, which cor rob o rates the as sumed phase of all Ta ble 2. Co or di nates of mea sure ment sites for
mea sure ment of ozone layer thick ness from Ser bian do main
MS1
Net resolution 1° ´ 1.25° Net resolution 1° ´ 1° Geographical
latitude Geographicallongitude Geographical latitude Geographicallongitude 1 41°30'N2 20°37'30" E3 41°30'N 20°30'E
2 41°30'N 21°52'30" E 41°30'N 21°30'E
3 41°30'N 23°07'30" E 41°30'N 22°30'E
4 42°30'N 19°22'30" E 42°30'N 19°30'E
5 42°30'N 20°37'30" E 42°30'N 20°30'E
6 42°30'N 21°52'30" E 42°30'N 21°30'E
7 42°30'N 23°07'30" E 42°30'N 22°30'E
8 43°30'N 18°07'30" E 43°30'N 18°30'E
9 43°30'N 19°22'30" E 43°30'N 19°30'E
10 43°30'N 20°37'30" E 43°30'N 20°30'E
11 43°30'N 21°52'30" E 43°30'N 21°30'E
12 43°30'N 23°07'30" E 43°30'N 22°30'E
13 44°30'N 18°07'30" E 44°30'N 18°30'E
14 44°30'N 19°22'30" E 44°30'N 19°30'E
15 44°30'N 20°37'30" E 44°30'N 20°30'E
16 44°30'N 21°52'30" E 44°30'N 21°30'E
17 44°30'N 23°07'30" E 44°30'N 22°30'E
18 45°30'N 18°07'30" E 45°30'N 18°30'E
19 45°30'N 19°22'30" E 45°30'N 19°30'E
20 45°30'N 20°37'30" E 45°30'N 20°30'E
21 45°30'N 21°52'30" E 45°30'N 21°30'E
22 46°30'N 18°07'30" E 46°30'N 18°30'E
23 46°30'N 19°22'30" E 46°30'N 19°30'E
24 46°30'N 20°37'30" E 46°30'N 20°30'E
1
Mea sure ment site
2 North ern geo graph ical lat i tude
3
East ern geo graph ical lon gi tude
Fig ure 1. Ozone mea sure ment sites over Ser bian do main for both res o lu tions 1° ´ 1.25° and 1° ´ 1°
Ta ble 3. Sta tis ti cal pa ram e ters of ozone layer thick ness over the se lected lo ca tion (1979-2008)
Months: Jan. Feb. Mar. Apr. May June July Avg. Sept. Okt. Nov. Dec.
Mean [DU] 334.6 357.3 365.6 371 356.9 342.8 325.1 312.4 303.3 287.7 291.6 311.8
Median [DU] 331 359 362 366 356 341 323 310 302 286 290 309
Minimum [DU] 204 217 240 263 263 277 273 266 243 232 209 214
Maximum [DU] 479 516 528 519 480 455 425 402 384 381 413 426
Standard dev. [DU] 42.5 46.5 41.9 35.8 30.1 24 21.7 18.4 19 19.1 25.5 32.1
the mea sure ment sites. The max i mum daily vari ance in ozone amount be tween sites is around ±7%, and the av er age daily dif fer ence in re la tion to mean daily amount is about ±3%. The dif fer ence in the ozone amount is the high est be tween the south ern and north ernmost sites. It is com par a tively small, and in re la tion to the mean daily thick ness it is at the mea sure -ment er ror level.
In view of the fact that the cor re la tions of the daily amounts of ozone over Ser bian do main are high among all mea sure ment sites and that the changes in all sites are in-phase among them selves, the Ser bian do main may be taken to be the site of the sat is fac tory mea sure ment ac cu racy. This ap proach for the con sid -ered se ries led to av er age an nual amounts of ozone over Ser bia (tab. 4).
The mean an nual ozone con cen tra tion over Ser bia of 330 DU is higher than the plan e tary con cen tra -tion by as much as 40 units (13.8%). In re la -tion to the mean an nual ozone con cen tra tion for north ern hemi -sphere, the amount of ozone over Ser bia is higher by 23 DU (7.9%) [15]. The av er age an nual ozone thick -ness at the lat i tude of Ser bia is com par a tively high, which im plies mi nor health risk from UVR.
The ozone amount reg is tered over Ser bia was the high est (347.6 DU) in the first year (1981) of the time se quence and the low est (311.36 DU) in 1993. The mean value of the three high est ozone depths in the time se ries (1979-1981) is 346.6 DU, in agree ment with the high est three-year value of Wolf num ber (150.1) for the given pe riod. This is con sis tent with the ob served dom i nant con tri bu tion of so lar ra di a tion to the pro duc tion of ozone [16-19]. The low est ozone amount of 311.36 DU was reg is tered two years after the Mt. Pinatubo erup tion, which was the great est vol -ca nic erup tion in the lat ter half of the 20th cen tury [20].
The larg est de cline of 24.3 DU among the suc ces sive years was reg is tered in 1992, a year af ter the stron gest erup tion. Great de crease in ozone con cen tra tion was
ob served in 1983, a year af ter the erup tion of El Chichon vol cano. This is also con sis tent with the fact that sul phur and chlo rine re leased in the form of vol ca -nic aero sol are det ri men tal to strato spheric ozone [21]. Trends in strato spheric ozone de cline over Ser -bia are shown in fig. 2.
The cu mu la tive de cline of the an nual at mo -spheric ozone over Ser bia for 1979-2008 was 7.6%, or 2.5% per de cade. The de crease in strato spheric ozone agrees with the changes over the neigh bor coun tries. The cu mu la tive de cline for Bu cha rest (1980-2003) is 8.1% and sim i lar percents are ob tained for other lo ca -tions in mid-lat i tudes [22-24].
Stud ies of the so lar ac tiv ity ef fects on ozone re -vealed a con nec tion be tween the changes in po lar faculae and ozone [25]. The po lar faculae show anti-plase syn chro nous with strato spheric ozone above Ser bia, which shows that they con trib ute to the ozone de ple tion. Po lar faculae are lo cal mag netic fields in high heliographic lat i tudes, up to about 2300 km in di am e ter [26]. Po lar faculae are in anti-phase with sun spots faculae, while the in ten sity of a lo cal mag netic field can ex ceed 4 mT [27]. The con nec tion mech a nism of po lar faculae and strato spheric ozone could op er ate through coronally holes round the Sun. Sub stance in coronally holes, un der cer tain con di tions, can over power the pull of grav i ta tional and mag -netic forces of the Sun and leave it in the form of so lar wind. Par ti cles of the so lar wind en hance for ma tion of ni tro gen ox ides whose mul ti plied con cen tra tion de -com poses ozone [25].
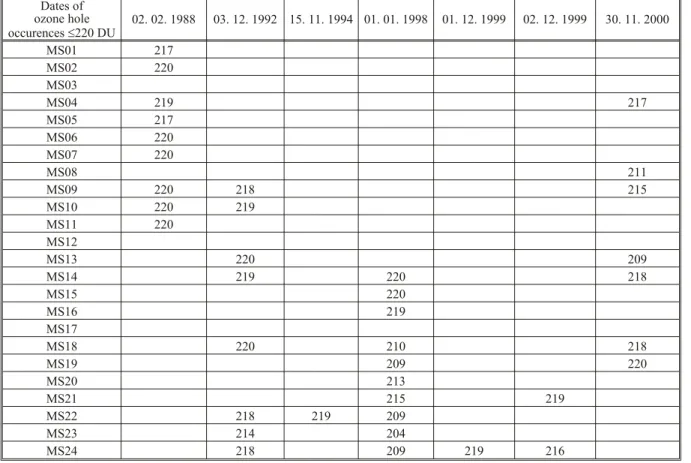
Ozone holes over Ser bian ter ri tory and im me di -ate sur round ing, de fined by the ozone thick ness (1979-2008) of 220 DU or less, oc cur once in five years on av er age. Only once, in one mea sure ment site, an ozone hole ap peared for two con sec u tive days (De -cem ber 1 and 2, 1999, tab. 5). All oth ers were one-day oc cur rences reg is tered in the No vem berFeb ru ary in -ter val when the Sun is low on the ho ri zon and the level of UV ra di a tion in dex is also low. Ozone holes over the given do main were most fre quent in No vem ber and De cem ber, and never cov ered more than half the Ser -bian ter ri tory.
Ta ble 4. Av er age ozone thick ness over Ser bia
Year Mean value [DU]
Maximum error [DU]Year
Mean value [DU]
Maximum error [DU]
1979 345.97 0.03 1994 326.07 0.03
1980 346.39 0.03 1995
1981 347.60 0.03 1996
1982 343.35 0.02 1997 320.92 0.02
1983 328.98 0.02 1998 333.65 0.02
1984 342.42 0.03 1999 324.95 0.02
1985 327.86 0.04 2000 317.40 0.02
1986 334.56 0.03 2001 324.99 0.03
1987 340.51 0.02 2002 316.83 0.01
1988 330.88 0.03 2003 329.03 0.02
1989 332.20 0.02 2004 329.91 0.03
1990 326.06 0.02 2005 327.09 0.02
1991 343.03 0.02 2006 319.54 0.05
1992 318.75 0.02 2007 325.61 0.02
1993 311.36 0.02 2008 318.02 0.02
CON CLU SIONS
The re search of changes in strato spheric ozone over Ser bia and im me di ate sur round ing (1979-2008) for 24 mea sure ment sites in di cated the most likely av -er age ozone depth of 330 DU. The mean lo cal ozone is 40 DU greater than the plan e tary thick ness. The an -nual cy cle of change is reg u lar, with min i mum (287.7 DU) in Oc to ber and max i mum (371 DU) in April. The cu mu la tive de crease of strato spheric ozone for the same pe riod is 7.6%, or 2.5% per de cade. The max i -mum ozone depths at the be gin ning of the time-se ries agree with the so lar ac tiv ity max ima. The re search re -sults are con sis tent with the hypothetic ef fect of Sun’s po lar faculae on the ozone de com po si tion. The low est amount of ozone (311.4 DU) was re corded two years af ter the Mt. Pinatubo erup tion, which was the great est vol ca nic erup tion in the lat ter half of the 20th cen tury.
Ozone holes over the Ser bian ter ri tory in the ob -ser va tion pe riod (1979-2008) oc curred once in five years on av er age. There was a sin gle oc cur rence of one ozone hole re main ing for two con sec u tive days in this pe riod at one mea sure ment site. All other oc cur rences were reg is tered in the pe riod No vem ber-Feb ru ary when UVR in dex is low.
The an nual amount of ozone layer over the lat i -tudes of Ser bia is com par a tively high. Con se quently, the health risk is smaller from the ob served trend of de -creas ing strato spheric ozone con cen tra tion. Ozone holes and the as so ci ated in creased UVR over Ser bian
lo ca tion are not a se ri ous threat to the health of the pop u la tion.
REF ER ENCES
[1] Farman, J. C., Gar di ner, B. G., Shanklin, J. D., Large Losses of To tal Ozone in Antarctica Re veal Sea sonal ClOx/NOx in ter ac tion, Na ture, 315 (1985), 6016, pp. 207-210
[2] Love lock, J. E., Maggs, R. J., Wade, R. J., Halogenated Hy dro car bons in and over the At lan tic, Na ture, 241 (1973), 5386, pp. 194-196
[3] Molina, M. J., Rowland, F. S., Strato spheric Sink for Chlorofluoromethanes – Chlo rine Atomic Catalysed De struc tion of Ozone, Na ture, 249 (1974), 5460, pp. 810-812
[4] ***, NASA, To tal Ozone Map ping Spec trom e ter, GSFC Code 613.3, 2009, http://toms.gsfc.nasa.gov [5] Sol o mon, S., Gar cia, R. R., Rowland, F. S., Wuebbles,
D. J., On the De ple tion of Ant arc tic Ozone, Na ture, 321 (1986), 6072, pp. 755-758
[6] ***, Pro duc tion and Con sump tion of Ozone De plet -ing Sub stances un der the Mon treal Pro to col 1986-2004, 2005, Ozone Sec re tar iat UNEP, p. 75, http://ozone.unep.org.Pub li ca tions/Pro duc
-tion_and_consumption2005.pdf
[7] ***, Na tional Ra dio log i cal Pro tec tion Board, Health Ef fects from Ul tra vi o let Ra di a tion, Chilton, Re port of an Ad vi sory Group on Non-Ion is ing Ra di a tion, 13 (2002), 1, p. 282, Doc u ment of the NRPB 13/1 [8] ***, Health Sta tis ti cal Year book of the Re pub lic of
Ser bia 2009, In sti tute of Pub lic Health Dr. Mi lan Jovanovic Batut, 2010, Bel grade, p. 365,
Table 5. Ozone hole occurrences in network of ozone monitoring sites from the Serbian domain (1979-2008)
Dates of ozone hole occurences £220 DU
02. 02. 1988 03. 12. 1992 15. 11. 1994 01. 01. 1998 01. 12. 1999 02. 12. 1999 30. 11. 2000
MS01 217
MS02 220
MS03
MS04 219 217
MS05 217
MS06 220
MS07 220
MS08 211
MS09 220 218 215
MS10 220 219
MS11 220
MS12
MS13 220 209
MS14 219 220 218
MS15 220
MS16 219
MS17
MS18 220 210 218
MS19 209 220
MS20 213
MS21 215 219
MS22 218 219 209
MS23 214 204
http://www.batut.org.rs/down -load/publikacije.pub2009.pdf
[9] Stankovi}Niki}, D., Air Pollution and Health, Sec re -tar iat of La bor, Health and Wel fare, Bel grade, 2003, ISBN 86-7650-008-8
[10] ***, Com mis sion Internationale de l’Eclairage, Paris, CIE Pub li ca tion, 69 (1985)
[11] Nikoli}, J., Evap o ra tion of Wa ter in Nat u ral Con di -tions, Geo log i cal, Hidrological and Me te o ro log i cal As pects, Sci en tific Mono graph, RHMIS, Bel grade, 2002, ISBN 86-80851-05-1, pp. 126-128
[12] Mijatovi}, Z., ^onki}, Lj., Miljkovi}, S., UV Radiation – Sources, Features, Effects and Protection (in Ser bian), Fac ulty of Sci ence and Math e mat ics, Novi Sad, Serbia, 2002, pp.13-18
[13] ***, NASA, To tal Ozone Map ping Spec trom e ter, GSFC Code 613.3, 2009,
http://jwocky.gsfc.nasa.gov, ftp://jwocky.gsfc.nasa.gov [14] Rawcliffe, R. D., Elliott, D. D., Lat i tude Dis tri bu tion
of Ozone at High Al ti tudes, De duced from a Sat el lite Mea sure ment of the Earth’s Ra di ance at 2840 A, J. Geophys. Res., 71 (1966), 21, pp. 5077-5089 [15] *** Johnston’s Ar chive, His tor i cal Data Re lat ing to
the Ozone Layer, Com piled by Wm. Rob ert Johnston, last up dated 18 May, 2006,
http://www.johnstonsarchive.net/en vi ron -ment/o3cltable.html
[16] Aus tin, J., Hood, L. L., Soukharev, B. E., So lar Cy cle Vari a tions of Strato spheric Ozone and Tem per a ture in Sim u la tions of a Cou pled Chem is try-Cli mate Model, Atmos. Chem. Phys., 7 (2007), 6, pp. 1693-1706 [17] Callis, L. B., Natarajan, M., Lambeth, J., Cal cu lated Up
-per Strato spheric Ef fects of So lar UV Flux and NOy Vari a tions Dur ing the 11-year So lar Cy cle, Geophys. Res. Lett., 27 (2000), 23, pp. 3869-3872
[18] Hoyt, D. V., Schatten, K., The Role of the Sun in Cli mate Change, Ox ford Uni ver sity Press, New York, USA, 1997
[19] Zhou, S., Rottman, G. J., Miller, A. J., Strato spheric Ozone Re sponse to Short and In ter me di ateTerm Vari
-a tions of So l-ar UV Flux., J. Geophys. Res.,102 (1997), (D7), pp. 9003-9011
[20] Bluth, G. J. S., Doiron, S., Schnetzler, C. C., Krueger, A. J., Wal ter, L. S., Global Track ing of the SO Clouds from the June 1991 Mount Pinatubo Erup tions, Geophys. Res. Lett., 19 (1992), 2, pp. 151-154
[21] Bluth, G. J. S., Schnetzler, C. C., Krueger, A. J., Wal ter, L. S., The Con tri bu tion of Ex plo sive Vol ca nism to Global Sul phur Di ox ide Con cen tra tions, Na ture, 366 (1993), 6453, pp. 327-329
[22] Laura, M., Constantin, R., Vari a tions of Tem per a ture and To tal Ozone over Bu cha rest, Qua dren nial Ozone Sym po sium, 2004,
http://www-imk.fzk.de/imk2/strazon/qos2004/cd/files/ 113.doc
[23] Fioletov, V., Ozone Vari a tions over Midlatitudes and on the Global Scale, Amer i can Geo phys i cal Un ion, Fall Meet ing, 2005, A21G-01
[24] Har ris, N. R. P., Kyro, E., Staehelin, J., Brun ner, D., Andersen, S. B., Godin-Beekmann, S., Dhomse, S., Hadjinicolaou, P., Hansen, G., Isaksen, I., Jrrar, A., Karpetchko, A., Kivi, R., Knudsen, B., Krizan, P., Lastovicka, J., Maeder, J., Orsolini, Y., Pyle, J. A., Rex, M., Vanicek, K., Weber, M., Wohltmann, I., Zanis, P., Zerefos, C., Ozone Trends at North ern Mid- and High Lat i tudes – a Eu ro pean Per spec tive, Ann. Geophys., 26 (2008), 5, pp. 1207-1220
[25] Duci}, V., Nikoli}, J., Dy nam ics of Ozone Layer Over Ser bia and So lar Ac tiv ity (in Ser bian), Bul le tin of the Ser bian Geo graph ical So ci ety, 88 (2008), 1, pp. 69-78 [26] Evren, S., Facular Struc tures on Cool Stars, in: In ter na
-tional Work shop Mag netic Ac tiv ity in Cool Stars, 2000 [27] Zhang, M., Zhang, H. Q., Dif fer ent Mag netic Fea tures
be tween So lar Po lar and Equa to rial Mag netic Fields, Astron. Astrophys., 352 (1999), 1, pp. 317-320
Re ceived on April 11, 2011 Ac cepted on July 4, 2011
Jugoslav L. NIKOLI], Vladan D. DUCI], Nata{a M. MARTI]-BURSA]
DINAMIKA STRATOSFERSKOG OZONA I ULTRAVIOLETNO ZRA^EWE IZNAD SRBIJE
Smawewe debqine ozonskog omota~a Zemqe direktno uti~e na pove}awe ultravioletnog zra~ewa sa potencijalnim efektima na zdravqe qudi. U radu je ispitivana dinamika stratosferskog ozona nad teritorijama Srbije i neposrednog okru`ewa u periodu 1979-2008. godine. Konstatovan je kumulativni pad debqine ozona za 7.6%. Ukazano je na uticaj Sun~eve i vulkanske aktivnosti na me|ugodi{wu varijabilnost debqine stratosferskog ozona. Debqina ozonskog omota~a nad teritorijom Srbije je za 13.8% ve}a od planetarne, a ozonske “rupe” se javqaju prose~no jednom u 5 godina i ne predstavqaju ozbiqniju pretwu po zdravqe stanovni{tva.