www.solid-earth.net/6/621/2015/ doi:10.5194/se-6-621-2015
© Author(s) 2015. CC Attribution 3.0 License.
Revealing the deeper structure of the end-glacial Pärvie fault system
in northern Sweden by seismic reflection profiling
O. Ahmadi1, C. Juhlin1, M. Ask2, and B. Lund1
1Department of Earth Sciences, Uppsala University, Villavägen 16, 752 36 Uppsala, Sweden 2Department of Civil, Environmental and Natural Resources Engineering, Luleå University of Technology, 971 87 Luleå, Sweden
Correspondence to:O. Ahmadi ([email protected])
Received: 22 December 2014 – Published in Solid Earth Discuss.: 4 February 2015 Revised: 27 April 2015 – Accepted: 2 May 2015 – Published: 3 June 2015
Abstract. A new seismic reflection survey for imaging deeper levels of the end-glacial Pärvie fault system in north-ern Sweden was acquired in June 2014. The Pärvie fault sys-tem hosts the largest fault scarp so far documented in north-ern Scandinavia, both in terms of its length and calculated magnitude of the earthquake that generated it. Present-day microearthquakes occur along the length of the fault scarp on the eastern side of the scarp, in general agreement with an east-dipping main fault. In the central section of the fault sys-tem, where there is a number of subsidiary faults east of the main Pärvie scarp, it has been unclear how the earthquakes relate to the structures mapped at the surface. A seismic pro-file across the Pärvie fault system acquired in 2007, with a mechanical hammer as a source, showed a good correlation between the surface mapped faults and moderate to steeply dipping reflections. The most pronounced reflectors could be mapped to about 3 km depth. In the new seismic survey, for deeper penetration an explosive source with a maximum charge size of 8.34 kg in 20 m deep shot holes was used. Re-flectors can now be traced to deeper levels with the main 65◦ east-dipping fault interpreted as a weakly reflective structure. As in the previous profile, there is a strongly reflective 60◦ west-dipping structure present to the east of the main fault that can now be mapped to about 8 km depth. Extrapolations of the main and subsidiary faults converge at a depth of about 11.5 km, where current earthquake activity is concentrated, suggesting their intersection has created favorable conditions for seismic stress release. Based on the present and previ-ous seismic reflection data, we propose potential locations for future boreholes for scientific drilling into the fault sys-tem. These boreholes will provide a better understanding of
the reflective nature of the fault structures and stress fields along the faults at depth.
1 Introduction
During the last glaciation the ice that covered much of north-ern Europe, with thickness in excess of 3 km, gave rise to dynamic changes in the stress field of the Fennoscandian Shield (Pascal et al., 2010). Towards the end of the glacia-tion, the ice melted rapidly in northern Fennoscandia and the effective stress field changed accordingly, generating major faulting (Lagerbäck, 1978) with associated large earthquakes (M7-8.2; e.g., Muir-Wood, 1988; Arvidsson, 1996; Lind-blom et al., 2015). The resulting fault scarps have been alter-natively termed end-glacial scarps, post-glacial fault scarps or glacially induced fault scarps; we use the first term in this paper as it is appropriate for the Pärvie fault.
Important questions concerning the end-glacial faults are as follows: (i) what is the geometry of the faults at depth and their extent? (ii) What was the stress field that caused these ruptures during the last deglaciation? (iii) What is the stress field at depth that is generating the current earthquake activity along the faults. Knowledge of the fault geometry is important for understanding the stress required to activate the faults during the last deglaciation and also for predictions of potential future earthquakes along these faults (e.g., Lund et al., 2009).
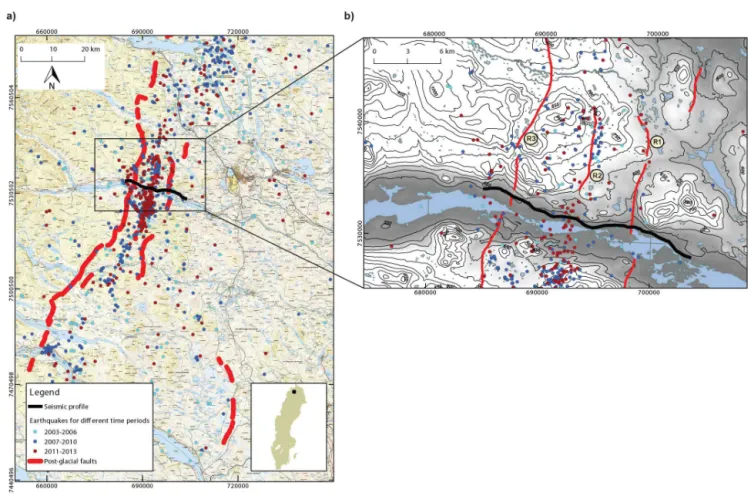
Figure 1.Location of the seismic profile over the Pärvie fault system in northern Sweden. Earthquakes are shown for three different time periods (after Lindblom et al., 2015). Inset shows the location of the Pärvie area in northern Sweden.(b) The end-glacial Pärvie faults overlaid on a topographic map.©Lantmäteriet I2014/00601.
of up to 30 m (Kuivamäki et al., 1998; Olesen et al., 2004; Lagerbäck and Sundh, 2008). They generally strike in the NE–SW direction, dip toward the southeast and show reverse faulting motion. The longest of the scarps, located in north-ern Sweden, belongs to the Pärvie fault system and has been the focus of recent geophysical studies, including reflection and hydroacoustic seismic surveying (see Fig. 1) (Juhlin et al., 2010; Vogel et al., 2013), a temporary seismic network (Lindblom et al., 2015) and remote sensing (Mantovani and Scherneck, 2013).
To investigate an end-glacial fault at depth and help un-ravel the stress history of northern Fennoscandia, the Drilling into Active Faults in Northern Europe (DAFNE) project has been initiated (Kukkonen et al., 2010, 2011). Deep research boreholes to depths of 2–3 km are planned in order to bet-ter understand the present-day stress field and the seismic-ity associated with the faults, as well as studying the geol-ogy, fluids, gases and microbes in the end-glacial faults. The DAFNE project is part of the Swedish Scientific Drilling Pro-gram (www.ssdp.se) and the International Continental Scien-tific Drilling Program (www.icdp-online.org). The reflection seismic survey presented in Juhlin et al. (2010) was a first
step toward optimally positioning a deep borehole in the fault system.
A recent reflection seismic survey (acquired in 2007) across the Pärvie fault system west of the city of Kiruna showed that the faults comprising the system have moder-ate to steep dips and planar geometries down to at least 2– 3 km depth (Juhlin et al., 2010). Similar geometries were found for faults belonging to the Burträsk fault system fur-ther to the southeast (Juhlin and Lund, 2011). The more sub-horizontal reflections from the Pärvie area were inter-preted as possibly originating from deeper-lying greenstones or gabbroic bodies. The main east-dipping Pärvie fault was not very reflective in contrast to a parallel west-dipping sub-sidiary fault within the system. Juhlin et al. (2010) suggested that the Pärvie fault system could represent a flower struc-ture and concluded that it is unlikely that the main fault be-comes listric above 6 km depth. Mapping of brittle defor-mation structures on outcrops in the area of the main fault also indicates relatively steep dips in the near surface (Riad, 1990).
Table 1. Seismic acquisition parameters used during the seismic recording.
Profile length 22 km
Seismic source Explosive 8.34 kg shot hole−1
Geophone 10 Hz
Receiver spacing 25 m Nominal shot spacing 400 m Sampling rate 1 ms Number of shots 100 Percentage of shots with 92 % full charge
Recording length 25 s Active channels 300–390 Recording date June 2014
a sparser spacing between the source points and with longer offsets. The Juhlin et al. (2010) survey used an industrial hy-draulic hammer as a seismic source and an asymmetric split-spread recording geometry. Using several kilograms of ex-plosives in deep shot holes will generally generate seismic signals that penetrate the earth deeper than a surface-based operated hammer. Therefore, it was expected that the new survey would verify the geometry of the main Pärvie fault and allow mapping of the subsidiary faults to deeper levels in the crust, but with a lower-resolution image of the upper-most few kilometers. This was indeed the case, and together with re-migrated sections of the previous data with the veloc-ity model obtained from Lindblom et al. (2015) we show how the fault system can be mapped to greater depth and how the obtained image can be correlated with the earthquakes occur-ring in the area.
2 Tectonics and seismicity of the area
The Pärvie fault is located in the intraplate Baltic Shield, mostly in Paleoproterozoic rock on the boundary to the Archean terrain of northernmost Sweden. It runs parallel with, and only some 10–50 km away from, the Ordovician Caledonian mountain front. The establishment of permanent seismic stations in northern Sweden in 2003–2004, as part of the Swedish National Seismic Network (Bödvarsson and Lund, 2003), showed that the Pärvie fault, and the other end-glacial faults in northernmost Sweden, are still seismically active. In fact, 70 % of the earthquakes recorded north of 66◦N since 2003 are located within 30 km to the southeast and 10 km to the northwest of an end-glacial fault; this is con-sistent with the observed reverse faulting, dip to the south-east, character of the faults (Lindblom et al., 2015). Between 2007 and 2010 a temporary network of seismic stations was operated along the Pärvie fault, bringing the number of sta-tions in the vicinity of the fault to 15. Although still sparse for a 155 km long fault, the temporary network significantly im-proved the detection threshold and location accuracy along
the fault. Lindblom et al. (2015) analyzed the earthquakes recorded along the Pärvie fault between 2003 and 2013. The epicentral locations (Fig. 1) show that the earthquakes oc-cur all along the mapped fault scarp, mostly on the eastern side of the fault in accordance with an east-dipping reverse fault. In the southern section, and even more pronounced in the northern section (not shown in Fig. 1), the epicentral lo-cations are at some distance from the fault scarp, whereas in the central section of the fault the earthquakes occur closer to the main fault, seemingly bounded by the main fault and a west-dipping subsidiary fault. Cross sections in Lindblom et al. (2015) show that events generally tend to occur deeper to the east, although there are still too few events to see a well-defined fault zone dipping to the east, if that is the case. The dip of the zone of earthquakes is somewhere be-tween 30 and 60◦, more shallow to the north and south, and steeper in the center, as indicated by the distance between earthquakes and the fault scarp in Fig. 1. Events are recorded down to 35 km depth. Assuming that the currently active zone of earthquakes outlines the fault that ruptured 10 000 years ago, that event is estimated to have had a magnitude of 8.0±0.4 (Lindblom et al., 2015). Since 2003, no event larger
than magnitude 2.9 has been recorded along the fault, and the largest known modern event was a magnitude 3.7 in 1967.
At four locations along the main Pärvie fault, recent inves-tigations on outcrop scale of the kinematics of brittle defor-mation structures identify four paleostress fields (Bäckström et al., 2013): three of the paleostress fields are also found in other major shear zones in the area (e.g., Edfelt et al., 2006), whereas the fourth, and most recent field, seems to be unique for the Pärvie fault. This structure indicates a reverse stress field with a strike-slip component (A. Bäckström, personal communication, 2014).
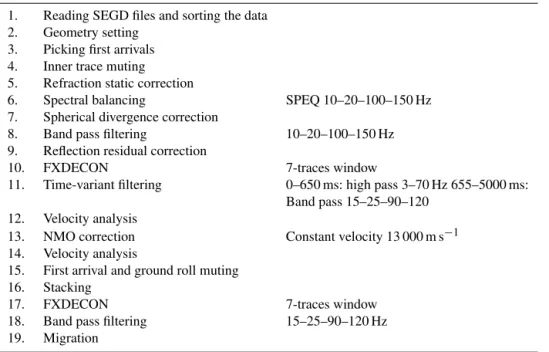
Table 2.Seismic data processing steps.
1. Reading SEGD files and sorting the data 2. Geometry setting
3. Picking first arrivals 4. Inner trace muting 5. Refraction static correction
6. Spectral balancing SPEQ 10–20–100–150 Hz 7. Spherical divergence correction
8. Band pass filtering 10–20–100–150 Hz 9. Reflection residual correction
10. FXDECON 7-traces window
11. Time-variant filtering 0–650 ms: high pass 3–70 Hz 655–5000 ms: Band pass 15–25–90–120
12. Velocity analysis
13. NMO correction Constant velocity 13 000 m s−1
14. Velocity analysis
15. First arrival and ground roll muting 16. Stacking
17. FXDECON 7-traces window
18. Band pass filtering 15–25–90–120 Hz 19. Migration
3 Seismic acquisition
Table 1 shows the acquisition parameters which were used in the seismic survey. The seismic profile was laid out al-most in the same location as the previous survey (Juhlin et al., 2010) (see Fig. 1). In order to resolve the geometry of the Pärvie fault system deeper than the previous studies (Juh-lin et al., 2010), the new seismic survey in the area was ac-quired in June 2014 using an explosive source. A number of studies in Sweden indicate that 10 kg of explosives is suf-ficient to image the crust down to Moho depths (Juhojuntti and Juhlin, 1998; Juhojuntti et al., 2001; Juhlin et al., 2002). Therefore, we used dynamite as a seismic source with a max-imum charge size of 8.34 kg in 20 m deep shot holes. In about 8 % of the shots, because of logistical problems, a minimum charge size of 2.78 kg of the explosive was used. The acqui-sition was carried out with an end-on array. To obtain good coverage for seismic imaging, each shot was repeated three times for different spreads along the profile, reusing shot holes on the repeat shots. Nominal shot spacing was 400 m, but 15 shots had to be skipped because the shot holes had collapsed after previous explosions in them. Receiver spac-ing was 25 m, with sspac-ingle 10 Hz geophones deployed durspac-ing the recording. The data were acquired with a sampling rate of 1 ms, and total recording length was 25 s, allowing us to investigate deep structures. Signal-to-noise ratios are high in the data, but the shot and receiver spacing used in the acqui-sition resulted in a sparse data set (see midpoint distribution in Fig. 2).
4 Seismic data processing
veloc-Figure 2.The seismic profile location across the Pärvie fault system. The midpoint distribution shows the sparsity of the data. Location where a weak reflection was recorded in a few shot gathers, corresponding to the main fault and receiver 105 (see Fig. 4), is marked on the map.
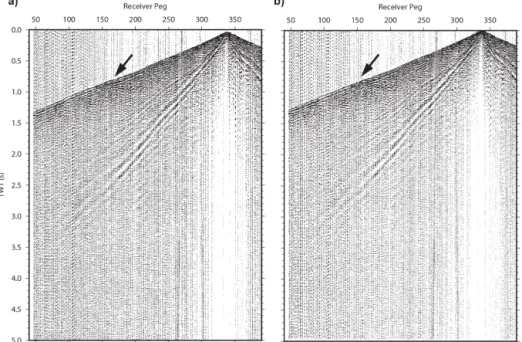
Figure 3.A shot gather(a)before refraction static correction (step 5; see Table 2) and(b)after the correction. The black arrow shows first arrivals which are improved and aligned after static correction.
ity should scale by the inverse of the cosine of the dip, the 13 000 m s−1 choice is consistent for reflections dipping at 60◦. Attempts to perform dip move-out (DMO) corrections were not successful, most likely due to the sparsity of the data and low fold in the offset gathers. To enhance the re-flections on the stacked section, a post-stack FX-decon filter, with a window length of seven traces, and a band-pass fil-ter (15–25–90–120 Hz) were applied. Finally, the reflections were migrated to their approximate true locations using the finite-difference migration method and depth-converted us-ing a variable velocity extracted from 3-D local earthquake tomography (Lindblom et al., 2015) (see Fig. 6). Further-more, to have more constraints on resolving the geometry
of the faults, we re-migrated two portions of the Juhlin et al. (2010) data using the gradient velocity model from the 3-D local earthquake tomography of Lindblom et al. (2015) (Fig.7). The seismic sections were then depth-converted with the same velocity model.
5 Interpretation
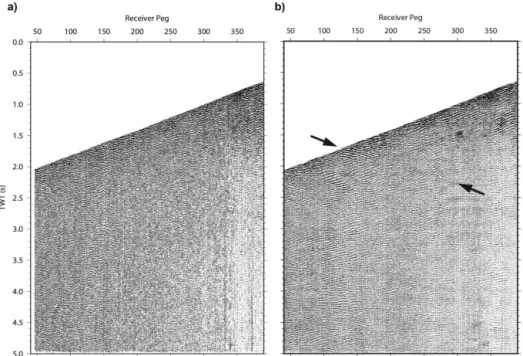
Figure 4.Application of FX-decon in pre-stack processing(a)before and(b)after FX-decon. The arrows show an enhanced reflection which is exposed at about receiver peg 105 at the surface and corresponds to the main east-dipping Pärvie fault (see the location of the receiver in Fig. 2).
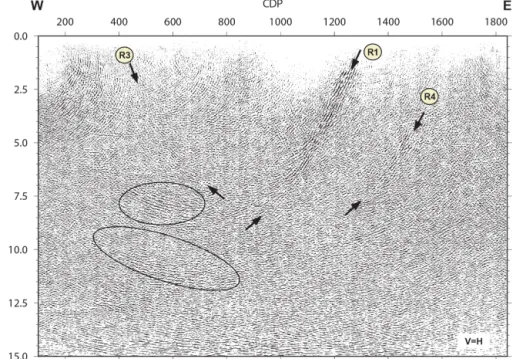
Figure 5.The NMO stacked section. Reflections R1 and R3 (shown by the arrows) correspond to the subsidiary west-dipping fault and the main Pärvie fault, respectively. Reflection R4 most likely is another west-dipping fault in the subsurface.
planar and can be traced down to a depth of about 8 km on the migrated and depth-converted section (Fig. 6). Juhlin et al. (2010) linked this strongly reflective structure to a west-dipping subsidiary fault in the Pärvie fault system (Lager-bäck and Sundh, 2008). Although weak, a trace of the main Pärvie fault was recorded and enhanced in the pre-stack and the post-stack seismic processing (Figs. 3 and 4). Figure 3 shows a shot gather in which a linear reflection has been
Figure 6.The migrated section. The reflections (shown by the arrows) were migrated to their true locations using the velocity model provided by Lindblom et al. (2015).
Figure 7.The re-migrated sections of the previous seismic survey (Juhlin et al., 2010) with the velocity model provided by Lindblom et al. (2015).(a)The image of the main Pärvie fault (R3);(b)the image of the west-dipping subsidiary fault (R1). The images show that the R1 and R3 faults (shown by the red arrows) dip at about 60 and 65◦to the west and the east, respectively. CDP numbers from the new explosive
survey are shown in bold. The vertical exaggeration is 1×.
to 7 km depth (reflection R4 in Fig. 6). A reflection corre-sponding to this feature was also observed on the previous profile (Juhlin et al., 2010) but could only be mapped down to 2–3 km depth. It was interpreted as a previously unknown end-glacial fault belonging to the Pärvie fault system, which subsequently has been identified in new lidar data (Mikko et al., 2015). Based on the re-migrated sections of the previous survey shown in Fig. 7, the true dips for reflections R1 and R3 are interpreted to be 60 and 65◦, respectively. A dip for reflection R4 was not calculated but is on the same order as
that for reflection R1, assuming that the structure generating it is close to perpendicular to the profile.
Figure 8.The bedrock geological map of the area based on Geological Survey of Sweden (SGU) database. The rectangle shows where the ultramafic rocks are exposed around the strongly reflective fault R1 (see Fig. 5).
5.1 Reflectivity of the faults
The main Pärvie fault (reflection R3) and the west-dipping reflection R1 in Figs. 5 and 6 have different reflectivity char-acteristics. The main fault is a weakly reflective structure, while the subsidiary west-dipping fault indicates the pres-ence of a strong impedance contrast. Regardless of the NMO velocity used in the correction this difference is observed. Therefore, the difference cannot be attributed to process-ing. Possible explanations for this difference include sec-ondary mineralization; varying fluid content; and pressure, anisotropy and thickness of fracture zones (Haney et al., 2007; Haugen and Schoenberg, 2000; Jones and Nur, 1982). Mineralization along a fault may increase the velocity of the rocks within the fault zone and therefore change the seismic impedance (Jones and Nur, 1982). What type of mineraliza-tion is present depends on the surrounding rocks and the al-teration processes which have occurred along the fault. Fig-ure 8 shows the rock type distribution near the Pärvie fault system. Ultramafic intrusive rocks outcrop in different loca-tions. These rocks are mostly exposed near the west-dipping fault (reflection R1) at the surface. In the area marked by the rectangle in Fig. 8 these ultramafic bodies are clearly
bounded by the fault. This suggests that the west-dipping fault cuts these ultramafic intrusions and therefore that the fault zone has a potential to be filled by secondary minerals such as silicates, phyllosilicates or calcium that crystallized during or after the post-glacial deformation. The presence of water in the fault can also speed up this process, while the water itself can decrease seismic impedance along the fault (Jones and Nur, 1982).
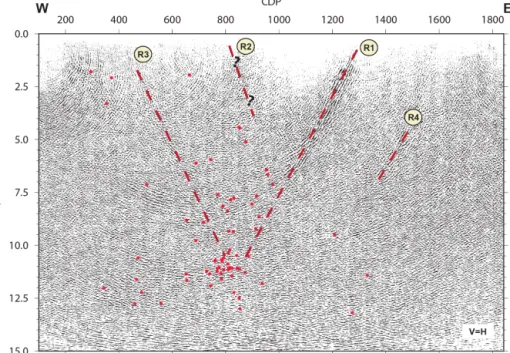
Figure 9.Cross section of the earthquakes overlaid on the interpreted migrated section. Red dashed lines depict the interpreted faults. Fault R2 was not imaged in the new seismic survey. All events within a maximum offset of 10 km perpendicular to the seismic profile to the north and south are projected onto the CDP plane. A dense cluster of seismic activity is located at a depth of about 11.5 km. The listric appearance of the R1 and R3 reflections at depth is most likely due to the migration process and not a feature of the faults. We have interpreted the faults to be planar based on the unmigrated sections.
The thickness of the west-dipping reflection which corresponds to the west-dipping fault is on the order of 500–800 m, while the R3 reflection is much thinner (Figs. 5 and 6). The greater apparent thickness may be the re-sult of increased fracturing in the subsurface due to displace-ments along an active fault. The thicker the fractured zone, the more seismic reflectivity can be observed. The thickness of the fault R1 appears to decrease with the depth (Fig. 6), suggesting that the fracture zone of the fault is larger near to the surface.
The difference between the thicknesses of the fracture zones along the faults is a possible explanation for the differ-ence between the reflectivity of the faults. However, if sec-ondary mineralization has occurred along the faults, then the fault R1 has more capacity to host the secondary minerals than the thinner R3 fault.
6 Discussion
The three steeply dipping faults are imaged down to about 7.5 km in the new data set, while Juhlin et al. (2010) showed four faults in their seismic images down to about 2–3 km. The R2 fault from Juhlin et al. (2010) has not been imaged in our seismic processing. The sparsity and low fold of the data set did not allow clear imaging of the R2 fault (Fig. 9). If the R1 and R3 faults are extrapolated with their respec-tive dips in Fig. 7, these faults converge at a depth of about
11.5 km (Fig. 9). The location of earthquakes in the area have been projected onto the migrated and depth-converted seis-mic section (red dots in Fig. 9). Only well-constrained mi-croearthquakes within an area of 400 km2, and with a max-imum offset of 10 km perpendicular to the seismic profile, are projected onto the migration plane. A denser cluster of seismic events is located below the imaged faults, suggest-ing that the intersection at 11.5 km depth of the main Pärvie fault and the west-dipping R1 fault is the source of the seis-mic activity in the area. Seisseis-micity at intersections of faults has been observed in other locations around the world (e.g., Sausse et al., 2010). The geometry of the R1 and R3 faults is uncertain below this depth. The main fault (R3) may con-tinue at a similar dip to the east, as indicated more clearly by seismicity on the northern and southern segments of the fault (Lindblom et al., 2015), or it may become listric at deeper levels. As indicated in Fig. 10, the earthquake activity below 13–14 km depth is sparse in the vicinity of the reflection pro-file and the continuation of the fault is poorly constrained by the earthquakes.
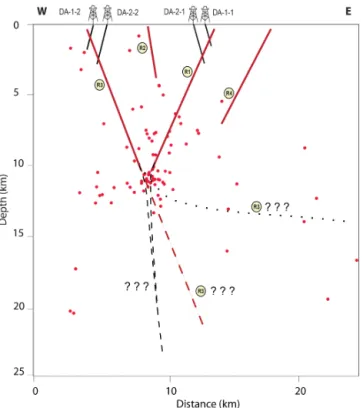
Figure 10.A simplified model of the Pärvie fault system. A larger area compared with Fig. 9 with projected earthquakes (red dots) and the location of some possible boreholes is shown. Below 8 km depth, the main fault (R3) may continue at a similar dip (shown by the red dashed line), become listric (marked by the dotted line) or form the lower part of a flower structure (marked by the black dashed lines). During the first phase of the drilling project (DAFNE), boreholes DA-1-1 and DA-1-2 will penetrate the R1 and R3 faults at about 1 km depth, respectively. Based on the result of the first phase, one deep borehole (either DA-2-1 or DA-2-2) will be chosen to drill into R1 or R3 at a depth of about 2.5 km.
agreement with a listric or generally east-dipping fault struc-ture. In addition, the seismicity in the northern and south-ern sections of the fault does not support a fault-wide flower structure but rather an east-dipping fault zone (Lindblom et al., 2015).
This paper provides critical site survey information for the DAFNE ICDP drilling proposal. The difference in reflectiv-ity for the reflectors R1 and R3 has strongly influenced the drilling plan. Originally it was planned to drill a series of boreholes into the main fault at ever-increasing depth down to 2.5 km (Fig. 10). Drilling is now planned to be executed in two phases, with the first phase consisting of drilling two 1 km deep boreholes into the reflectors R1 and R3 and then conducting borehole logging, in situ testing, installing bore-hole seismometers for monitoring seismicity and other pro-cesses along the faults. Other sensors to monitor variation of various parameters such as pore pressure, temperature and water geochemistry over time will also be installed. Based on the results from the first two boreholes, a deeper borehole
to 2.5 km will be drilled into one of the faults (Fig. 10). Bore-hole logging, in situ testing and monitoring will be conducted in the deeper borehole as well. The time-series data are antic-ipated to yield a better understanding of the dynamics of the Pärvie fault system, as well as allow for comparisons with other fault-zone drilling projects worldwide. Combined re-processing of the two surveys with 3-D swath imaging (e.g., Malehmir et al., 2009) may also help in determining the op-timum location for the deep borehole in phase two.
7 Conclusions
The Pärvie fault system was activated during the last glacial retreat in northern Sweden. In order to better understand the geometry of the faults, we carried out a deep seismic survey using dynamite as an explosive source. Although the acquisi-tion parameters resulted in a sparse data set, the quality of the data in terms of signal-to-noise ratio was good, due to the use of an explosive source. The data were processed following a conventional CDP processing method down to 5 s along a straight line. Three reflections, corresponding to three steeply dipping faults and some sub-horizontal reflections were im-aged. The reflections were migrated to their approximate true locations using the finite-difference migration method with a velocity model extracted from the 3-D local seismic net-work tomography and were traced down to a depth of about 7.5 km. Although weak, the main Pärvie fault is imaged dip-ping at approximately 65◦to the east. A subsidiary, 60◦ west-dipping fault is significantly more reflective. We interpret the subsidiary west-dipping fault as consisting of a thicker frac-ture zone than the main Pärvie fault, explaining the differ-ence in the reflectivity of the faults. Alternatively, the faults can have similar thickness, but the impedance contrast to the host rock may be greater for R1 than R3. Recent earthquakes cluster at a depth of about 11.5 km. The location and depth of the earthquake epicenters are consistent with the intersection of the main fault and the subsidiary fault at depth, assuming the faults are planar. The new seismic survey provides infor-mation on the structure of the fault system down to approx-imately 8 km. Below that depth the main fault may continue at a similar dip, become listric or form the lower part of a flower structure. Current microearthquakes tend to favor the former two.
Technology, and F. Zhang and I. Lydersen from Uppsala University. Special thanks are given to H. Palm (HasSeis), without whom this study would not have been possible. GLOBE Claritas™ under license from the Institute of Geological and Nuclear Sciences Limited, Lower Hutt, New Zealand, was used to process the seismic data. The seismic plots were generated using GMT. Quantum GIS was used to produce the maps. The authors would like to acknowledge Juan Alcalde and one anonymous reviewer for their constructive comments. Hemin Koyi is sincerely thanked for his valuable discussion on the interpretation of the seismic data.
Edited by: H. Thybo
References
Arvidsson, R.: Fennoscandian Earthquakes: Whole Crustal Rup-turing Related to Postglacial Rebound, Science, 274, 744–746, doi:10.1126/science.274.5288.744, 1996.
Bäckstrom, A., Viola, G., Rantakokko, N., Jonsson, E., and Ask, M.: Preliminary results from fault-slip analysis of the Pärvie neo-tectonic postglacial fault zone, northern Sweden, Geophysical Research Abstracts, Vol. 15, EGU2013-1751, 2013.
Bödvarsson, R. and Lund, B.: The SIL Seismological data Acquisi-tion System -as Operated in Iceland and in Sweden, in Methods and Applications of Signal Processing in Seismic Network Op-erations, eds. Takanami, T. and Kitagawa, G., Lecture Notes in Earth Sciences, 98, Springer, Berlin, 131–148, 2003.
Bungum, H. and Lindholm, C.: Seismo- and neotectonics in Finn-mark, Kola and the southern Barents Sea, part 2: Seismologi-cal analysis and seismotectonics, Tectonophysics, 270, 15–28, doi:10.1016/S0040-1951(96)00139-4, 1997.
Edfelt, Å., Sandrin, A., Evins, P., Jeffries, T., Storey, C., Elm-ing, S.-Å, and Martinsson, O.: Stratigraphy and tectonic set-ting of the host rocks to the Tjårrojåkka Fe-oxide Cu-Au de-posits, Kiruna area, northern Sweden, GFF, 128, 221–232, doi:10.1080/11035890601283221, 2006.
Gregersen, S.: Crustal stress regime in Fennoscandia from focal mechanisms, J. Geophys. Res., 97, 11821–11827, doi:10.1029/91JB02011, 1992.
Haney, M., Snieder, R., Ampuero, J.-P. and Hofmann, R.: Spec-tral element modelling of fault-plane reflections arising from fluid pressure distributions, Geophys. J. Int., 170, 933–951, doi:10.1111/j.1365-246X.2007.03437.x, 2007.
Haugen, G. U. and Schoenberg, M. A.: The echo of a fault or frac-ture, Geophysics, 65, 176–189, doi:10.1190/1.1444708, 2000. Heidbach, O., Tingay, M., Barth, A., Reinecker, J., Kurfeß, D.,
and Müller, B.: The World Stress Map database release 2008, doi:10.1594/GFZ.WSM.Rel2008, 2008.
Jones, T. and Nur, A.: Seismic velocity and anisotropy in mylonites and the reflectivity of deep crustal fault zones, Geology, 10, 260– 263, doi:10.1130/0091-7613(1982)10<260:SVAAIM>2.0.CO;2, 1982.
Juhlin, C. and Lund, B.: Reflection seismic studies over the end-glacial Burträsk fault, Skellefteå, Sweden, Solid Earth, 2, 9–16, doi:10.5194/se-2-9-2011, 2011.
Juhlin C., Elming S.-Å., Mellqvist C., Öhlander B., Weihed P., and Wikström A.: 2002, Onshore crustal reflectivity of the
Archaean-Proterozoic boundary and comparison with BABEL Lines 2 and 3, northern Sweden, Geophysical J. Int., 150, 180–197, 2002. Juhlin, C., Dehghannejad, M., Lund, B., Malehmir, A., and Pratt,
G.: Reflection seismic imaging of the end-glacial Pärvie Fault system, northern Sweden, J. Appl. Geophys., 70, 307–316, doi:10.1016/j.jappgeo.2009.06.004, 2010.
Juhojuntti, N. and Juhlin, C.: Seismic lower crustal reflectivity and signal penetration in the Siljan Ring area, central Sweden, Tectonophysics, 288, 17–30, 1998.
Juhojuntti, N., Juhlin, C. and Dyrelius, D.: Crustal reflectivity un-derneath the Central Scandinavian Caledonides, Tectonophysics, 334, 191–210, doi:10.1016/S0040-1951(00)00292-4, 2001. Kuivamäki, A., Vuorela, P., and Paananen, M.: Indications of
post-glacial and recent bedrock movements in Finland and Russian Karelia (Tech. Rep. No. YST-99). Helsinki, Finland: Geological Survey of Finland, 1998.
Kukkonen, I. T., Olesen, O., Ask, M. V. S. and the PFDP WORKING GROUP: Postglacial Faults in Fennoscan-dia: Targets for scientific drilling, GFF, 132, 71–81, doi:10.1080/11035891003692934, 2010.
Kukkonen, I. T., Ask, M. V. S., and Olesen, O.: Postglacial Fault Drilling in Northern Europe: Workshop in Skokloster, Sweden, Sci. Dril., 11, 56–59, doi:10.5194/sd-11-56-2011, 2011. Lagerbäck, R.: Neotectonic structures in northern Sweden,
Geol-ogiska Föreningen i Stockholm Förhandlingar, 100, 263–269, doi:10.1080/11035897809452533, 1978.
Lagerbäck, R. and Sundh, M.: Early Holocene Faulting and Pale-oseismicity in Northern Sweden, Geological Survey of Sweden, 2008.
Lindblom, E. and Lund, B.: Focal mechanisms and the state of stress along the Pärvie end-glacial fault, northern Sweden, in: Microearthquake study of end-glacial faults in northern Sweden, edited by: Lindblom, E., Licentiate theses, Uppsala University, Uppsala, Sweden, 2011.
Lindblom, E., Lund, B., Tryggvason, A., Uski, M., Bödvarsson, R., Juhlin, C. and Roberts, R.: Microearthquakes illuminate the deep structure of the endglacial Pärvie fault, northern Sweden, Geo-phys. J. Int., 201, 1704–1716, doi:10.1093/gji/ggv112, 2015. Lund, B. and Zoback, M. D.: Orientation and magnitude of in situ
stress to 6.5 km depth in the Baltic Shield, Int. J. Rock. Mech. Min., 36, 169–190, doi:10.1016/S0148-9062(98)00183-1, 1999. Lund, B., P. Schmidt, and C. Hieronymus: Stress evolution and fault stability during the Weichselian glacial cycle, TR-09-15, Swedish Nuclear Fuel and Waste Management Co. (SKB), Stockholm, Sweden, 106 pp, 2009.
Malehmir, A., Schmelzbach, C., Bongajum, E., Bellefleur, G., Juh-lin, C., and Tryggvason, A.: 3-D constraints on a possible deep > 2.5 km massive sulphide mineralization from 2D crooked-line seismic reflection data in the Kristineberg mining area, northern Sweden, Tectonophysics, 479, 223–240, 2009.
Mantovani, M. and Scherneck, H.-G.: DInSAR investigation in the Pärvie endglacial fault region, Lapland, Sweden, Int. J. Remote Sens., 34, 8491–8502, 2013.
Mikko, H., Smith, C.A, Lund, B., Ask, M., and Munier, R.: LiDAR-derived inventory of post-glacial fault scarps in Sweden, GFF, doi:10.1080/11035897.2015.1036360, 2015.
Olesen, O., Blikra, L., Braathen, A., Dehls, J., Olsen, L., Rise, L., Roberts, D., Riis, F., Faleide, J., and Anda, E.: Neotectonic defor-mation in Norway and its implications: a review, Norw. J. Geol., 84, 3–34, 2004.
Pascal, C., Stewart, I. S., and Vermeersen, B. L. A.: Neotectonics, seismicity and stress in glaciated regions, J. Geol. Soc. London, 167, 361–362, doi:10.1144/0016-76492009-170, 2010. Riad, L.: The Pärvie fault, Northern Sweden, Uppsala University,
Mineralogy Department of Mineralogy and Petrology, UUDMP Research report 63, 71 pp, 1990.
Sausse, J., Dezayes, C., Dorbath, L., Genter, A., and Place, J.: 3-D model of fracture zones at Soultz-sous-Forêts based on geological data, image logs, induced microseismicity and vertical seismic profiles, C. R. Geosci., 342, 531–545, doi:10.1016/j.crte.2010.01.011, 2010.
Slunga, R. S.: The Baltic Shield earthquakes, Tectonophysics, 189, 323–331, doi:10.1016/0040-1951(91)90505-M, 1991.