1Centro Universitário Hermínio Ometto, Programa de Pós-Graduação em Ciências Biomédicas. Av. Dr. Maximiliano Baruto, 500, Jd. Universitário, 13607-339, Araras, SP, Brasil. Correspondência para/Correspondence to: MEC AMARAL. E-mail: <[email protected]>.
2Universidade Estadual de Campinas, Faculdade de Ciências Médicas,Departamento de Enfermagem. Campinas, SP, Brasil.
Polymorphism in the SIRT1 gene and
parameters of metabolic syndrome
in a sample of the adult
Brazilian population
Estudo de polimorfismo no gene SIRT1
e parâmetros da síndrome metabólica
em uma amostra da população
brasileira adulta
Marina Veloso de Oliveira MENEGUETTE1
Camila Andréa de OLIVEIRA1
Maria Helena de Melo LIMA2
Kathleen Nicole PINA1
Maria Esméria Corezola do AMARAL1
A B S T R A C T
Objective
To evaluate whether the single nucleotide polymorphism rs7895833 (A/G) of the gene SIRT1 is associated with metabolic syndrome criteria in a sample of Brazilian adults.
Methods
Serum samples and oral mucosal cells were collected from 243 subjects aged 30 to 70 years. Biochemical, hormonal, and anthropometric data were obtained. The single nucleotide polymorphism rs7895833 (A/G) was analyzed by polymerase chain reaction using the amplification refractory mutation system.
Results
Blood glucose, total cholesterol, triglycerides, very low density lipoprotein, low density lipoprotein, waist and hip circumferences, and blood pressure were higher in the metabolic syndrome group than in the non-metabolic syndrome group. Free thyroxine 4, grown hormone, and insulin levels were within the normal range. The metabolic conditions of the patients with metabolic syndrome indicate biochemical, anthropometric, and hormonal changes characteristic of overweight and obesity.
Conclusion
The SIRT1 polymorphism rs7895833 (A/G) is not associated with the metabolic syndrome in the adult Brazilian population.
Keywords: Body mass index. Metabolic syndrome. Obesity. Polymorphism, single nucleotide. Sirtuin 1.
R E S U M O
Objetivo
Avaliar se o polimorfismo de nucleotídeo único rs7895833 (A/G) do gene SIRT1 está associado à síndrome metabólica em uma amostra da população brasileira. Foram coletadas, de 243 indivíduos com idades entre 30 e 70 anos, amostras de soro e de células da mucosa bucal.
Métodos
Dosagens bioquímicas, hormonais e dados antropométricos foram analisados. O polimorfismo de nucleotídeo único rs7895833 (A/G) foi analisado por sistema de amplificação de mutação por refração - reação em cadeia da polimerase.
Resultados
Entre os 243 indivíduos estudados, 100 (41,15%) foram classificados como não apresentando síndrome meta-bólica e 143 (58,85%) como apresentando a síndrome. Não houve diferença significativa na frequência do polimorfismo de nucleotídeo único rs7895833 (A/G) entre os grupos. No entanto, 111 pacientes (45,67%) estavam com sobrepeso (índice de massa corporal: 25-29,9 kg/m2). Glicose, colesterol total, triglicerídeos,
lipoproteínas de muito baixa densidade, lipoproteínas de baixa densidade, circunferência da cintura e do quadril e pressão arterial foram maiores no grupo com síndrome metabólica quando comparado ao outro grupo. Tiroxina 4 livre, hormônio do crescimento e os níveis de insulina estavam no valor de referência. As condições metabólicas dos pacientes com síndrome metabólica indicam alterações bioquímicas, antropométricas e hormonais características do excesso de peso e da obesidade.
Conclusão
Sugerimos que o polimorfismo rs7895833 (A/G), no gene SIRT1, não esteja associado à síndrome metabólica na população adulta brasileira.
Palavras-chave: Índice de massa corporal. Síndrome metabólica. Obesidade. Polimorfismo de nucleotídeo único. Sirtuína 1.
I N T R O D U C T I O N
Changes in lifestyle habits, physical inactivity, eating habits, and genetic predisposition can lead to metabolic changes that increase the incidence of age-related diseases, such as obesity, diabetes, and hypertension, culminating in a condition called Metabolic Syndrome (MetS). The term MetS associates a set of metabolic abnormalities related to a higher susceptibility to type 2 diabetes and cardiovascular disease1. According to the National Cholesterol Education
In humans, calorie restriction seems to reduce the incidence of age-related diseases like diabetes, hypertension, and obesity by promoting lower insulin levels, which are associated with higher peripheral insulin sensitivity and lower concentrations of triiodothyronine 3 as a result of lower energy metabolism4-6. The idea that calorie restriction can extend human life is inconclusive, but many of its effects are attributed to the Silent Mating Type Information Regulation Gene (SIRT1). SIRT1 is Nicotinamide Adenine Dinucleotide (NAD+)-dependent histone deacetylases conserved in evolution from bacteria to humans. SIRT1 is related to metabolism, specifically in endocrine signaling and longevity7. Humans have 7 sirtuins8, and SIRT1 has been most studied. Resveratrol, a natural SIRT1 agonist present in red wine and grapes, has been shown to prevent obesity and diet-induced peripheral insulin resistance in rodents, increasing longevity9,10. Studies are directed to SIRT1 agonists for the treatment of obesity and diabetes type 2. SIRT1 also has important endocrine action in glucose and lipid metabolism11,12. However, in addition to the weight loss effect, there is concern that activation of SIRT1 in all tissues may have undesirable effects. Some human studies have demonstrated a positive association between lower Body Mass Index (BMI) and variants of the SIRT1 gene, but the results differ between different populations13-20. Although the genetic variants of the SIRT1 gene are related to lower BMI and obesity reduction, the aim of this study was to investigate the association between the Single Nucleotide Polymorphism (SNP) rs7895833 of the SIRT1 gene and MetS. BMI, serum insulin level, Grown Hormone (GH), and free thyroxine 4 were analyzed for characterizing the sample.
M E T H O D S
The study was approved by the Ethics Committee of Centro Universitário Hermínio Ometto (Process nº 601/2010). A cross-sectional study was conducted with 243 adults aged 30 to
70 years recruited at the Municipal Laboratory of the town of Tietê, São Paulo, Brazil. The subjects were selected after they had received detailed information about the objective of the study and signed the informed consent form. The participants were divided into subjects without (non-MetS) and with MetS, according to the following criteria: a) non-MetS: active adults without any underlying disease (healthy); b) MetS: obese, hypertensive, and inactive adults with type 2 diabetes Mellitus (using or not antidiabetic agents according to the National Cholesterol Education Program Adult Treatment Panel III [NCEP ATP III] criteria). Subjects who had congenital diseases, cancers, and/or other diseases were excluded from the study.
Anthropometric, biochemical, and hormonal analyses
Anthropometric data were collected according to the World Health Organization21 (WHO) guidelines. Each parameter was measured three times, and the mean was used for analysis. Body weight was measured by a portable microelectronic scale (capacity of 150 kg - Filizola,
Waist Circumference (WC) was measured with the subject standing, abdomen relaxed, arms hanging loosely at sides, and feet together. The measurement was made to the nearest 0.1 cm using a flexible non-elastic tape measure without exerting pressure at the lower curvature, between the lower costal margin and iliac crest. When the lower curvature could not be identified, the measurement was made 2 cm over the umbilical scar. Hip circumference was measured to the nearest 0.1 cm using a non-elastic tape measure placed around the widest point of the subject’s buttocks without compressing the soft tissues. The Waist-to-Hip Ratio (WHR) was calculated using the equation WHR=WC/HC and classified according to the WHO21 recommendations.
Blood samples (10 mL) were collected using a vacuum system, preferentially from the forearm, between 7:00 and 9:00 a.m., after a 10-12-h fast. T10-12-he material was separated immediately by centrifugation into appropriately identified test tubes for the determination of total serum cholesterol, HDL-c, triglycerides, Low-Density Lipoprotein cholesterol (LDL-c), Very Low-Density Lipoprotein cholesterol (VLDL-c), insulin, free thyroxine 4, GH, and fasting blood glucose. The LDL-c and VLDL-c fractions were calculated using the formula of Friedewald et al.22.
The reagents for the biochemical tests were purchased from Labtest Diagnostica SA (Lagoa Santa, Minas Gerais, Brazil). Hormone analysis was performed using commercially available ELISA kits (BioCheck, Inc., Foster City, California, United States) for GH and free thyroxine 4 and a kit from Orgentec Diagnostika (Germany) for insulin.
Blood pressure was measured by a sphygmomanometer (0 to 300 mmHg) with appropriate cuffs to the nearest +3 mmHg (Welch Allyn - Tycos, United States). Two measurements were made at an interval of 2 minutes, and the mean was calculated. The technical requirements and definition of the cut-off for the classification of MetS and non-MetS established by the NCEP ATP III2 were used.
Metabolic syndrome was defined by the following characteristics: waist circumference >102 cm for men, and >88 cm for women; triglycerides >150 mg/dL for both; HDL-c <40 mg/dL for men, and <50 mg/dL for women; fasting glucose >100 mg/dL for both; systolic blood pressure >130 mmHg, and diastolic blood pressure >85 mmHg for both.
DNA extraction and genotyping
Samples of oral epithelial cells were obtained by a Cytobrush and immediately stored in 1 mL of 0.9% saline at -20oC until the genomic DNA extraction. For DNA extraction, the samples were centrifuged at 13,000 rpm for 10 minutes, and the supernatant was discarded. Next, the cells were lysed by the addition of 600 µL of 50 mM NaOH, followed by heating to 95oC for 5 minutes and pH neutralization with 1 M Tris-HCl (2-Amino-2-Methylol-1,3-Propanediol) - hydrochloric acid), pH 8.0. The extracted DNA was stored at -20oC for further analysis.
Genotyping of the rs7895833 (A/G) polymorphism was performed in 200 subjects (100 MetS and 100 non-MetS) by Polymerase Chain Reaction using the Amplification Refractory Mutation System (PCR-ARMS), 43 samples were excluded because they were not amplified. The primers were designed using the Gene Runner software, version 3.05 (Hastings Software, Inc., San Francisco, California, United States). A common reverse primer (5’-CATCTGTGTATCCCC TAGAAAGT-3’) and two forward allele-specific primers that amplify two allele-specific regions were used: A allele - 5’-GGTGGTAAAAGGCCTA CAGGACA-3’, and G allele - 5’-GGTGGTAAAAG GCCTACAGGACG-3’ (299-bp amplicon). Control primers were used for single nucleotide polymerase co-amplification of a portion of the β-globin gene23. These primers served as an internal amplification control.
DNA, 167 µM of each Deoxyribonucleotide Triphosphate (dNTP), 0.3 pmol of each primer (Common, A allele and G allele) and 0.6 pmol of each control primer, 1.3 mM of MgCl2, 0.01% bovine serum albumin, and 0.03 U Taq DNA polymerase (Biotools, Madrid, Spain) were mixed in a final volume of 30 µL. The amplification conditions were initial denaturation at 94oC for 5 minutes, followed by 30 cycles of denaturation at 94oC for 45 seconds, annealing at 60oC for 45 seconds, and extension at 72oC for 45 seconds.
Approximately 10% of the samples were re-genotyped for cross-validation by Restriction Fragment Length Polymorphism (RFLP)-PCR using the restriction enzyme Hinc II (Invitrogen, Carlsbad, California, United States). All DNA amplicons and fragments were analyzed by 1.5% agarose gel electrophoresis and stained by ethidium bromide. The gel was photographed using the Kodak Electrophoresis Documentation and Analysis System (EDAS) 290 (Rochester, New York, United States).
Statistical analysis
Categorical variables are reported as absolute (n) and relative (%) frequencies, and continuous variables, as mean and standard error of the mean. The Mann-Whitney test compared continuous related variables between the groups. A significance level of 5% was adopted. The statistical analyses were performed by the software GraphPad Prism 3.0 (La Jolla, California, United States).
For single nucleotide polymorphism analysis, the Hardy-Weinberg equilibrium was
calculated using the software BioEstat (Instituto de Desenvolvimento Sustentável Mamirauá, Tefé,
Amazonas, Brazil) 5.0. Genotype and allele frequencies were compared between the MetS and non-MetS groups using the Pearson’s Chi-square test and odds ratios calculated by univariate logistic regression under a dominant, recessive, and additive model18.
R E S U L T S
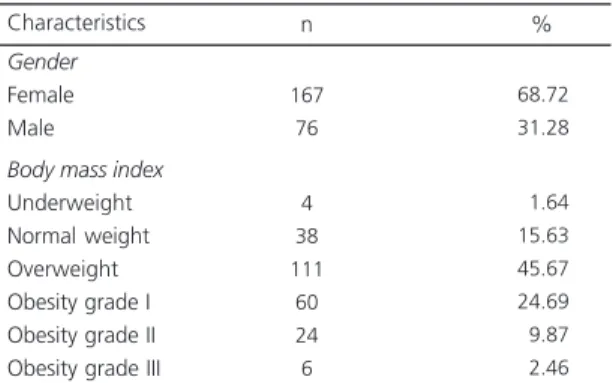
Among the 243 study adults, 100 were classified as non-MetS and 143 as MetS. Most subjects were females (167/243; 68.72%) and overweight according to BMI (111/243; 45.67%) (Tables 1 and 2). The MetS group had 96 women (67.14%) and 47 men (32.86%), and the non-MetS group had 71 women (71.00%) and 29 men (29.00%).
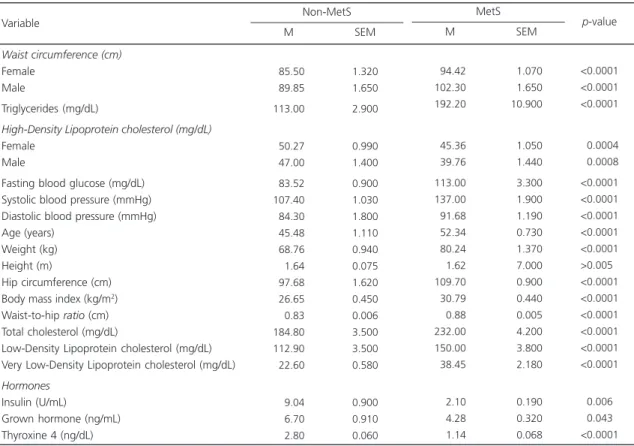
Table 3 shows the sample’s classification into non-MetS and MetS according to the NCEP ATP III criteria. All study parameters were higher in the MetS group than in the non-MetS group, except for hormones. Still, the levels of insulin
Table 1. Characteristics of the sample (N=243).
Gender
Female Male
Body mass index
Underweight Normal weight Overweight Obesity grade I Obesity grade II Obesity grade III
167 76
4 38 111 60 24 6
68.72 31.28
01.64 15.63 45.67 24.69
09.87
02.46
Characteristics n %
Table 2. Distribution of Body Mass Index (BMI) in subjects with Metabolic Syndrome (MetS) and without (non-MetS).
≤18.5 18.5 to 24.9 25.0 to 29.9 30.0 to 34.9 35.0 to 39.9
≥40.0 BMI
Underweight Normal weight Overweight Obesity grade I Obesity grade II Obesity grade III
Classification
4 34 42 12 8 0 Non-MetS %
4 34 42 12 8 0
00.00
02.79 48.28 33.56 11.18
04.19
0 4 69 48 16 6
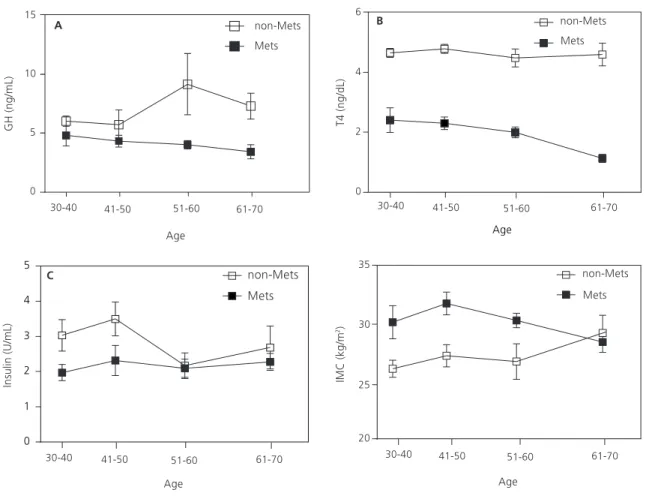
(reference value: <10 U/mL), GH (≤7 ng/mL), and free thyroxine 4 (0.8-2.0 ng/dL) were within the normal range in subjects with MetS. Figure 1 shows that the age-related decline in GH (Figure 1A) and free thyroxine 4 (Figure 1B) were more pronounced in subjects with MetS. In contrast, insulin remained constant with age in the MetS group and decreased in the non-MetS group (Figure 1C). BMI decreased with age in the MetS group and increased with age in the non-MetS group (Figure 1D).
The single nucleotide polymorphism rs7895833 (A/G) has a minor allele frequency of 0.28 in the Brazilian population. The single nucleotide polymorphism followed the Hardy-Weinberg equilibrium proportions in the two groups (p<0.05). The genotype distribution of the rs7895833 (A/G) variant between the MetS and non-MetS groups (χ2=2.87 degree of freedom=2,
p=0.24) did not differ, and the odds ratio also did
not indicate any significant difference between the groups (Table 4).
D I S C U S S I O N
Our data suggest that the allelic and genotypic distribution of the SIRT1 single nucleotide polymorphism rs7895833 (A/G) is not associated with MetS. Recent studies indicated that the single nucleotide polymorphism of the SIRT1 gene is associated with a reduction in body fat, BMI, and blood pressure19,24-26. Another study has shown that individuals carrying the minor allele of SIRT1 SNP rs12778366 had better glucose tolerance27. Yang et al.28 suggested that low arterial expression of SIRT1 plays a role in the onset and development of diabetic atherosclerosis in animals. In humans, SIRT1 is an important genetic factor that has been associated with fetal malnutrition and the risk of developing type 2
Table 3. Comparison of subjects with Metabolic Syndrome (MetS) and without (non-MetS) the regarding their anthropometric,
biochemical, and metabolic parameters.
Waist circumference (cm)
Female Male
Triglycerides (mg/dL)
High-Density Lipoprotein cholesterol (mg/dL)
Female Male
Fasting blood glucose (mg/dL) Systolic blood pressure (mmHg) Diastolic blood pressure (mmHg) Age (years)
Weight (kg) Height (m)
Hip circumference (cm) Body mass index (kg/m2)
Waist-to-hip ratio (cm) Total cholesterol (mg/dL)
Low-Density Lipoprotein cholesterol (mg/dL) Very Low-Density Lipoprotein cholesterol (mg/dL)
Hormones
Insulin (U/mL)
Grown hormone (ng/mL) Thyroxine 4 (ng/dL)
Variable Non-MetS 085.50 089.85 113.00 050.27 047.00 083.52 107.40 084.30 045.48 068.76 001.64 097.68 026.65 000.83 184.80 112.90 022.60 009.04 006.70 002.80 1.320 1.650 2.900 0.990 1.400 0.900 1.030 1.800 1.110 0.940 0.075 1.620 0.450 0.006 3.500 3.500 0.580 0.900 0.910 0.060 M SEM MetS 094.42 102.30 192.20 045.36 039.76 113.00 137.00 091.68 052.34 080.24 001.62 109.70 030.79 000.88 232.00 150.00 038.45 002.10 004.28 001.14 01.070 01.650 10.900 01.050 01.440 03.300 01.900 01.190 00.730 01.370 07.000 00.900 00.440 00.005 04.200 03.800 02.180 00.190 00.320 00.068 M SEM <0.0001 <0.0001 <0.0001 <0.0004 <0.0008 <0.0001 <0.0001 <0.0001 <0.0001 <0.0001 >0.0050 <0.0001 <0.0001 <0.0001 <0.0001 <0.0001 <0.0001
<0.0060 <0.0430 <0.0001
p-value
diabetes29. This study showed the interaction between SIRT1 SNPs (rs7895833 - A/G and rs1467568 - A/G) and exposure to famine in utero on type 2 diabetes risk. Minor alleles of these SNPs were associated with a lower prevalence of type 2 diabetes only in individuals who had been exposed to famine prenatally29. As reported by
Kilic et al.30, no association has been found between the SNP rs7895833 A/G and risk of cardiovascular diseases in Turkish patients. A study in Pima Indians showed that the SIRT1 SNP rs7895833 (A/G) was not associated with low insulin secretion and high risk for developing type 2 diabetes13. In contrast a Japanese study
Table 4. Effects of the single nucleotide polymorphism rs7895833 (A/G) of the gene SIRT1 in subjects with the Metabolic Syndrome
(MetS) and without (non-MetS).
A/A A/G G/G MAF Genotype
52 (52%) 40 (42%) 8 (8%)
0.28
50 (50%) 47 (47%) 3 (3%)
0.265
0.24 p=0.74; OR=0.93 (95%CI=0.60-1.44)
p=0.89; OR=1.08 (95%CI=0.62-1.89)
p=0.21; OR=0.36 (95%CI=0.09-1.38)
Recessive model AA+AG versus GG Dominant model
AA versus AG+GG Allelic OR
AA+AG+GG
p
MetS (n=100) Non-MetS
(n=100)
Note: n: The number of non-MetS and MetS subjects is given for each genotype group.
OR: Odds Ratio; 95%CI: 95% Confidence Interval; MAF: Minor Allele Frequency (G).
Figure 1. Plasma concentrations of Growth Hormone (GH) (A), free Thyroxine 4 (B), and insulin (C), and Body Mass Index (BMI) (D) as a function of age. Results are reported as mean and standard error of the mean (n=100 to 143 subjects).
χ2
demonstrated that the A allele of rs789533 is related to obesity18.
In our study women had a higher prevalence of this syndrome. This finding might be attributed to the decline in female hormones, menopause, and changes in anthropometric measures since none of the participants was undergoing hormone replacement therapy31. The loss of estrogen results in the accumulation of central fat and is associated with the occurrence of MetS32,33
Furthermore, the MetS group had low insulin, GH, and free thyroxine 4 levels, unlike the non-MetS group. Although the levels of these hormones were within the normal range, hormone reductions are supported by the literature. The metabolic syndrome is directly related to a decrease in pancreatic β-cells and muscle glucose transporters, reducing glucose-induced insulin secretion and increasing peripheral insulin resistance34. In contrast, reduction of adipose tissue has been shown to increase insulin sensitivity and glucose tolerance35. With respect to grown hormone, literature data show that this hormone favorably alters the obesity profile, reducing abdominal and visceral obesity, increasing insulin sensitivity, and benefitting lipoprotein metabolism and diastolic blood pressure36-39. The present results agree with these reports since the MetS group had lower plasma GH concentrations than the non-MetS group. Regarding the effects of obesity on thyroid hormones, hypothyroidism is generally associated with some weight gain, although Douyon & Schteingart40 observed hypothyroidism in less than 10% of obese subjects. Evidence indicates the existence of a polymorphism in the gene encoding deiodinase type 2, the enzyme responsible for the conversion of thyroxine 4 into triiodothyronine 3, which is associated with insulin resistance41,42.
In addition, changes in this SNP seem to be modulated by dietary factors, but the study sample’s diet was not analyzed. There is evidence of other genes related to weight loss associated with dietary intervention43.
The simple classification of subjects into MetS and non-MetS may permit treatment of
syndrome parameters through lifestyle changes, such as better dietary habits and physical activity. The findings of high cholesterol, triglycerides, and waist circumference and low insulin, GH and free thyroxine 4 in subjects with MetS, as well as the similarity in SIRT1 SNP distribution between the two groups, characterize overweight and obesity in the study subjects. These results suggest the emergence of an increasingly obese population predisposed to diseases and highlights the need of improving dietary habits and physical activity in order to prevent future diseases. In conclusion genetic variation in SIRT1 was studied for the first time in the Brazilian population, but more complex studies are needed.
The study strength is its pioneering investigation of the SIRT1 gene in Brazilian adults. The study is an attempt to identify SIRT1 polymorphisms as potential therapeutic targets. The major limitation of the study is the number of participants and use of a regional population (from Tietê, São Paulo), which does not allow extrapolation to other Brazilian regions.
A C K N O W L E D G E M E N T S
The authors thank Elisabete Maria Zanete Duran, technician of the Tietê Municipal Laboratory, for the technical assistance. This work was sponsored by Fundação Hermínio Ometto.
C O N T R I B U T O R S
MVO MENEGUETTE collected the samples, performed the biochemical, anthropometric, and hormonal analyses, and wrote the manuscript; MHML wrote the manuscript; KN PINA performed the SNP analyses; CA OLIVEIRA analyzed the SNP results and wrote the manuscript; and MEC AMARAL participated in the design of the study and wrote the manuscript.
R E F E R E N C E S
2. National Heart, Lung and Blood Institute. Executive Summary of the Third Report of the National Cholesterol Education Program (NCEP) Expert Panel on detection, evolution and treatment of high blood cholesterol. JAMA. 2005; 285(19):2486-97. 3. Barzilai N, Bartke A. Biological approaches to mechanistically understand the healthy life Span extension achieved by calorie restriction and modulation of hormones. J Gerontol Biol Sci. 2009; 2(12):187-91. http://dx.doi.org/10.1093/gerona/ gln061
4. Masoro EJ. Overview of the effects of food restriction. Prog Clin Biol Res. 1989; 287:27-35. 5. Berner YN, Stern F. Energy restriction controls aging
through neuroendocrine signal transduction. Ageing Res Rev. 2004; 3(2):189-98. http://dx.doi. org/10.1016/j.arr.2003.10.004
6. Holloszy JO, Fontana L. Caloric restriction in humans. Exp Gerontol. 2007; 42(8):709-12. http:// dx.doi.org/10.1016/j.exger.2007.03.009
7. Chen D, Bruno J, Easlon E, Lin SJ, Cheng HL, Alt FW, et al. Tissue-specific regulation of SIRT1 by calorie restriction. Genes Dev. 2008; 22(13):1753-7. http://dx.doi.org/10.1101/gad.1650608
8. Frye RA. Phylogenetic classification of prokaryotic and eukaryotic Sir2-like proteins. Biochem Biophys Res Commun. 2000; 273(2):793-8. http://dx. doi.org/10.1006/bbrc.2000.3000
9. Baur JA, Pearson KJ, Price NL, Jamieson HA, Lerin C, Kalra A, et al. Resveratrol improves health and survival of mice on a high-calorie diet. Nature. 2006; 444(7117):337-42. http://dx.doi.org/10.1038/ nature05354
10. Lagouge M, Argmann C, Gerhart-Hines Z, Meziane H, Lerin C, Daussin F, et al. Resveratrol improves mitochondrial function and protects against metabolic disease by activating SIRT1 and PGC-1alpha. Cell. 2006; 127(16):1109-22. http://dx.doi. org/10.1016/j.cell.2006.11.013
11. Picard F, Kurtev M, Chung N, Topark-Ngarm A, Senawong T, Machado de Oliveira R, et al. Sirt1 promotes fat mobilization in white adipocytes by repressing PPAR-gamma. Nature. 2004; 429(6993): 771-6. http://dx.doi.org/10.1038/nature02583 12. Boezen HM. SIRT1 polymorphism, long-term
survival and glucose tolerance in the general population. PLoS One. 2013; 8(3):e58636. http:// dx.doi.org/10.1371/journal.pone.0058636 13. Dong Y, Guo T, Traurig M, Mason CC, Kobes S,
Perez J, et al. SIRT1 is associated with a decrease in acute insulin secretion and a sex specific increase in risk for type 2 diabetes in Pima Indians. Mol Genet Metab. 2011; 104(4):661-5. http://dx.doi.org/ 10.1016/j.ymgme.2011.08.001
14. Zillikens MC, van Meurs JB, Sijbrands EJ, Rivadeneira F, Dehghan A, van Leeuwen JP, et al. SIRT1 genetic
variation and mortality in type 2 diabetes: Interaction with smoking and dietary niacin. Free Radic Biol Med. 2009; 46(6):836-41. http://dx. doi.org/10.1016/j.freeradbiomed.2008.12.022 15. Peeters AV, Beckers S, Verrijken A, Mertens I,
Roevens P, Peeters PJ, et al. Association of SIRT1 gene variation with visceral obesity. Hum Genet. 2008; 124(4):431-6. http://dx.doi.org/10.1007/s0 0439-008-0567-8
16. Weyrich P, Machicao F, Reinhardt J, Machann J, Schick F, Tschritter O, et al. SIRT1 genetic variants associate with the metabolic response of Caucasians to a controlled lifestyle intervention: The TULIP study. BMC Med Genet. 2008; 9:100. http:// dx.doi.org/10.1186/1471-2350-9-100
17. Pedersen SB, Olholm J, Paulsen SK, Bennetzen MF, Richelsen B. Low Sirt1 expression, which is upregulated by fasting, in human adipose tissue from obese women. Int J Obes. 2008; 32(18):1250-5. http://dx.doi.org/10.1038/ijo.2008.78
18. Shimoyama Y, Suzuki K, Hamajima N, Niwa T. Sirtuin 1 gene polymorphisms are associated with body fat and blood pressure in Japanese. Transl Res. 2011; 157(6):339-47. http://dx.doi.org/10.1016/j. trsl.2011.02.004
19. Zillikens MC, Van Meurs JB, Rivadeneira F, Amin N, Hofman A, Oostra BA, et al. SIRT1 genetic variation is related to BMI and risk of obesity. Diabetes. 2009; 58(12):2828-34. http://dx.doi.org/10.2337/db09-0536
20. Zillikens MC, Van Meurs JB, Rivadeneira F, Hofman A, Oostra BA, Sijbrands EJ, et al. Interactions between dietary vitamin E intake and SIRT1 genetic variation influence body mass index. Am J Clin Nutr. 2010; 91(5):1387-93. http://dx.doi.org/10.3945/ ajcn.2009.28627
21. Organização Mundial de Saúde. Obesidade: preve-nindo e controlando a epidemia global. Relatório da Consultoria da OMS. São Paulo: Rocca; 2004. 22. Friedewald WT, Levy RI, Fredrickson DS. Estimation
of the concentration of low density lipoprotein cholesterol in plasma, without use of the preparative ultracentrifuge. Clin Chem. 1972; 18(6):499-502. 23. Arruda VR, Lima CS, Grignoli CR, de Melo MB, Lorand-Metze I, Alberto FL, et al. Increased risk for acute myeloid leukaemia in individuals with glutathione S-transferase mu1 (GSTM1) and theta1 (GSTT1) gene defects. Eur J Haematol. 2001; 66(6):383-8. http://dx.doi.org/10.1034/j.1600-060 9.2001.066006383.x
Japanese hemodialysis patients. J Ren Nutr. 2012; 22(1):114-9. http://dx.doi.org/10.1053/j.jrn. 2011.10.025
25. Zarrabeitia MT1, Valero C, Martín-Escudero JC, Olmos JM, Bolado-Carrancio A, de Sande-Nacarino EL. Association study of sirtuin 1 polymorphisms with bone mineral density and body mass index. Arch Med Res. 2012; 43(5):363-8. http://dx.doi. org/10.1016/j.arcmed.2012.06.012
26. Clark SJ, Falchi M, Olsson B, Jacobson P, Cauchi S, Balkau B. Association of sirtuin 1 (SIRT1) gene SNPs and transcript expression levels with severe obesity. Obesity. 2012; 20(1):178-85. http://dx.doi.org/10. 1038/oby.2011.200
27. Figarska SM, Vonk JM, Boezen HM. SIRT1 polymorphism, long-term survival and glucose tolerance in the general population. PLoS One. 2013; 8(3):e58636. http://dx.doi.org/10.1371/journal. pone.0058636
28. Yang J, Wang N, Zhu Y, Feng P. Roles of SIRT1 in high glucose-induced endothelial impairment: Association with diabetic atherosclerosis. Arch Med Res. 2011; 42(5):354-60. http://dx.doi.org/10.10 16/j.arcmed.2011.07.005
29. Botden IP, Zillikens MC, de Rooij SR, Langendonk JG, Danser AH, Sijbrands EJ, et al. Variants in the SIRT1 gene may affect diabetes risk in interaction with prenatal exposure to famine. Diabetes Care. 2012; 35(2):424-6. http://dx.doi.org/10.2337/dc1 1-1203
30. Kilic U, Gok O, Bacaksiz A, Izmirli M, Elibol-Can B, Uysal O. SIRT1 gene polymorphisms affect the protein expression in cardiovascular diseases. PLoS One. 2014; 9:e90428. http://dx.doi.org/10.1371/ journal.pone.0090428
31. Mateo-Gallego R, Bea AM, Jarauta E, Perez-Ruiz MR, Civeira F. Age and sex influence the relationship between waist circumference and abdominal fat distribution measured by bioelectrical impedance. Nutr Res. 2012; 32(6):466-9. http://dx.doi.org/10. 1016/j.nutres.2012.05.004
32. Carr MC. The emergence of the metabolic syndrome with menopause. J Clin Endocrinol Metab. 2003; 88(6):2404-11. http://dx.doi.org/10.1210/ jc.2003-030242
33. Gupta R, Deedwania PC, Gupta A, Rastogi S, Panwar RB, Kothari K. Prevalence of metabolic syndrome in an Indian urban population. Int J Cardiol. 2004; 97(2):257-61. http://dx.doi.org/10. 1016/j.ijcard.2003.11.003
34. Machado UF, Schaan BD, Seraphim BM. Glucose transporters in the metabolic syndrome. Arq Bras Endocrinol Metab. 2006; 50(2):177-89. http://dx. doi.org/10.1590/S0004-27302006000200004
35. Schäfer S, Kantartzis K, Machann J, Venter C, Niess A, Schick F, et al. Lifestyle intervention in individuals with normal versus impaired glucose tolerance. Eur J Clin Invest. 2007; 37(7):535-43.
36. Johannsson G, Mårin P, Lönn L, Ottosson M, Stenlöf K, Björntorp P, et al. Growth hormone treatment of abdominally obese men reduces abdominal fat mass, improves glucose and lipoprotein metabolism, and reduces diastolic blood pressure. J Clin Endocrinol Metab. 1997; 82(3):727-34. http:// dx.doi.org/10.1210/jcem.82.3.3809
37. Schneider H, Klotsche J, Wittchen H, Stalla G, Schopohl J, Kann P, et al. Effects of growth hormone replacement within the KIMS survey on estimated cardiovascular risk and predictors of risk reduction in patients with growth hormone deficiency. Clin Endocrinol. 2011; 75(6):825-30. http://dx.doi.org/ 0.1111/j.1365-2265.2011.04137.x
38. Nagasaki K, Tsumanuma I, Yoneoka Y, Jinguji S, Ogawa Y, Kikuchi T, et al. Metabolic effects of growth hormone replacement in two pediatric patients with growth without growth hormone. Endocr J. 2010; 57(9):771-5. http://doi.org/10.15 07/endocrj.K10E-180
39. Arafat AM, Möhlig M, Weickert MO, Schöfl C, Spranger J, Pfeiffer AF. Improved insulin sensitivity, preserved beta cell function and improved whole-body glucose metabolism after low-dose growth hormone replacement therapy in adults with severe growth hormone deficiency: A pilot study. Diabetologia. 2010; 53(7):1304-13. http://doi.org/ 10.1007/s00125-010-1738-4
40. Douyon L, Schteingart DE. Effect of obesity and starvation on thyroid hormone, growth hormone, and cortisol secretion. Endocrinol Metab Clin North Am. 2002; 3(1):173-89.
41. Kumar HK, Yadav RK, Prajapati J, Reddy CV, Raghunath M, Modi KD. Association between thyroid hormones, insulin resistance, and metabolic syndrome. Saudi Med J. 2009; 30(7):907-11. 42. Estivalet AA, Leiria LB, Dora JM, Rheinheimer J,
Bouças AP, Maia AL, et al. D2 Thr92Ala and PPARγ2 Pro12Ala polymorphisms interact in the modulation of insulin resistance in type 2 diabetic patients. Obesity. 2011; 19(4):825-32. http://doi.org/10.10 38/oby.2010.231
43. Nagai N, Sakane N, Kotani K, Hamada T, Tsuzaki K, Moritani T. Uncoupling protein 1 gene -3826 A/G polymorphism is associated with weight loss on a short-term, controlled-energy diet in young women. Nutr Res. 2011; 31(4):255-61. http://doi. org/10.1016/j.nutres.2011.03.010