Disrupted dispersal and its genetic
consequences: Comparing protected and
threatened baboon populations (Papio papio)
in West Africa
Maria Joana Ferreira da Silva1,2,3*, Gisela H. Kopp4¤, Catarina Casanova3,
Raquel Godinho2,5,6, Taˆnia Minho´s7,8,9, Rui Sa´10,11, Dietmar Zinner4, Michael W. Bruford1,12
1Organisms and Environment Division, School of Biosciences, Cardiff University, Cardiff, Wales, United Kingdom,2CIBIO/InBio, Centro de Investigac¸ão em Biodiversidade e Recursos Gene´ticos, Universidade do Porto, Campus Agra´rio de Vairão, Vairão, Portugal,3CAPP, School of Social and Political Sciences, University of Lisbon, Rua Almerindo Lessa, Lisboa, Portugal,4Cognitive Ethology Laboratory, German Primate Center, Go¨ttingen, Germany,5Departamento de Biologia, Faculdade de Ciências da Universidade do Porto, Rua do Campo Alegre, Porto, Portugal,6Department of Zoology, Faculty of Sciences, University of Johannesburg, Auckland Park, South Africa,7Departamento de Antropologia, Faculdade de Ciências Sociais e Humanas, Universidade Nova de Lisboa, Lisboa, Portugal,8Centre for Research in Anthropology (CRIA), Instituto Universita´rio de Lisboa, Lisboa, Portugal,9IGC, Instituto Gulbenkian de Ciência, Rua da Quinta Grande, Oeiras, Portugal,10 Departamento de Ciências Ambientais, Universidade Luso´fona da Guine´, Rua Vitorino Costa, Bissau, Guine´-Bissau,11Research Centre for Anthropology and Health, Universidade de Coimbra, Calc¸ada Martim de Freitas, Coimbra, Portugal,12 Sustainable Places Research Institute, Cardiff University, Cardiff, Wales, United Kingdom
¤ Current address: Zukunftskolleg and Department of Biology, University of Konstanz, Konstanz and Department of Migration and Immuno-Ecology, Max Planck Institute for Ornithology, Radolfzell, Germany
Abstract
Dispersal is a demographic process that can potentially counterbalance the negative impacts of anthropogenic habitat fragmentation. However, mechanisms of dispersal may become modified in populations living in human-dominated habitats. Here, we investigated dispersal in Guinea baboons (Papio papio) in areas with contrasting levels of anthropogenic fragmentation, as a case study. Using molecular data, we compared the direction and extent of sex-biased gene flow in two baboon populations: from Guinea-Bissau (GB, fragmented distribution, human-dominated habitat) and Senegal (SEN, continuous distribution, pro-tected area). Individual-based Bayesian clustering, spatial autocorrelation, assignment tests and migrant identification suggested female-mediated gene flow at a large spatial scale for GB with evidence of contact between genetically differentiated males at one local-ity, which could be interpreted as male-mediated gene flow in southern GB. Gene flow was also found to be female-biased in SEN for a smaller scale. However, in the southwest coastal part of GB, at the same geographic scale as SEN, no sex-biased dispersal was detected and a modest or recent restriction in GB female dispersal seems to have occurred. This population-specific variation in dispersal is attributed to behavioural responses to human activity in GB. Our study highlights the importance of considering the genetic conse-quences of disrupted dispersal patterns as an additional impact of anthropogenic habitat
a1111111111 a1111111111 a1111111111 a1111111111 a1111111111 OPEN ACCESS
Citation:Ferreira da Silva MJ, Kopp GH, Casanova C, Godinho R, Minho´s T, Sa´ R, et al. (2018) Disrupted dispersal and its genetic consequences: Comparing protected and threatened baboon populations (Papio papio) in West Africa. PLoS ONE 13(4): e0194189.https://doi.org/10.1371/ journal.pone.0194189
Editor:Sam C Banks, Australian National University, AUSTRALIA
Received:November 8, 2016
Accepted:February 27, 2018
Published:April 3, 2018
Copyright:©2018 Ferreira da Silva et al. This is an open access article distributed under the terms of theCreative Commons Attribution License, which permits unrestricted use, distribution, and reproduction in any medium, provided the original author and source are credited.
Data Availability Statement:Microsatellite data is available from the Dryad Digital Repository:http:// datadryad.org/review?wfID=33683&token= 48524313-4599-49fd-8120-c6d2a12f4066(doi:10. 5061/dryad.4424t).
fragmentation and is potentially relevant to the conservation of many species inhabiting human-dominated environments.
Introduction
Dispersal is usually sex-biased in mammals and birds,i.e., one sex disperses more frequently
and/or further while the opposite sex remains and reproduces in its natal area [1–2]. This sex-biased dispersal pattern is usually consistent within and between closely related species [3–4]. However, local changes in ecological and demographic factors (e.g. intrinsic patch features such as food availability, size and isolation, population density, intra- and specific
inter-actions, sex ratio, relatedness) can alter an individual’s dispersal strategy [2,5–7]. Individuals
that otherwise would remain philopatric may disperse to seek reproductive opportunities or because the costs of dispersal surpass the benefits, individuals may therefore reproduce in their natal areas [4–5]. As a consequence, the dispersal pattern of the population, usually biased
towards one sex, may become less obvious or reversed [2,4,8].
Since dispersal promotes genetic exchange between populations, changes in dispersal pat-terns are expected to influence a population’s genetic composition and conservation
require-ments [7,9]. If gene flow increases, differentiated sub-populations may come into contact and
exchange genes in contact zones, leading to potential genetic “swamping” and loss of local adaptations [8]. On the other hand, if gene flow is constrained, populations may become more structured, leading to a loss of genetic variation through drift and possibly a reduction of
reproductive fitness if mating options become limited to kin resulting in inbreeding [8,10].
Human activities may drive changes in population demography and connectivity, which
can modify population dispersal patterns [2,5]. Changes in sex-biased dispersal have been
described for several taxa in populations inhabiting human-altered environments, including
primates (e.g.Pan troglodytes verus, [11],Macaca cyclopis, [12],Ateles belzebuth, [13]).
More-over, female dispersal in Old World primates is frequently limited by the degree of overlap of a group’s home range with others [14]. In human-dominated environments, low population density and isolation of groups across the landscape may reduce the extent of overlap between home ranges, increasing the cost of dispersal for females. As a consequence, females may not disperse from their natal group, which in turn may increase genetic differentiation between
sub-populations and lead to a less pronounced female-biased dispersal pattern [2,8].
However, predicting the influence of human activities on dispersal is not straightforward. Its effects may depend on an individuals’ ability to move between populations and to repro-duce, on the intensity of anthropogenic disturbance and on the species’ ability to cope with such disruption [15–16], which is often difficult to measure. Additionally, human activities may have contrasting effects on gene flow (e.g. decreasing, [17]; increasing, [18]) and on group composition [19–21]. As a result, these effects can easily be overlooked or mistaken for the characteristic pattern of a species, particularly when local human practices are illegal and con-cealed and when only one population is studied. Identifying how and whether anthropogenic activities influence dispersal may thus require comparison among populations subject to
dif-ferent levels of human disturbance [7,9].
Here, we investigated population differences in dispersal behaviour in Guinea baboons (Papio papio). Our study was focused on two geographically distinct populations—southern Guinea-Bissau and Senegal—that inhabit environments with contrasting levels of human dis-turbance. Baboons from southern Guinea-Bissau inhabit a human-altered environment and
European Social Funds through POPH QREN -Tipologia 4.1 Formac¸ão Avanc¸ada),http://www.fct. pt/. RG was supported by FCT IF’s contract (IF/ 00564/2012). This work was partially funded by FCT (project IF/00564/2012/CP0159/CT0003). GHK was funded by the German Science Foundation (DFG Fi 707/9-1),http://www.dfg.de/en/, the German Academic Exchange Service (DAAD)
https://www.daad.de/en/, the Christian-Vogel-Fonds -http://www.gf-primatologie.deand the German Initiative of Excellence,http://www.dfg.de/ en/research_funding/programmes/excellence_ initiative/. The funders had no role in study design, data collection and analysis, decision to publish, or preparation of the manuscript.
have been extensively hunted, mainly for meat consumption [22–24]. The species’ distribution
in Guinea-Bissau is highly fragmented, with few groups outside national parks [22,25]. In
con-trast, the Niokolo Koba National Park population in Senegal, the geographic scale of which is comparable to the Guinea-Bissau study site, is not significantly affected by human activity and
is continuously distributed within the park limits [26,27].
Dispersal in Guinea baboons is thought to be female-biased. Previous studies have inferred long-term female-mediated gene flow across the species distribution [28], including the
Sene-galese [29] and the Guinea-Bissau population [23,25], and on-going female-biased dispersal
in Senegal [29]. Sex-biased dispersal in the last few generations has not been studied for the Guinea-Bissau population. However, results from our previous work suggested that the inten-sification of human activities might have modified the Guinea-Bissau population structure in the last thirty years (3–4 generations, at 12–15 years [30]). As the population in southern Guinea-Bissau is very fragmented, we initially hypothesized that populations inhabiting pro-tected areas would be isolated, but evidence for on-going gene flow included: i) differentiated genetic units were found to be in contact, in particular in one protected area, where the loca-tion of genetic discontinuities and anthropogenic landscape features do not seem to be corre-lated, and ii) significant genetic similarity was found between samples distanced 115.5 km apart, with higher genetic dissimilarity found at 66 km corresponding to an area impacted by anthropogenic activities and low group density [25]. Thus, genetic structure within the Guinea-Bissau population suggested a recent increase in dispersal distances [25], an unex-pected result for a species with female-biased dispersal and which may signal a recent change in sex-biased dispersal in the population.
Our aim in this study was to follow up our previous work by comparing patterns of sex-biased gene flow (direction and magnitude) at similar geographic scales between Guinea-Bis-sau and a less disturbed environment (in Senegal). By applying molecular tools to study sex-biased dispersal we can detect differences starting just a few generations ago and test its impact
on population structure [31,32]. While the philopatric sex is expected to show higher natal
social group relatedness, display greater genetic differentiation among groups and thus higher population structure, the dispersing sex is expected to homogenize genetic differentiation
across groups and thus display more similar allele frequencies across subpopulations [31,32].
Given the higher degree of human disturbance across Guinea-Bissau when compared to Sene-gal, we expected to find differences in sex-specific population genetic structure between the two populations, which would indicate differences in the sex-biased dispersal. More specifi-cally, we expected to find no difference in the degree of genetic structure between males and females in Guinea-Bissau (e.g. no sex-biased dispersal) and a higher degree of genetic structure in males when compared with females in Senegal (e.g. female-biased dispersal).
Methods
Study areas
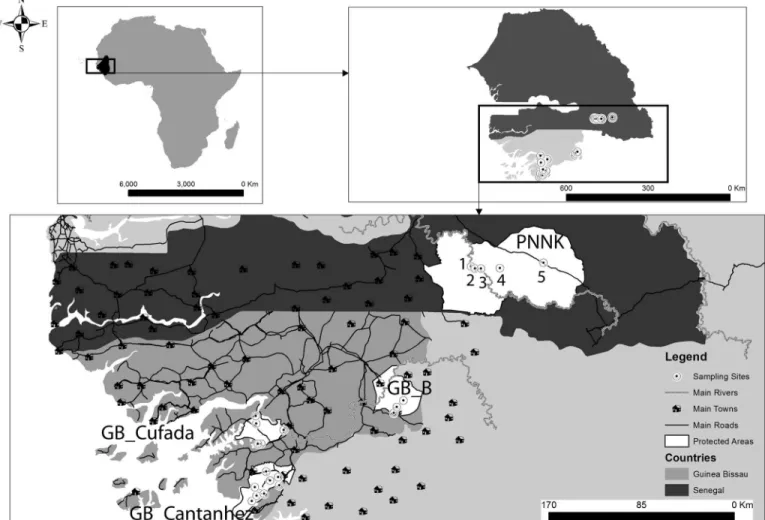
The study encompasses two Guinea baboon populations—Guinea-Bissau (GB) and Senegal (SEN), separated by approximately 150 km (Fig 1). Previous analyses using samples collected across the entire distribution of the species found that GB and SEN constitute differentiated genetic clusters [33–34].
GB_Cantanhez and GB_Cufada are located in the southwest coastal part of GB and are sepa-rated roughly by 50 km. GB_Cantanhez (total area 106 767 ha) is located on a peninsula con-nected to mainland GB by a 25–30 km isthmus. GB_Cufada (a total area of 89,000 ha) is surrounded by the Corubal River in the north and Buba channel in the south and delimitated by two main towns—Buba and Fulacunda—in the southwest and in the northeast limits, respectively. GB_Boe´ is located in the southeast of the country and is separated from GB_Can-tanhez and GB_Cufada roughly by 120 Km and 100 km, respectively. GB_Boe´ is delimitated in the west by the Corubal River and in the east by the Fefine River. In SEN, the study was carried out within the Niokolo Koba National Park (PNNK, north limit: 13.329490˚ -13.442568˚ and south limit: 12.644166˚ -13.094790˚, a total area of 913,000 ha), across a maximum distance of 65 km between sampling sites.
The area between the GB’s Cantanhez and Cufada parks, which is comparable to the spatial scale among sampling sites in PNNK, has a higher degree of human disturbance (Fig 1). IBAP
Fig 1. Study areas.Top left: Black shading in overview map indicates the distribution of Guinea baboons (adapted from IUCN). Top right: Guinea-Bissau (GB— country area in light grey) and Senegal (SEN—country area in dark grey). Sampled sites indicated by black-dotted white circles. Bottom: Most important anthropogenic features (main roads, villages and towns) and sampling sites in Senegal (Niokolo Koba National Park—PNNK, sampling sites: 1—Gue Damantan, 2 —Simenti, 3—Camp Lion, 4—Lingue Kountou, and 5—Niokolo) and in Guinea-Bissau (GB_B—Boe´ Natural Park, GB_Cufada—Cufada Lagoons Natural Park, and GB_Cantanhez—Cantanhez Woodlands Natural Park). The two main rivers (Corubal in Guinea-Bissau and the Gambia River in Senegal) are indicated by a grey line. The comparison of dispersal patterns between Senegal and Guinea-Bissau was done for the geographic scale of 66 km (the spatial scale between sampling sites in Senegal and between GB_Cantanhez and GB_Cufada in GB).
(Instituto da Biodiversidade e Áreas Protegidas, Institute for Biodiversity and Protected Areas), the national authority responsible for the management of protected areas in GB, has a set of rules in place that limit hunting practices and deforestation to a certain extent within the limits of protected areas. A considerable extension of the original habitat has been converted to crop areas outside protected areas in GB, with a variety of human infrastructure, including paved roads connecting the south of the country to the capital city and medium-size towns (Fig 1). Groups of baboons are rarely observed outside protected areas in GB [22]. Likewise, the popu-lations of Guinea baboons outside protected areas in Senegal are thought to have suffered a widespread decline in the last thirty years [35–36] and fragmentation of the distribution is likely. To the best of our knowledge, the populations between GB_Boe´ and PNNK have not been recently surveyed.
Permission to work in the Guinea-Bissau protected areas (e.g. Cantanhez, Cufada, and Boe´) was issued by IBAP. Permission to work in PNNK was issued by Direction des Parcs
Natio-naux and Ministère de l’Environnement et de la Protection de la Nature de la Republique du
Senegal (Attestation 0383/24/03/2009 and 0373/10/3/2012).
Sampling
We reanalysed a microsatelliteloci(STR) dataset generated by previous studies composed of
143 unique multi-locus genotypes (54 males and 89 females) sampled in GB’s protected areas
(GB_Cantanhez N = 71, GB_Cufada N = 51, and GB_Boe´ N = 21 genotypes) [25,37] and 165
unique genotypes (97 males and 68 females) sampled within PNNK area in SEN [29] (Fig 1; Table 1; Table A inS1 Appendix). Genotypes were obtained non-invasively from faecal sam-ples, collected randomly from unhabituated and unidentified individuals in baboon home
ranges, in foraging paths and sleeping sites (for details on sampling techniques, see [25,29,
34]). During sample collection, the location of each sample was recorded using a GPS receiver. In GB, sampling was carried out at 17 sampling sites within protected areas (average num-ber of genotypes per sampling site = 8.4, varying between 3 and 21, the average distance between sampling sites = 64.9 km, ranging from 2.6 to 164.5 km, Figure A and Tables A and B inS1 Appendix). Sampling sites in Guinea-Bissau are unlikely to represent independent social groups. In Senegal, social parties may divide into smaller groups or merge into larger ones sev-eral times a day [38] and we assumed a similar social organization in Guinea-Bissau. Samples collected in GB at one site may represent groups of individuals of the same social unit (i.e., the individuals were foraging or sleeping together before defecating) but neighbouring sampling sites might not be independent (i.e., the groups might have slipped before or may have merged after the sampling moment).
In SEN, sampling was carried out at five sampling sites in an almost continuous design (average number of genotypes per sampling site = 33, varying between 108 and 11, the average
distance between sampling sites = 18.1 km, varying between 4.1 and 65.0 km) (Table C inS1
Appendix). Most samples collected in SEN stem from the Simenti community, a troop under study by the Cognitive Ethology Laboratory of the German Primate Center (DPZ).
Microsatellite analyses and sex determination
DNA samples were analyzed using thirteen microsatellitelociused in common by [25] and
[29] (S2 Appendix). Microsatellitelociare human-derived and cross-amplify inPapio[39–40]
following procedures detailed inS2 Appendix. Allelic dropout rate (ADO) and false allele rate
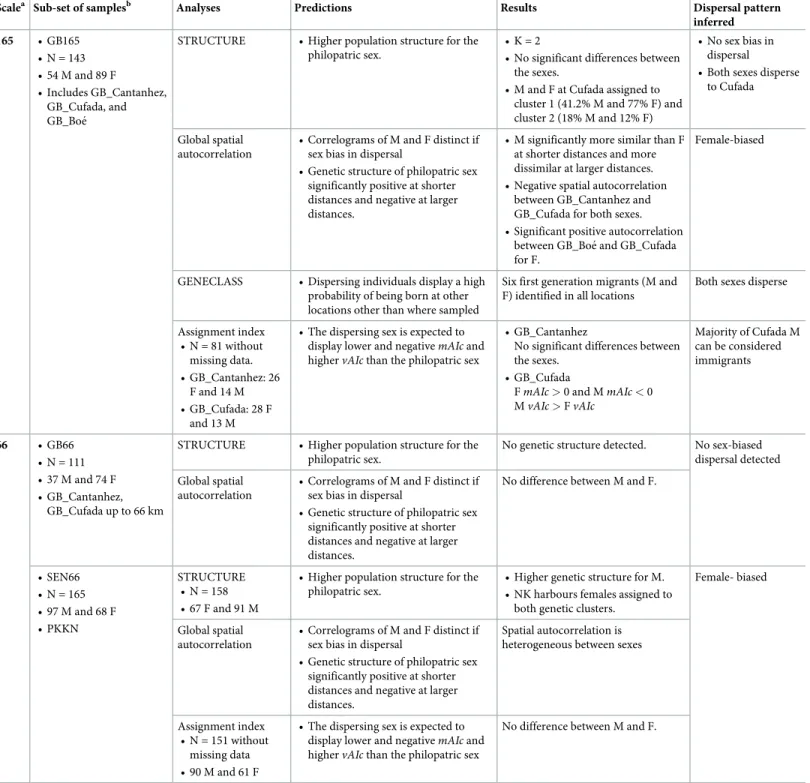
Table 1. Inference of dispersal patterns at multiple geographic scales for Guinea-Bissau and Senegal.
Scalea Sub-set of samplesb Analyses Predictions Results Dispersal pattern
inferred
165 • GB165 • N = 143 • 54 M and 89 F
• Includes GB_Cantanhez, GB_Cufada, and GB_Boe´
STRUCTURE • Higher population structure for the philopatric sex.
• K = 2
• No significant differences between the sexes.
• M and F at Cufada assigned to cluster 1 (41.2% M and 77% F) and cluster 2 (18% M and 12% F)
• No sex bias in dispersal • Both sexes disperse
to Cufada
Global spatial autocorrelation
• Correlograms of M and F distinct if sex bias in dispersal
• Genetic structure of philopatric sex significantly positive at shorter distances and negative at larger distances.
• M significantly more similar than F at shorter distances and more dissimilar at larger distances. • Negative spatial autocorrelation
between GB_Cantanhez and GB_Cufada for both sexes. • Significant positive autocorrelation
between GB_Boe´ and GB_Cufada for F.
Female-biased
GENECLASS • Dispersing individuals display a high probability of being born at other locations other than where sampled
Six first generation migrants (M and F) identified in all locations
Both sexes disperse
Assignment index • N = 81 without missing data. • GB_Cantanhez: 26
F and 14 M • GB_Cufada: 28 F
and 13 M
• The dispersing sex is expected to display lower and negativemAIcand highervAIcthan the philopatric sex
• GB_Cantanhez
No significant differences between the sexes.
• GB_Cufada
FmAIc>0 and MmAIc<0 MvAIc>FvAIc
Majority of Cufada M can be considered immigrants
66 • GB66 • N = 111 • 37 M and 74 F • GB_Cantanhez,
GB_Cufada up to 66 km
STRUCTURE • Higher population structure for the philopatric sex.
No genetic structure detected. No sex-biased dispersal detected
Global spatial autocorrelation
• Correlograms of M and F distinct if sex bias in dispersal
• Genetic structure of philopatric sex significantly positive at shorter distances and negative at larger distances.
No difference between M and F.
• SEN66 • N = 165 • 97 M and 68 F • PKKN
STRUCTURE • N = 158 • 67 F and 91 M
• Higher population structure for the philopatric sex.
• Higher genetic structure for M. • NK harbours females assigned to
both genetic clusters.
Female- biased
Global spatial autocorrelation
• Correlograms of M and F distinct if sex bias in dispersal
• Genetic structure of philopatric sex significantly positive at shorter distances and negative at larger distances.
Spatial autocorrelation is heterogeneous between sexes
Assignment index • N = 151 without
missing data • 90 M and 61 F
• The dispersing sex is expected to display lower and negativemAIcand highervAIcthan the philopatric sex
No difference between M and F.
aNote that dispersal patterns were inferred at three geographic scales (165 km, 66, and 26 km) but the table shows the 165 and 66 km scales only.
bSub-sets of samples (“GB165”, “GB66”, and “SEN66”). GB165 included all samples collected in Guinea-Bissau to a maximum of 165 km, the distance between the
furthest samples collected in Cantanhez and Boe´. A threshold of 66 km was set to perform comparative analyses between SEN and GB (for the criteria used to chose these distances, please seeS4 Appendix). GB66 included samples from Cantanhez Woodlands National Park (GB_Cantanhez) and Cufada Lagoons Natural Park (GB_Cufada), distanced to a maximum of 66 km. SEN66 included samples from Niokolo Koba National Park area, distanced to the furthest distance of 65.0 km. Note that results of STRUCTURE for SEN66 shown in the table are for a re-run of STRUCTURE after removing seven samples from the sub-set (see text for details).
The sex of individual samples was determined using a molecular protocol detailed inS3 Appendix, which have been previously optimized by [29,37].
Statistical analyses
We performed individual-level analyses to avoid makinga prioriassumptions on the grouping
pattern of the individuals. Given the large geographic distance separating GB_Cufada, GB_Cantanhez and GB_Boe´, those regions were considered as independent geographic dis-tinct subpopulations.
Genetic diversity. Allelic Richness (AR) per locus, corrected for unequal sample sizes by rarefaction [43], and Linkage Disequilibrium (LD) between all pairs of loci per database (GB and SEN) were estimated using FSTAT v2.9.3.2 [44]. Observed (Ho) and expected
heterozygos-ity (He) per locus and tests for Hardy-Weinberg Equilibrium (HWE) were computed using
GenAlEx v6.3 [45]. We estimated the genetic diversity per geographically distinct localities (SEN, GB_Cantanhez, GB_Cufada and GB_Boe´) and separately for males and females.
GenA-lEx was used to estimate the number of alleles (Na), the number of effective alleles (Ne,i.e., the
number of alleles with equal frequencies),Ho,He, Unbiased expected heterozygosity (UHe)
andFis.
Sex-biased gene flow. Dispersal distances are unknown for the Guinea baboons. In other baboon species, dispersing individuals usually travel less than 20 km between neighbouring groups (Papio cynocephalus: 15–22 km [46] or 11–19.1 km [47]) and dispersal may occur mul-tiple times during the life span of individuals. Nevertheless, given that Guinea baboons can travel up to 15 km daily, and that significant genetic differentiation was found at geographic
distances larger than 50 km [25,29], a sex bias in dispersal in the Guinea baboon might be
detected at greater distances than for other species (i.e.,>20 km).
Considering that dispersal is a scale-dependent process [48] and the difference in
geo-graphic scale of the study area in the two populations (GB<165 km and SEN<65 km), we
assembled sub-sets of samples collected at different spatial scales to test for sex bias in dispersal in the human-dominated environment of GB and compare dispersal patterns between GB and SEN.
We started by testing sex-biased dispersal at a broad scale (i.e., to a maximum linear dis-tance of 165 km) by assembling all genotypes sampled in GB_Cantanhez, GB_Cufada, and
GB_Boe´ in a sub-set hereafter named “GB165” (54 males and 89 females,Table 1;S1
Appen-dix). Sex-biased dispersal at a broad geographic scale including SEN could not be tested because the genotypes in SEN were sampled at a maximum Euclidean linear distance of 65.0
km (Table C inS1 Appendix) and a sampling gap of approximately 136 km is present between
the closest samples of GB_Boe and SEN.
Individual-based clustering implemented in STRUCTURE v2.1 [49] was used to investigate genetic structure. We inferred clusters (K) between one and ten, with five independent repli-cates, using the admixture model (default parameters) and assuming correlated allele frequen-cies. We used the sampling location of individuals (i.e., GB_Cantanhez, GB_Cufada and
GB_Boe´,Table 1;S1 Appendix) as a prior in the model ([50],e.g. [29,34]). The Locprior
model is expected to improve the assignment of individuals to putative genetic clusters when the structure is weak, without driving any particular structure if a genetic signal is absent and by overwriting the sampling information when the genetic ancestry of individuals is unrelated
with the respective sampling site [29,50]. Each run was preceded by a burn-in of 100,000 steps
followed by MCMC runs of 1,000,000 iterations. The most likely number of clusters (K) in
STRUCTURE was estimated using the highest estimated log-likelihood, thead hocstatisticΔK
of K, calculated according to [49]. We used different criteria to determine the most likely K
because thead hocstatisticΔK is not suitable when a structure is absent (i.e., K = 1 [51]). We
averaged the individual probability of assignment (q) over the five independent runs and used the plot of ranked partial membership of each individual to each cluster to detect the
mini-mum q of the samples clearly assigned to genetic clusters [53,54]. We calculated the
propor-tion of males and females assigned to each genetic cluster per sampling region.
Spatial autocorrelation, as estimated in GenAlEx 6.3, was used to compare the spatial
genetic structure between the sexes [55]. The autocorrelation coefficientr(-1 to 1) measures
the genetic similarity (r>0) or dissimilarity (r<0) between pairs of individuals grouped in
distance classes. Significant spatial structure (P<0.05) is present whenrlies outside a 95%
upper and lower confidence interval, obtained by permutation with 9,999 replicates [55]. We calculated the pairwise codominant genotypic distance and the linear geographical distances between individuals. Geographical distances were calculated using the GPS coordinates of the samples registered in the UTM (Universal Transversal Mercator) coordinate system and
trans-lated to km using GenAIEx. Analyses were performed at the 165 km scale (Table 1;S1
Appen-dix) and samples were grouped in ten distance classes ([0–17[, [17–34[, [34–51[, [51–68[, [68– 85[, [85–102[, [102–119[, [119–136[, and [136–153] km, starting point). The width of the dis-tance classes was chosen among other possible combinations to allow for i) a direct compari-son between sub-sets, using the same geographic distances for males and females and
including sufficient number of pairs of individuals in each class (i.e., npairwise comparisons) to
perform the analyses, and to ii) likely encompass dispersal distances for the Guinea baboon
(see above). Squared paired-sample t-tests (t2) and the omega (ω) test criteria were used to
compare the heterogeneity between correlograms of males and females for single and overall distance classes [56]. Significant differences of the heterogeneity test between correlograms
(P<0.01, [57]) were tested using 9,999 bootstraps [55]. With sex-biased dispersal, the
correlo-grams of males and females are expected to be distinct and the philopatric sex should display significant positive genetic structure at shorter distances and significant negative genetic struc-ture at longer distances [58]. Analyses were repeated including the GB_Cantanhez, GB_Cu-fada datasets only (41 males and 81 females) to assess the effect of excluding sampling sites in the spatial autocorrelation pattern. Samples were grouped in five distance classes ([0–16.5[, [16.5–33[, [33–49.5[, [49.5–66[, and [66–82.5[) and analyses were carried out following the described procedures.
To detect first-generation migrants (i.e., the individuals with a high probability of being born at one sampling locality), we divided the GB165 dataset in GB_Cantanhez, GB_Cufada, and GB_Boe´ and used GENECLASS version 2.0 [59] to estimate two likelihood-based tests
statistics: Lh(more adequate when the source population might not have been sampled) and
Lh/Lmax(better when all source populations were presumably sampled) [60]. A Bayesian
method [61] and the Paetkau [62] resampling Monte Carlo algorithm (10,000 simulations and an alpha level of 0.01) were used to identify the critical values distinguishing between residents and migrants. We expected to find a higher number of first-generation migrants of the dispers-ing sex.
We estimated the assignment indexAIc, mean corrected assignment indexmAIcand
variance of the assignment indexvAIcin GenAlEx 6.3.AIc, which can be defined as the
proba-bility of a genotype assigned to the locality where the individuals were sampled, is expected to be negative for dispersing individuals [63]. If dispersal is sex-biased, the dispersing sex is expected to display a lower than expected frequency of rare alleles in relation to the population
where the individual was sampled [63]. Significant differences inmAIcandvAIccan be found
between the dispersing and the philopatric sex [63]. Specifically, the dispersing sex is expected
this analysis uses samples with no missing data. Therefore,AIc,mAIc, andvAIcwere estimated for 26 females and 14 males sampled at GB_Cantanhez and 28 females and 13 males sampled at GB_Cufada. Since most of the genotypes sampled at Boe´ had missing data (e.g. seven out of eight females identified), GB_Boe´ was excluded from these analyses. Significance was tested using a Mann-Whitney U-test.
To compare sex-biased dispersal between GB and SEN, we estimated the pairwise Euclidean linear geographic distances between samples using GenAlEx 6.3 for the two populations sepa-rately (S4 Appendix). Sampling sites in GB165 were selected to be part of the comparative analyses between the two populations using the following criteria: i) distance between
sam-pling sites would include probable dispersal distances for the Guinea baboon (i.e.,>20 km),
ii) selected sampling sites in GB would match inter-site distances in SEN, and iii) selected sam-pling sites would be comparable in sample size (S4 Appendix). We set the thresholds of 66 km and 26 km (S4 Appendix).
The sub-sets of samples up to a maximum Euclidean distance of 66 km are hereafter named as “GB66” and “SEN66” (Table 1). These subsets are used to compare sex-mediated gene flow across areas of higher and lower human disturbance—i.e., between the GB’s Cantanhez and Cufada (higher disturbance) and between sampling sites in SEN’s PNNK (lower disturbance). GB66 included 37 males and 74 females that were sampled up to the maximum distance of
65.7 km (i.e., the distance between the furthest neighbouring sites) (Table A inS4 Appendix)
at 12 of the 17 sampling sites of GB165 (Figure A inS1 Appendix). Five sampling sites of
GB165i.e., Cabedu in GB_Cantanhez n = 8, Guebambol in GB_Cufada n = 3, and Boe´ Beli,
Boe´ Aicum and Boe´ Aicum Montanha in GB_Boe´, n = 21, were excluded from the GB66 data-set because the sites were located more than 71 km to the farthest sampling sites in GB’s Can-tanhez and Cufada (S1 Appendix). SEN66 included 97 males and 68 females sampled at five sampling sites in PNNK (Table 1). GB_Boe´ was excluded from the comparative analyses to SEN because the distances between sampling sites and the sampling size were not comparable to the other sub-sets (S1 Appendix).
To compare the spatial genetic structure between the sexes for GB66 and SEN66 dataset, statistical analyses were repeated using the same settings as before for STRUCTURE v2.1 [49], and for spatial autocorrelation and assignment indexes estimated in GenAlEx 6.3. To estimate spatial autocorrelation patterns, samples were grouped in four distance classes of 16.5 km wide ([0–16.5[, [16.5–33[, [33–49.5[, [49.5–66 [km, starting point). The width of the distance classes was chosen among other possible combinations to allow for a direct comparison between SEN66 and GB66 sub-sets, using the same geographic distances and including a suffi-cient number of pairs of individuals in each class to perform the analyses. The distance classes of [0–16.5 [and [16.5–33 [km represent pairwise comparisons between samples collected within the limits of GB_Cantanhez, GB_Cufada and PNNK. The distance classes of [33–49.5 [and [49.5–66 [km represent pairwise comparisons across the area located between GB_Can-tanhez and GB_Cufada protected areas, which has a higher degree of human disturbance, and
an area of a lower degree of human disturbance in SEN. Squared paired-sample t-tests (t2) and
the omega (ω) test criteria were used as before to compare the heterogeneity between
correlo-grams for single and overall distance classes [56]. Furthermore, we compare the spatial genetic
structure of each sex between the populations for the same distance classes.AIc,mAIc, and
vAIcwere estimated for 90 males and 61 females sampled at SEN66 with no missing data.
were excluded from these analyses because the distances between sampling sites (i.e., 6 and 14 km) are not comparable to the other sub-sets at 26 km. SEN26 excluded Niokolo and included 82 males and 61 females from all other sampling sites. GB_Cantanhez26 and GB_Cufada26 included all sampling sites in GB66, which were divided by locality (GB_Cantanhez26: 21 males and 42 females, and GB_Cufada26: 16 males and 32 females) (S1 Appendix). We repeated the spatial autocorrelations estimated in GenAlEx 6.3 with parameters set as before to compare the spatial structure between the sexes within each locality [55]. Samples were grouped into three distance classes [0–8.66[, [8.66–17.32[, and [17.32–25.98 [km, starting point.
Results
Microsatellite genotyping and sex identification
The minimum average QI across loci exceeded 0.50 for both GB and SEN datasets (averaging 0.87 across loci for GB and 0.86 across loci for SEN). Mean ADO across loci was 14.2% for GB and 15.7% for SEN dataset, and mean FA across loci was 2.49% for GB and of 4.35% for SEN
dataset. The probability of identity (pID) using this set of loci was 2.20 x 10⁻¹⁰and the
proba-bility of identity among sibs (pIDsib) was 7.02 x 10⁻⁵. Duplicate genotypes were removed from
the datasets.
For SEN and GB_Boe´, a greater proportion of males than females were identified
(SENproportion males= 0.59 and SENproportion females= 0.41, GB_Boe´proportion males= 0.62 and
GB_Boe´proportion females= 0.38) and the opposite pattern was found in GB’s Cantanhez and
Cufada (GB_Cantanhez_proportion males= 0.34 and GB_Cufada_proportion males= 0.33) (Tables A
and B inS1 Appendix).
Genetic diversity
The thirteen microsatellites exhibited three to seven alleles per locus andHevalues varied
between 0.35 and 0.77 (Table A inS5 Appendix). Three and five of 13 loci were not in HWE
for GB165 and SEN65 datasets, respectively (Table A inS5 Appendix). Four pairs of loci
dis-played significant LD for SEN65 with none for GB165 after Bonferroni correction for multiple
comparisons (P<0.001). To eliminate the possibility that population structure was the
under-lying cause for the lack of compliance to HWE for the SEN65 dataset, we re-tested HWE after dividing SEN65 into two groups (SI+CL+GD+LK and NK) following results obtained using
STRUCTURE (seeResults). Only D12S375 and D10S611 remained in HW disequilibrium for
SI+CL+GD+LK and NK, respectively (Table B inS5 Appendix), which suggest that a
popula-tion genetic sub-structure was responsible for HW disequilibrium.
GB and SEN displayed similar values of genetic diversity (e.g.,AR: 4.7 for GB165 and 5.3 for
SEN65,ARbased on minimum sample size of 126 diploid individuals, Table A inS5
Appen-dix). When comparing between sampling localities, GB_Cantanhez had bothHoandHe
slightly lower (GB_Cantanhez:Ho= 0.55,He= 0.54 and other sampling localities: 0.55<Ho<
0.62 and 0.59<He<0.60, Table C inS5 Appendix). Genetic diversity did not vary
substan-tially between males and females in SEN and GB, although GB males showed a tendency for
lower genetic diversity and more positiveFisvalues (Table C inS5 Appendix). Males in Boe´
possessed the lowestHo(Ho= 0.48, Table C inS5 Appendix) and most positiveFis(males
GB_Boe´Fis= 0.2 ande.g. SEN malesFis= - 0.04, Table C inS5 Appendix). With respect to the
number of effective alleles,Ho,He,UHe, andFis, females were similar across sampling locations
Sex-biased gene flow at a broad scale in a human-dominated environment
(in GB)
When STRUCTURE was run using the GB165 sub-set, K = 2 produced the highest modal
value in theΔK distribution, with the largest Log-likelihood and with highest posterior
proba-bility (posterior probaproba-bilityK2= 1) (Figures A and B inS6 Appendix). The plot of ranked
aver-aged partial membership q for each individual to cluster 2 show a break between 0.71 and 0.75
and was nearly continuous between 0.75 and 1 (Figure C inS6 Appendix). Individuals were
assigned to their respective genetic clusters if the averaged q>0.75 and were considered
admixed between clusters if 0<q<0.75. Males and females did not differ in genetic structure
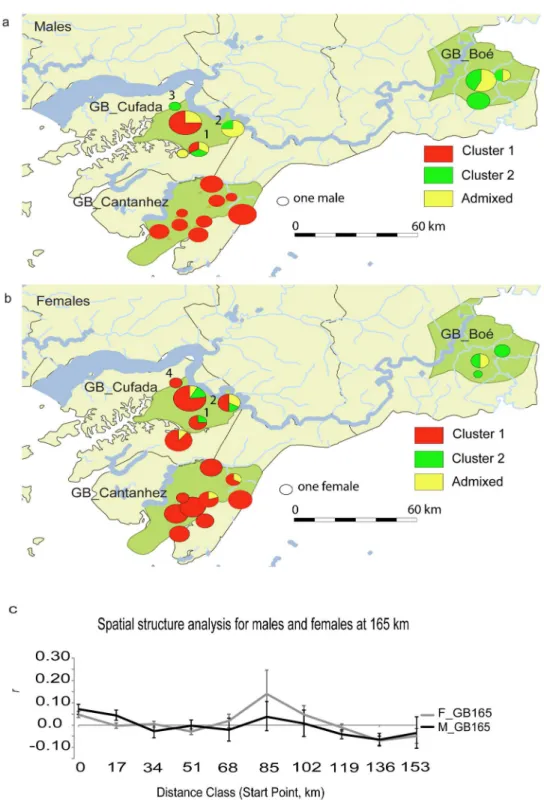
(Fig 2a and 2b; Figure B and Table A inS6 Appendix). For K = 2, 100% of males and 96% of
females sampled at Cantanhez were assigned to cluster 1 (69 individuals, average qcluster 1=
0.93, varying between 0.98 and 0.75) and two females were classified as admixed (Fig 2;
Table A inS6 Appendix). In Boe´, 62% of the males and 75% of the females were assigned to
cluster 2 (average qcluster 2= 0.86, varying between 0.95 and 0.78) or considered as admixed
(Fig 2; Table A inS6 Appendix). Cufada was the only locality in which individuals were
assigned to both genetic clusters; 41.2% of males and 77% of females were assigned to cluster 1
(average qcluster 1= 0.91, varying between 0.97 and 0.78) and 18% of males and 12% of females
were assigned to cluster 2 (average qcluster 2= 0.81, varying between 0.93 and 0.75, Table A in
S6 Appendix;Fig 2). Nevertheless, 41.2% of males and 12% of females were considered
admixed between clusters at GB_Cufada (Table A inS6 Appendix;Fig 2).
Significant positive spatial autocorrelation was found for males and females for pairwise comparisons between neighbouring groups (i.e., at [0–17 [km or for males only at [17–34 [km,
Figure D inS6 Appendix;Fig 2c). Significant negative spatial autocorrelation was found for
both sexes at distances between GB_Cantanhez and GB_Cufada (at [34–51 [km and [51–68 [km) and between GB_Boe´, GB_Cufada and GB_Cantanhez (males: [119–136 [and [136–153
[and females: [136–153 [and [153–170 [km) (Figure D inS6 Appendix;Fig 2c). An exception
to the negative spatial autocorrelation pattern for both sexes at large distance classes comprised
pairwise comparisons between GB_Boe´ and the sampling site Bakar Contêat GB_Cufada
([85–102 [and [102–119 [km), at which females showed significant positive autocorrelation and males show a positive but not significant autocorrelation coefficient. Nevertheless, the npairwise comparisonsfor the distance class [85–102 km [is particularly low for both sexes (females
n = 6 and males n = 16, Figure D inS6 Appendix;Fig 2c).
The spatial autocorrelation pattern differed significantly between the sexes (Totalωfor
data = 21.288, P = 0.003,Fig 2c) although significance was only found in two out of the ten
dis-tance classes considered. Males are significantly more similar than females between neigh-bouring groups within GB_Cufada and GB_Cantanhez areas but also between few groups
from GB_Cufada and GB_Cantanhez (males[17–34 km[:r= 0.04, P = 0.0002, females[17–34 km[:
r= - 0.003, P = 0.3, t2[17–34[= 9.1, P = 0.002). Females are significantly more similar than
males at larger distances classes (i.e., between GB_Boe´ and GB_Cufada and GB_Cantanhez
females[119–136 km[:r= - 0.011 and males[119–136 km[:r= - 0.041, t2[119–136[= 4.15, P = 0.042).
When the spatial autocorrelation analyses were conducted including the samples collected at GB_Cufada and GB_Cantanhez only and excluding GB_Boe´, a pattern where both sexes dis-play significant positive spatial autocorrelation at shorter distances and significant negative
spatial autocorrelation at larger distances was revealed (Figure E inS6 Appendix).rintercepted
zero at 24 km for males, and at 14 km for females (Figure E inS6 Appendix). The spatial
auto-correlation pattern did not differ between the sexes (Totalωfor data = 7.834, P = 0.1, Figure F
Fig 2. Population structure estimated in GB at 165 km. aandbshows the proportion of males (a) and females (b) at each sampling site assigned to the two STRUCTURE clusters using the GB165 sub-set. Individual-based assignment to each cluster was confirmed if q>0.75 (cluster 1 in red and cluster 2 in green). If 0<q<0.75, the individual was classified as admixed between clusters (yellow). Diagram size is proportional to sample size of each site. Numbers indicate the sampling sites at GB_Cufada where individuals assigned to cluster 2 were found; 1—Sr. Soares 1, 2—Bakar Contê, 3—Guebombol, 4—Bubatchingue.cshows the spatial autocorrelation correlogram of the multiclass tests between females (dark grey line) and males (black line); npairwise comparisons: [0–17 km[ = 1071, [17–34[ = 1183, [34–
51[ = 824, [51–68[ = 899, [68–85[ = 189, [85–102[ = 22, [102–119[ = 78, [119–136[ = 656, [136–153[ = 300 and [153– 170[ = 125. Males and females significantly differ in their autocorrelation pattern at the distance classes of [17–34 [(t2
than males, females[16.5–33[:r= - 0.006, males[16.5–33[:r= 0.006, P = 0.004). However, some dif-ferences were found from the spatial autocorrelation estimated using GB165 and including GB_Boe´ (S6 Appendix).
GENECLASS identified six individuals as first-generation migrants using the Lh/Lmax
statis-tic: one female sampled in Cantanhez with an origin in Cufada, one female sampled in Cufada with an origin in Cantanhez, two males sampled in Cufada with an origin in Boe´), and two males sampled in Boe´ with an origin in Cufada. Of the six migrants, one male (sampled in Cufada in Sr. Soares 1 site with an origin in Boe´) was identified assuming that the source popu-lation might not have been sampled. The first-generation migrant males from Boe´ sampled in
GB_Cufada were assigned to cluster 2 in STRUCTURE analyses (qcluster2= 0.93 to 0.75),
which is the genetic unit mostly represented in GB_Boe´ (see Table C inS6 Appendixfor
com-parison between GENECLASS results and assignment using STRUCTURE).
Males and females differed in the distribution of assignment indexes in Cufada (two-tailed
U-test, P = 0.001);mAIcwas positive for females and negative for males (mAIcfemales= 0.54
andmAIcmales= -1.16), 11 out of 13 male genotypes with no missing data displayed negative
AIcvalues and males showed largervAIcthan females (vAIcfemales= 0.23 andvAIcmales= 0.37)
(Table B and Figures G, H and I inS6 Appendix).mAIcwas not significant for GB_Cantanhez
(S6 Appendix).
Comparative analyses at a 66 km scale between GB (human-dominated environment) and SEN (lower habitat fragmentation). When STRUCTURE was run using GB66, K = 1 was the solution with the largest Log-likelihood and with highest posterior probability
(poste-rior probabilityK1= 0.99) (Figure A inS7 Appendix).
For SEN66, K = 3 was the solution with the highest modal value in theΔK distribution, with
the largest Log-likelihood and with highest posterior probability (posterior probabilityK3= 1)
(Figure A inS7 Appendix). When K = 3, SEN66 is broadly clustered in GD+SI+CL+LK (cluster
1) and NK (cluster 2), and seven individuals from SI form cluster 3 (six males and one female,
average qcluster 3= 0.86, q varying between 0.79 and 0.93) (Figure B inS7 Appendix). We
sus-pected that the higher genetic similarity of the seven individuals forming cluster 3 biased the analysis. After removing those samples, we re-ran STRUCTURE using parameters set as before using N = 158 genotypes (67 females and 91 males). K = 2 was found to be the most probable
clustering solution (highest modal value in theΔK distribution, the largest Log-likelihood and
with posterior probabilityK = 2= 1) (Figures C and D inS7 Appendix). The plot of ranked
aver-aged partial membership q of each individual to clusters was discontinuous between 0.78 and
0.64 for cluster 2 and was nearly continuous between 0.68 and 1 for cluster 1 (Figure E inS7
Appendix). We assigned individuals to the respective genetic clusters if the averaged q>0.75
and considered admixed between clusters if 0<q<0.75.
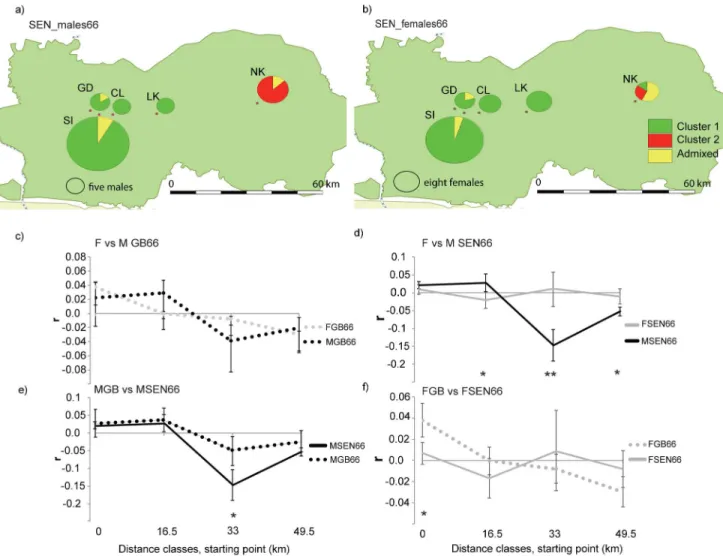
Males in SEN66 showed a stronger genetic structure when compared to females (Figure D inS7 Appendix;Fig 3a and 3b). The sampling sites GD+SI+CL+LK comprise 100% of males
assigned to cluster 1 (70 males, qcluster 1 average= 0.96 varying between 0.99 and 0.77) and five
admixed males, whereas NK harbour 100% of the males assigned to cluster 2 (qcluster 2 average=
0.89 varying between 0.94 and 0.78) and two admixed males (Table A inS7 Appendix;Fig 3a
and 3b). In contrast for females, NK harbour females assigned to both genetic units (cluster 1:
one female, qcluster 1= 0.95, cluster 2: two females, qcluster 2 average= 0.83 varying between 0.87
and 0.79) and admixed individuals (Table A inS7 Appendix;Fig 3a and 3b).
For GB, no difference was detected between males and females in the global spatial autocor-relation pattern in a spatial scale of 66 km or in every single distance classes considered (Total
ωfor data = 4.81, P = 0.30; single classes: t2[0–16.5 km[= 0.38, P = 0.56; t2[16.5–33 km[= 2.29,
P = 0.17; t2[33–49.5[= 2.0, P = 0.16; t2[49.5–66[= 0.14, P = 0.74) (Fig 3c). For both sexes, significant
and [16.5–33 [km for males) and significant negative spatial autocorrelation was found at dis-tances representing pairwise comparisons between GB_Cantanhez and GB_Cufada ([33–49.5
[and [49.6–66 [km for males and [49.5–66 [km for females) (Figure F inS7 Appendix;Fig 3c).
In contrast for SEN66, males and females differed in the spatial autocorrelation pattern
(Totalωfor data = 20.21, P = 0.0001;Fig 3d). In SEN, both sexes displayed significant positive
spatial autocorrelation at shorter distances classes (Figure F inS7 Appendix;Fig 3d) but males
were significantly more similar than females at [16.5–33 [km (t2[16.5–33 km[= 6.63, P = 0.01;
males[16.5–33 km[:r= 0.022, P = 0.0001; females[16.5–33 km[:r= - 0.014, P = 0.008) and
signifi-cantly more dissimilar at [33–66 [km (t2[33–49.5 km[= 16.8, P = 0.0002, males[33–49.5 km[:r=
Fig 3. Population structure for males and females in GB and SEN at 66 km. aandbshows the proportion of males (a) and females (b) of each sampling site in Senegal (GD—Gue Damantan, SI—Simenti, CL—Camp Lion, LK—Lingue Kountou, and NK—Niokolo) assigned to each of two clusters identified by STRUCTURE (97 males and 68 females, assigned when q>0.75 and considered admixed when 0<q<0.75).c,d,e, andfshows the spatial autocorrelation correlograms of the multiclass tests: c) GB females (FGB66, dashed grey line) vs. males (MGB66, dashed black line) (npairwise comparisons:
[0–16.5[ = 788, [16.5–33[ = 993, [33–49.5[ = 758, [49.5–66[ = 828); d) SEN females (FSEN66, bold grey line) vs. males (MSEN66 bold black line) (npairwise comparisons: [0–16.5[ = 4468, [16.5–33[ = 809, [33–49.5[ = 131, [51–66[ = 1526); e) Males in GB (MGB66, dashed black line) vs. males in SEN
(MSEN66, bold black line) (npairwise comparisons: [0–16.5[ = 3187, [16.5–33[ = 585, [33–49.5] = 203, [49.5–66[ = 1347), and f) Females in GB (FGB66, dashed
grey line) vs. females in SEN (FSEN66, bold grey line) (npairwise comparisons: [0–16.5[ = 2069, [16.5–33[ = 1217, [34–49.5[ = 686, [49.5–66[ = 1007). The
y-axis shows the autocorrelation coefficientrmeasuring genetic similarity (r>0) or dissimilarity (r<0) between pairs of individuals separated by four distance classes (X-axis: 0 to 49.5 km, starting point). Significant differences for individual distance classes are highlighted:P<0.05, P<0.001. The bootstrapped 95% error bars are shown. The correlagrams d and f are significantly different in the overall spatial autocorrelation pattern (d—Totalωfor data = 20.21, P = 0.0001; f—Totalωfor data = 11.1, P = 0.004).
- 0.11, P = 0.0001, females[33–49.5 km[:r= 0.011, P = 0.32; t2[49.5–66 km[= 8.1, P = 0.004,
males[49.5–66 km[:r= - 0.039, P = 0.0001; females[49.5–66 km[:r= - 0.008, P = 0.08) (Figure F in
S7 Appendix;Fig 3d).
We compared the spatial autocorrelation of each sex between GB66 and SEN66. For males, the test for heterogeneity did not detect a difference in the overall spatial autocorrelation
pat-tern and in three of the four single distance classes considered (Totalωfor data = 5.6, P = 0.12,
single classes: t2[0–16.5 km[= 0.048, P = 0.84; t2[16.5–33 km[= 0.085, P = 0.80; t2[49.5–66[= 0.70,
P = 0.48) (Fig 3e). However, between 33 and 49.5 km, GB66 males were significantly more
sim-ilar than SEN66 males, although not reaching positive autocorrelation (t2[33–49.5[= 6.04,
P = 0.011, males GB[33–49.5[:r= - 0.04 and males SEN[33–49.5[:r= - 0.11). In contrast, the spatial
correlogram was significantly different between females from GB66 and SEN66 (Totalωfor
data = 11.1, P = 0.004) (Fig 3f). When compared to SEN66 females, GB66 females were more
similar at shorter distances (t2[0–16.5 km[: = 9.85, P = 0.002,rfemales_GB= 0.04,rfemales_SEN=
0.006).
ThemAIcstatistic did not differ significantly between males and females in SEN.
Comparative analyses at a 26 km scale within the limits of protected areas in GB and SEN (i.e., lower habitat fragmentation). In SEN26, females displayed significant positive autocorrelation in distance classes representing comparisons between samples collected in
neighbouring groups (females[0–8.66[:r= 0.004 P = 0.005). For GB, only females in
Cantan-hez26 displayed significant autocorrelation in distance classes considered; significant positive autocorrelation between neighbouring groups and significant negative autocorrelation at larger distances, which mainly includes pairwise comparisons from inside and outside the
Peninsula of Cantanhez (Figure G inS7 Appendix).
Discussion
Primate dispersal patterns may change in populations inhabiting human-dominated habitats. We assessed the directionality and extent of sex-biased gene flow using molecular data to investigate dispersal patterns in Guinea baboons (Papio papio) at three different geographic scales and compared two closely related populations—Guinea-Bissau (fragmented distribu-tion, human-dominated habitat) and Senegal (continuous distribudistribu-tion, protected area).
The genetic population structure estimated for a large geographical scale in GB, which included three geographical distinct sub-populations populations separated by a maximum distance linear distance of 165 km (GB_Cantanhez, GB_Cufada and GB_Boe´), suggested a pat-tern of female-mediated gene flow across large distances (Table 1). This result is in agreement with the pattern estimated using maternally transmitted mitochondrial DNA at the same geo-graphic scale [25]: with the most frequent mtDNA haplotypes shared between GB_Cantanhez, GB_Cufada and GB_Boe´, the geographic distribution of haplotypes being uncorrelated with sampling locations and significant genetic similarity being detected at larger geographic dis-tances. Female-biased gene flow was also found for Senegal and using data of the whole
distri-bution of the species [28,29].
Additionally, we found evidence for contact between genetically differentiated males at GB_Cufada (Table 1). GB_Cufada was previously found to be a contact zone between geneti-cally differentiated units [25] but in this study, we identified males sampled at GB_Cufada that could be assigned with a high probability to the genetic unit mostly represented approximately
100 km apart using STRUCTURE or that had a negativeAIcand thus had a low probability of
being assigned to the population of origin. This result contrasts with GB_Cantanhez, where all
the males were assigned to the same genetic unit and 64% displayed a positiveAIc.
and 21 genotypes, respectively, when 50 individuals is the minimum sample size recom-mended, [62]), the analyses detecting first-generation migrants identified two males sampled in Cufada with an origin in Boe´ and two males sampled in Boe´ with an origin in Cufada. The immigrant male from Boe´ sampled in GB_Cufada and identified assuming a more restrictive migration rate harboured a mtDNA haplotype with a high frequency in GB_Boe´ [25] and was assigned to the genetic unit mostly represented in GB_Boe´ with a high probability (i.e.,
q>0.90). Taken together, these results suggest male-mediated gene flow in southern
Guinea-Bissau between GB_Cufada and Boe´ or a genetically close population (Table 1).
The result of male-mediated gene flow in southern Guinea-Bissau should be treated cau-tiously. Firstly, since faecal sampling comprised unidentified individuals, we cannot be sure that the putative male immigrants dispersed during their lifetime; some males could be pre-dispersal individuals, could be the offspring of immigrant lactating females [64] or admixed individuals originated from mating between immigrant females and resident males. For instance, 41% of the males sampled in GB_Cufada were classified as having admixed ancestry, which might explain the contrast in the proportion of males identified as immigrants in
differ-ent analyses (e.g. the great majority of males at GB_Cufada displayed a negativeAIcbut a
smaller proportion were assigned to the differentiated cluster 2 using STRUCTURE,Fig 2).
Secondly, the analyses would benefit from a larger sample of males. Although non-invasive faecal sampling of unidentified and unobserved individuals was applied in Senegal and Guinea-Bissau, a lower proportion of males were sampled in GB_Cantanhez and GB_Cufada (0.34 and 0.33, respectively) when compared to Senegal and GB_Boe´ (0.59 and 0.62, respec-tively). Since ADO between studies did not vary significantly, high ADO is unlikely to result in a failure to detect male individuals in Guinea-Bissau. A more likely explanation is the negative demographic consequences of intensive hunting practices towards males in Guinea-Bissau. Hunters have stated during interviews that they target male baboons first, due to their larger
body size and consequent higher economic value [37,65]. Male carcasses are 60% more
expen-sive than females and other primate species at Guinea-Bissau bushmeat markets [24]. How-ever, a lack of quantitative data from Guinea-Bissau bushmeat markets prevents us from confirming of the male-directed hunting hypothesis. Thirdly, comparison between sex-specific genetic markers (i.e., mtDNA and Y-chromosome associated markers) and autosomal micro-satellites loci allows for the investigation of male-specific population structure and to explicitly test male-biased gene flow in Guinea-Bissau. However, genetic variation of the Y chromosome seems to be low in the Guinea baboon and a set of variable Y-linked chromosomal microsatel-lite markers is not available [33]. Nevertheless, considering that we randomly sampled double
the number of females in GB_Cufada than males (34 females and 17 males,S1 Appendix) and
that females and males were assigned to cluster 2 in similar proportions (12%vs. 18%,
respec-tively) in that locality, our results suggest that the population of baboons at GB_Cufada com-prises a proportion of genetically differentiated males (Table 1).
Our study analysed intra-specific variation in dispersal patterns using individual-based molecular tools and a comparative framework, an approach that has been applied successfully
in a variety of species and landscape contexts (e.g. [13,66–67]). However, few studies have
been able to analyse direct dispersal or have attempted to compare variation in dispersal for populations under different levels of anthropogenic pressure at comparable spatial scales [68]. Molecular tools can be a solution in such cases but a combination of factors related to sam-pling design (inclusion of pre-dispersers in the dataset, small sample size and a different geo-graphic distance between sites) and differences between sexes in dispersal rates can confound
the detection of sex-biased dispersal [31,32].
and geographic scale(s) but methodological constraints related to the study of wild primates may limit the generalization of our conclusions to other populations. Firstly, the inclusion of a single site in an un-fragmented population (i.e., Senegal) limits the comparison of gene flow patterns between fragmented and non-fragmented populations to a maximum of 66 km with the consequent exclusion of genotypes from the GB165 sub-set, which in turn, may have an effect in the characterization of the patterns of sex-specific gene flow. Spatial autocorrelation for different sub-sets of samples (e.g. GB165, GB_Cufada and GB_Cantanhez only, and GB66)
is slightly different, although the overall pattern remained the same (Figure E inS6 Appendix).
Also, the genetic structure estimated using STRUCTURE in GB165 was not detected using the GB66 sub-set, possibly because of the lower number of genetically differentiated individuals which remained in the analyses using GB66 [69]. For instance, Guebombol sampling site was excluded from the comparative analyses because was distanced more than 66 km of sampling sites in GB_Cantanhez but was formed exclusively by males assigned to the genetic unit most frequently represented in GB_Boe´ (Fig 2a). These results suggest that using GB66 sub-set alone can lead to incomplete inference. However, it is worth highlighting that the IUCN’s Near threatenedGuinea baboon suffered a widespread decline in the last thirty years [35,36] and that the current conservation status of the populations outside protected areas is unknown [70]. Therefore, the likelihood of locating a second continuously distributed population of a comparably large range in Senegal (i.e., for 165 km) is low. Secondly, the statistical power of detecting a sex-bias in dispersal is limited by the inclusion of pre-dispersing individuals in both datasets [32]. However, a clear signal of sex-biased dispersal was not erased in Senegal and it is unlikely that the Guinea-Bissau population include a significantly greater number of pre-dispersing individuals than Senegal. Therefore, we conclude that, by contrasting the differ-ences in rate and extent of sex-mediated gene flow in Guinea-Bissau and Senegal, we are likely to be highlighting an important biological phenomenon.
For the smaller spatial scale of 66 km, for which a comparison with Senegal was performed, we could not find evidence of sex-biased dispersal in Guinea-Bissau. Both males and females at GB66 display a spatial autocorrelation pattern expected for the philopatric sex (Table 1). These results contrast with the clear pattern of female-biased dispersal found for Senegal for the same geographic scale. When comparing the spatial autocorrelation of each sex between GB66 and SEN66, we could observe that (1) males of the two populations show a similar spatial genetic pattern, although SEN66 males show a stronger genetic structure at larger distances and (2) females in Guinea-Bissau are significantly more similar than females in Senegal at closer distances.
Restricted gene flow for males and females across human-dominated areas between GB_Cufada and GB_Cantanhez do not disagree with the pattern of female-biased mediated gene flow found at a broad scale in Guinea-Bissau and the evidence of contact between geneti-cally differentiated males in GB_Cufada. In all the spatial autocorrelation analyses performed, the pattern of limited dispersal between GB_Cufada and GB_Cantanhez is clear for both sexes. SEN66 males show a stronger genetic structure than GB66 males but we inferred hindered male gene flow between GB_Cufada and GB_Cantanhez. In Senegal, males show a genetic structure which agrees with the geographic location of sampling sites (GD+SI+CL+LK and NK,Fig 3a) whereas we found that GB_Cufada is most likely formed by mixture of genetically differentiated males, a proportion of which is genetically similar to GB_Cantanhez males (Fig 2a). This result explains the similar genetic structure pattern between males in Guinea-Bissau and Senegal but weaker genetic structure for Guinea-Bissau males at larger distances when compared to Senegal males. Taken together and considering the pattern of historical
female-mediated gene flow estimated by past studies [23,25], our study suggests a modification in
broad geographical scale to i) male-mediated gene flow towards GB_Cufada from a differenti-ated population genetically similar to GB_Boe´, and ii) a lack of sex bias in dispersal at a smaller scale between GB_Cufada and GB_Cantanhez.
This apparent alteration in dispersal patterns can be explained by behavioral responses to
fragmentation. Anthropogenic hunting and deforestation at southern Guinea-Bissau [22,24,
25] may have altered population density, sex ratio, and age structure and/or induced defensive behaviors, such as avoidance of specific areas and altered ranging patterns [37], changes which
potentially interfere with dispersal [2,5]. Foraging and social grouping in Guinea baboons
vary according to environmental contexts [26,71] and, most likely, to anthropogenic
environ-mental changes, given the importance of these variables in restricting the species occurrence [70]. Other empirical studies found exceptions to the pattern defined for the target species in
anthropogenic environments (e.g.Pongo pygmaeus[72];Ateles sp. [13]), including for primate
species facing the same type of threats in Guinea-Bissau (Colobus polykomosandPiliocolobus
temminckii[67] andPan troglodytes verus[73]). However, considering that many
socio-eco-logical features of the Guinea baboon remain unknown (Senegal: [26,29,38], Guinea-Bissau:
[23,25]) we cannot exclude the possibility that the species may display population-specific plasticity in dispersal and gene flow mediated by both sexes may not be atypical. Three possible non-exclusive scenarios to explain gene flow mediated by both sexes in southern Guinea-Bis-sau that could be tested:
1. Firstly, if we consider that the difference in the proportion of genetically differentiated indi-viduals co-existing in Cufada between males and females is a sampling artefact, our results could be interpreted as if entire social groups moved to the Cufada Lagoons Natural Park. One reason for the displacement of entire social groups could be the high mortality risk
associated to human disturbance [74,75], which is probable outside protected areas in
Guinea-Bissau [22].
2. Secondly, while Guinea-Bissau females might be displaying the same propensity for dis-persal as Senegal females, males in Guinea-Bissau may have recently started to disperse towards GB_Cufada from GB_Boe´ or a genetically similar population. One reason could be a lower number of males at GB_Cufada, caused by a preference to first hunt male
baboons due to a higher monetary return [24,37,75]. The consequent reduction in
num-ber of males could lower the competition for females and food resources and thus, induce
male immigration towards the vacant home ranges (“vacuum effect” [76];e.g.Panthera
leo[77]). Although such an effect has not been reported for primate species, sex-specific
life history strategies, unequal intra-sexual competition and different sensitivity to envi-ronmental factors between the sexes have been related to a sex-bias in dispersal for other species [5]. Furthermore, past studies have associated movements of male baboons towards areas with greater accessibility to cycling females to improve their reproductive
opportunities. For instance, in some populations ofPapio hamadryas, a species in
which dispersal is described to be female-biased [78], males sometimes disperse to neigh-bouring olive baboon groups (Papio anubis) due to a higher success in acquiring females [79].
3. Finally, we need to consider that the differences in dispersal patterns between Guinea-Bis-sau and Senegal could have been accumulated during their evolutionary history. For spe-cies that have historically expanded their range, which could be the case of the Guinea baboon [80], both theoretical considerations and simulation experiments predict a greater abundance of individuals with higher dispersal capacity at the margins of the distribution
of spatial gradients of dispersal capacity may last for a considerable amount of time after the species is settled in the new range [82]. Thus, our results may also imply an intrinsic higher dispersal capacity of the Guinea-Bissau individuals as a response to changes in the environment, a characteristic that may have been selected by evolutionary mechanisms. Data on dispersal patterns from other marginal populations are needed to test this hypothesis.
Our results do not suggest an absence of gene flow but female dispersal between GB_Cu-fada and GB_Cantanhez seem to have been modestly or recently restricted when compared to the same geographic scale in Senegal. One first generation female migrant with an origin in GB_Cufada sampled in GB_Cantanhez was detected, which suggest current gene flow between those localities. However, that specific female was sampled in the marginal area of Cantanhez Woodlands National Park. Significant genetic dissimilarity between females
from inside and outside the Peninsula of Cantanhez (Figure G inS7 Appendix) suggest
lower levels of gene flow across the land bridge connecting the Peninsula to mainland Guinea-Bissau. Although levels of inbreeding do not seem to be particularly high,
GB_Can-tanhez show a tendency of lower levels of genetic diversity (Table C inS5 Appendix).
Over-all, these results suggest a modest level of isolation of the baboons’ population from the Peninsula of Cantanhez, which may have important implications for their conservation. Considering the long generation times of primate species, the genetic consequences of a recent restriction in gene flow between GB_Cufada and GB_Cantanhez could have just started to manifest.
Conservation recommendations
The long-term persistence of populations inhabiting human-fragmented landscapes depends
on the ability of individuals to move between fragments and to reproduce [7,83]. Particularly
for species in which dispersal is female-biased, such as the Guinea baboon, fragmentation, and isolation of groups across the humanized landscape outside protected areas in GB, can greatly
limit female’s movements between groups [2,3,14] and potentially lead to a reduction of gene
flow between sub-populations or even isolation. As baboons are already rarely seen outside protected areas and habitat loss and hunting practices are prone to increase, gene flow between GB_Cantanhez and GB_Cufada could become more restricted and most importantly,
GB_Cantanhez could become isolated. Currently, large areas of croplands and a number of vil-lages occupy the narrow land bridge that connects Cantanhez Peninsula to GB mainland [84]. Local villagers persecute and hunt primates and other species to avoid production losses in croplands [84] (MJ Ferreira da Silva, personal observation). Such activities have the potential to become a barrier to dispersing individuals leaving or entering the peninsula. Isolated popu-lations have a higher risk of extinction; if mating opportunities became limited to kin and inbreeding increases, isolated populations may suffer from a reduction of reduction of
repro-ductive fitness [7,10,85]. To avoid the isolation of the GB_Cantanhez population, we
Conclusions and future work
We have shown intraspecific variability in dispersal patterns in a primate species that is likely caused by anthropogenic fragmentation. Our results suggest some behavioral plasticity of the species to adjust to new environmental conditions. However, the severity of anthropogenic pressures could potentially overwhelm its ability to persist. We highlight that the genetic con-sequences of altered dispersal patterns should be evaluated more regularly and considered more thoroughly in conservation management plans.
Future work could investigate dispersal patterns for larger distances than 66 km in un-frag-mented habitats. Moreover, long-distanced dispersal patterns could be investigated in other locations to assess whether the pattern of contact between genetically differentiated males is common. Given that the Guinea baboon is distributed across an increasingly smaller and frag-mented area in West African countries [35] and that localized extintions are probable for the
Guinea baboon populations occurring outside protected areas [23,36], we stress the
impor-tance of studies conducted outside protected areas.
Supporting information
S1 Appendix. Sampling sites and genotypes analysed.
(PDF)
S2 Appendix. Description of PCRs protocols and genotyping process.
(PDF)
S3 Appendix. Sex-determination protocol.
(PDF)
S4 Appendix. Description of sub-sets of samples used to test sex-bias in dispersal.
(PDF)
S5 Appendix. Genetic diversity.
(PDF)
S6 Appendix. Sex-specific genetic structure.
(PDF)
S7 Appendix. Spatial autocorrelation analyses conducted at 66 and 26 km.
(PDF)
Acknowledgments
Field assistants in Guinea-Bissau—M. Soares and M. Ture´, park guides and guards, the DARI
project, the NGOs CHIMBO and AD, the Guinea-Bissau governmental agenciesDireção Geral
de Florestas e FaunaandInstituto da Biodiversidade e Áreas Protegidas(IBAP) for samples
exportation permits and logistical support during fieldwork,Instituto Nacional de Estudos e
PesquisasandGabinete de Planificação Costeirafor GIS maps, RAMA pharmacy andCafé au
laitfor in-kind sponsorship, C. Schwarz, M. Nanqui, R. Dixe, C. Pereira and J. Huet for
logisti-cal support in Bissau, C. Roos (DPZ) and MWB lab members for lab work support, and J.
Tor-res for map design. SENDiréction des Parcs NationauxandMinistère de l´Environnement et de