Paraquat poisoning: an experimental
model of dose-dependent acute lung
injury due to surfactant dysfunction
Laboratório de Poluição Atmosférica Experimental, Faculdade de Medicina, Universidade de São Paulo, São Paulo, SP, Brasil
M.F.R. Silva and P.H.N. Saldiva
Abstract
Since the most characteristic feature of paraquat poisoning is lung damage, a prospective controlled study was performed on excised rat lungs in order to estimate the intensity of lesion after different doses. Twenty-five male, 2-3-month-old non-SPF Wistar rats, divided into 5 groups, received paraquat dichloride in a single intraperitoneal injec-tion (0, 1, 5, 25, or 50 mg/kg body weight) 24 h before the experiment. Static pressure-volume (PV) curves were performed in air- and saline-filled lungs; an estimator of surface tension and tissue works was computed by integrating the area of both curves and reported as work/ ml of volume displacement. Paraquat induced a dose-dependent in-crease of inspiratory surface tension work that reached a significant two-fold order of magnitude for 25 and 50 mg/kg body weight (P<0.05, ANOVA), sparing lung tissue. This kind of lesion was probably due to functional abnormalities of the surfactant system, as was shown by the increase in the hysteresis of the paraquat groups at the highest doses. Hence, paraquat poisoning provides a suitable model of acute lung injury with alveolar instability that can be easily used in experimental protocols of mechanical ventilation.
Correspondence
P.H.N. Saldiva
Departamento de Patologia Faculdade de Medicina, USP Av. Dr. Arnaldo, 455 01246-903 São Paulo, SP Brasil
Fax: 55 (011) 3064-2744 E-mail: [email protected]
Research supported by CAPES. Publication supported by FAPESP.
Received July 22, 1997 Accepted January 12, 1998
Key words
•Paraquat
•Experimental model
•Acute lung injury
•Pressure-volume curve
•Respiratory work
Introduction
Paraquat, a herbicide widely used in agri-culture, has caused many deaths due to sui-cidal or accidental ingestion. The primary damage in mammals occurs in the lung. The pathogenesis of paraquat-induced damage to alveolar structure is related to its accumu-lation in type II pneumocytes (1). The con-centration of paraquat in the lung after expo-sure rises progressively to several times that in plasma or in any other organ. Besides pulmonary insufficiency, central nervous derangements and hepatic and renal tubular lesions may also be present, but such toxicity
is observed only after intoxication with high doses. The degree of lung damage seems to be dose-dependent (2), is enhanced by high oxygen concentrations (3) and persists in spite of lowering paraquat levels by hemo-perfusion (1).
tension (e.g., respiratory distress syndrome).
Due to its simplicity (single ip
adminis-tration), low cost and rapid effect, paraquat intoxication is a suitable model of acute lung injury to be used in protocols of mechanical ventilation. In the present study we focused on the dose-response effect of paraquat to determine whether it is possible to obtain pulmonary lesions of increasing severity, and on separating the participation of tissue and alveolar surface tension in the acute lesion.
Material and Methods
Experimental groups
Paraquat dichloride dissolved in saline solution (0.9% NaCl) was administered in a single intraperitoneal injection to non-SPF Wistar rats weighing 213.62 ± 22.50 g. Doses ranged from zero to 50 mg/kg body weight and the animals were studied 24 h later. Twenty-nine rats were allocated to 5 groups: control (N = 9) and 1 mg/kg, 5 mg/kg, 25 mg/ kg and 50 mg/kg body weight of paraquat (5 animals/group).
Lung preparation and apparatus
The animals were anesthetized with pen-tobarbital sodium (30 mg/kg body weight) and sacrificed by exsanguination via the ab-dominal aorta. The lungs were surgically exposed and allowed to collapse freely, and
removed en bloc. The heart was dissected
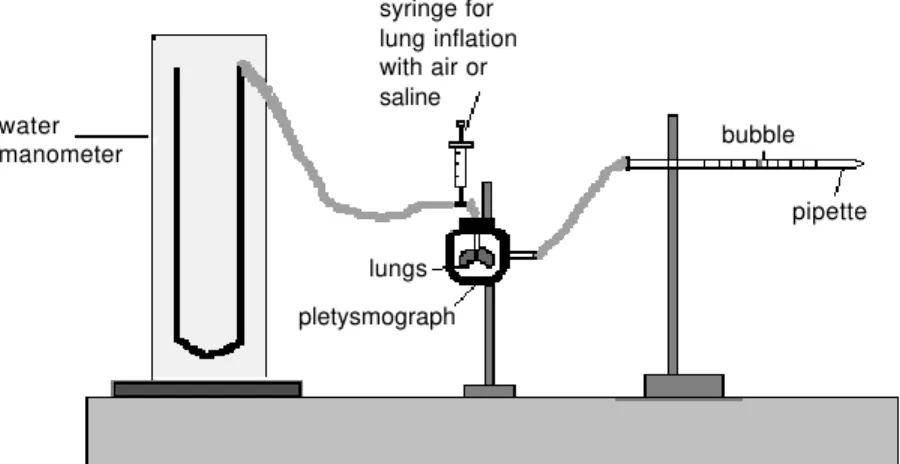
away. In order to measure the pressure-vol-ume relationship, the lungs were placed in a 280-ml plethysmograph connected to a graded pipette. The tracheal cannula was connected to a 20-ml syringe and to a small vertical column partially filled with water. When lungs were inflated with air from the syringe, the volume was measured by the displacement of a detergent bubble in the pipette (Figure 1). Initially, lungs were sub-jected to three previous inflations up to 30
cmH2O and then allowed to return to their
resting volume. Lungs were filled with air in small increments of volume until the pres-sure-volume relationship became non-linear (i.e., small increments of volume causing a large increase in pressure). Starting from this point, defined as the maximal inflation point, volume was withdrawn from the lungs in small steps until the minimal point (resting volume) was reached. Thirty seconds were allowed for equilibration during each step before tracheal pressure was recorded. This procedure has been employed in the litera-water
manometer
syringe for lung inflation with air or saline
bubble
pipette
lungs
pletysmograph
Figure 1 - Schematic representation of the system used to construct the PV curve for the excised rat lungs.
Volume (ml)
Paraquat Control
Pressure (cmH2O) 15
10
5
0
0 5 10 15 20 25 30 35
ture to obtain a pulmonary volume (PV) curve (4-6). For experiments with fluid-filled lungs, saline was injected through the can-nula and the same procedure was repeated.
Respiratory work estimation
The effects of paraquat were computed by integrating the PV curve area at inflation and deflation to obtain the inspiratory and expiratory work, respectively. An estimator of tissue work corresponds to the integration of the PV curve obtained with saline. Results are reported as work/ml of volume displace-ment, i.e, by dividing the areas of the PV curve by the corresponding overall variation of volume.
Statistical analysis
Values are reported as means ± SEM. The statistical significance of tissue and ten-sion works/ml was determined by ANOVA with a P value <0.05 accepted as significant,
with post hoc assessment of differences by
means of the Student-Newman-Keuls test. Logarithmic transformation of the measured variables was employed in order to stabilize variance.
Results
Respiratory work
Figure 2 shows representative PV curves obtained in air-filled lungs of a control rat (number 4) and in a 25-mg/kg weight paraquat-intoxicated (number 1) rat. There was a shift to the right of the inspiratory limb as well as an increase in the area of hyster-esis in the paraquat-intoxicated animal. The differences in hysteresis between control and paraquat-intoxicated animals virtually dis-appeared in the saline-filled lungs (Figure 3). Interestingly enough, the animal treated with paraquat was able to receive a larger amount of volume in comparison to the
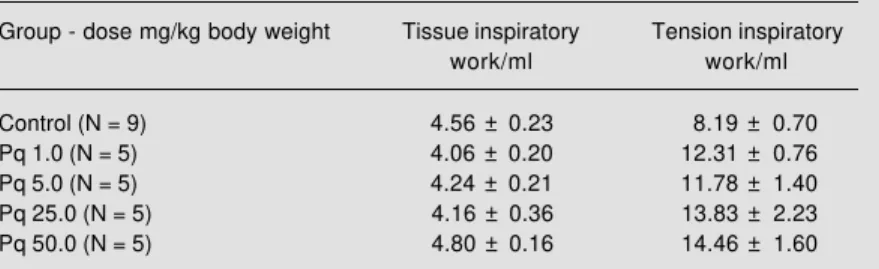
con-Table 1 - Inspiratory work/ml attributable to tissue and surface tension for the control group and paraquat (Pq) group.
Data are reported as means ± SEM.
Group - dose mg/kg body weight Tissue inspiratory Tension inspiratory work/ml work/ml
Control (N = 9) 4.56 ± 0.23 8.19 ± 0.70 Pq 1.0 (N = 5) 4.06 ± 0.20 12.31 ± 0.76 Pq 5.0 (N = 5) 4.24 ± 0.21 11.78 ± 1.40 Pq 25.0 (N = 5) 4.16 ± 0.36 13.83 ± 2.23 Pq 50.0 (N = 5) 4.80 ± 0.16 14.46 ± 1.60 Figure 3 - Static pressure-volume curves obtained for saline-filled lungs of a control rat and a paraquat (25 mg/kg body weight)-intoxicated rat. Hysteresis was similar in both animals. Interestingly enough, the paraquat-treated animal was able to receive a larger amount of volume in comparison to the control rat.
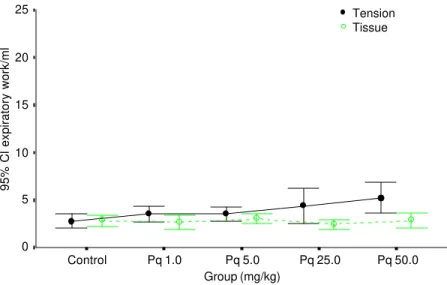
trol rat. Although this behavior was not ob-served for all paraquat-treated animals, this finding may suggest that tissue viscoelastic properties might be somewhat affected in some animals by the shear stress caused by previous air breathing in a context of me-chanical instability. Nonsignificant changes of tissue elasticity were observed for all doses of paraquat employed, whereas in-spiratory work due to surface properties ex-hibited a dose-dependent increase (Table 1 and Figure 4). Expiratory work was also significantly elevated in the 50-mg/kg body weight paraquat-intoxicated group (Table 2 and Figure 5).
20 15
10 5
0
Paraquat Control
Volume (ml)
Pressure (cmH2O) 15
10
5
0
Discussion
The degree of paraquat poisoning de-pends on the amount used; however, the most characteristic feature is lung damage, which is usually the cause of death. Paraquat produces oxygen-derived free radicals and severely injures the lungs by accumulating in type II pneumocytes. This lesion suggests that paraquat may decrease surfactant pro-duction besides increasing microvascular permeability that leads to acute protein-rich edema formation. Individuals surviving this acute phase usually show a period of im-provement, which is the prelude to
irrevers-ible lung damage. Smith et al.(7) have
de-scribed the pathogenesis and structure of paraquat-induced fibrosis in rats following acute and chronic administration, using doses from 20 to 100 mg/kg body weight. They demonstrated that in the development of the irreversible lesion there is an early stage of edema and disintegration of pulmonary epi-thelium, followed by an infiltration of profi-broblasts resulting in intra-alveolar fibrosis. In the first phase, there is also a destructive effect on type I and type II pneumocytes with formation of edema and infiltration of in-flammatory cells, characterizing the pres-ence of alveolitis. The second phase, if death did not occur in the acute state, is a repara-tive lesion with extensive fibrosis of the alveolar tissue, that may also lead to death from hypoxia.
Many theories have been proposed to describe the effect of interface tensions on the alveolar surface and the ability of the alveoli to coexist in a stable configuration. The surface tension due to elastic fibers and to the air-liquid interface forces the lung to collapse and a surfactant antagonizes this recoil pressure. It is well established that a high surface tension within air spaces tends to make them collapse, and that a low sur-face tension conferred by a surfactant is necessary if alveoli are to remain expanded at low lung volumes (8).
l
c
p
Tension Tissue
95% Cl inspiratory work/ml
Group (mg/kg) 25
20
15
0
Control Pq 1.0 Pq 5.0 Pq 25.0
10
5
Pq 50.0
Figure 4 - Mean values (circles) and corresponding standard errors (lines) of the 95% confidence interval (CI) of inspiratory work attributable to surface tension and tissue forces in control animals and in animals submitted to different doses of paraquat (Pq) intoxication.
Table 2 - Expiratory work/ml attributable to tissue and surface tension for the control group and paraquat (Pq) group.
Data are reported as means ± SEM.
Group - dose mg/kg body weight Tissue expiratory Tension expiratory work/ml work/ml
Control (N = 9) 2.84 ± 0.28 2.77 ± 0.32 Pq 1.0 (N = 5) 2.69 ± 0.26 3.52 ± 0.31 Pq 5.0 (N = 5) 3.05 ± 0.19 3.50 ± 0.27 Pq 25.0 (N = 5) 2.44 ± 0.20 4.40 ± 0.69 Pq 50.0 (N = 5) 2.83 ± 0.28 5.24 ± 0.58 50 0 25 0
5 0 1 0
t l
95% Cl expiratory work/ml
Group (mg/kg)
c p
Tension Tissue 25
15
0
Control Pq 1.0 Pq 5.0 Pq 25.0
10
5
Pq 50.0 20
Hysteresis is the property whereby the pressures exerted by elastic recoil of the respiratory system are greater on inflation (inspiration) than on deflation (expiration) at the same volumes (9). A given volume must be shared by a smaller number of al-veoli (or alal-veoli of smaller size) during infla-tion than during deflainfla-tion, and therefore pres-sures during the inspiratory phase are higher than at expiration, completing a volume-pressure hysteresis loop. The area inside the static PV loop is indicative of the energy dissipated within the pulmonary parenchyma (10). This area has the dimension of work and is properly regarded as a component of the elastic work required to inflate the respi-ratory system. Since the critical opening pres-sure is inversely proportional to alveolar unit size, it follows that progressive recruitment of air spaces requires a continuously in-creasing pressure during inflation, which leads to high peak inspiratory pressures. Unpleating of alveolar walls and distention of septa also contribute to increments in inspiratory pressure (11). The inflation curve of the excised lung exhibits a “knee” on the inflation limb, meaning that rapid and nearly complete recruitment of lung units occurs at the “inflection point” of the curve. The PV curve allows analysis of the pulmonary sur-face forces since the difference between air-filled and saline-air-filled lungs is considered to be a result of surface tension. The tissue component of recoil pressure in the air-filled lung (deflation path) is similar to that of the saline-filled lung at the same volume (12). There is currently no standardized proce-dure for the construction of lung PV curves, and their shape may vary among different species (6).
The results of the present study indicate that acute paraquat intoxication in rats causes pulmonary lesions mainly due to surfactant dysfunction, sparing lung tissue, as shown in the PV curves obtained for air- and saline-filled lungs (Figures 2 and 3). Other models of acute lung injury have been described and have confirmed the effectiveness of the PV curve to study pulmonary mechanics (13,14). Both tension work and hysteresis loop were greater in the paraquat group, and the extent of alteration increased as larger doses were administered (Figure 4). In the inspiratory limb, pressures were much higher in the paraquat lung since the degree of collapse due to surfactant dysfunction was intense. Hysteresis was almost eliminated in the sa-line-filled lung in both groups, since it was mainly due to an alveolar surface film. Alter-ations of work due to surface active proper-ties were observed both during inspiration and expiration. However, inspiratory work due to tension was different from control starting at the lowest dose of paraquat. Expi-ratory work due to tension changed signifi-cantly only at the highest dose of paraquat (Figure 5). These results suggest that in-spiratory tension work is a more sensitive estimator of alveolar instability in paraquat poisoning.
References
1. Lewis C & Nemery B (1995). Pathophysi-ology and biochemical mechanisms of the pulmonary toxicity of paraquat. In: Bis-muth C & Hall AH (Editors), Drug and Chemical Toxicology. Paraquat Poisoning. Marcel Dekker, New York.
2. Delaval PM & Gillespie DJ (1985). Pulmo-nary dysfunction during paraquat-induced lung injury: A model of acute alveolar in-jury. Critical Care Medicine, 13: 1056-1060.
3. Manieri R, Bronzi R, Grilli A, Loffredo B, Data PG, Napolitano L & Felaco M (1990). Effect protecteur de l’hypoxygénation hyperbarique au cours de l’intoxication par le paraquat, chez le rat. Journal du Toxicologie Clinique et Experimentale, 10: 297-305.
4. Bachofen H, Schürch S, Urbinelli M & Weibel ER (1987). Relations among al-veolar surface tension, surface area, vol-ume, and recoil pressure. Journal of Ap-plied Physiology, 62: 1878-1887. 5. Sharp JT, Johnson FN, Goldberg NB &
Lith PV (1967). Hysteresis and stress ad-aptation in the human respiratory system. Journal of Applied Physiology, 23: 487-497.
6. Lum H & Mitzner W (1987). A species comparison of alveolar size and surface forces. Journal of Applied Physiology, 62: 1865-1871.
7. Smith P, Health D & Kay JM (1974). The pathogenesis and structure of paraquat-induced pulmonary fibrosis in rats. Jour-nal of Pathology, 114: 57-67.
8. Mead J, Takashima T & Leith D (1970). Stress distribution in lungs: a model of pulmonary elasticity. Journal of Applied Physiology, 28: 596-608.
9. Mead J, Whittenberger JL & Radford Jr EP (1957). Surface tension as a factor in pulmonary volume-pressure hysteresis. Journal of Applied Physiology, 10: 191-196.
10. Robatto FM, Romero PV, Fredberg JJ & Ludwig MS (1991). Contribution of quasi-static tissue hysteresis to the dynamic
alveolar pressure-volume loop. Journal of Applied Physiology, 70: 708-714. 11. Mercer RR, Laco JM & Crapo JD (1987).
Three-dimensional reconstruction of al-veoli in the rat lung for pressure-volume relationships. Journal of Applied Physiolo-gy, 62: 1480-1487.
12. Wilson TA (1982). Surface tension-surface area curves calculated from pressure-vol-ume loops. Journal of Applied Physiology, 53: 1512-1520.