SPATIAL VARIABILITY OF LEAF WETNESS DURATION IN
COTTON, COFFEE AND BANANA CROP CANOPIES
Eduardo Alvarez Santos1; Paulo Cesar Sentelhas2*; José Eduardo Macedo Pezzopane3; Luiz Roberto Angelocci2; José Eduardo Boffino Almeida Monteiro2
1
University of Guelph - Dept. of Land Resource Science, 50 Stone Road East - Guelph, Ontario, N1G 2W1, Canada.
2
USP/ESALQ - Depto. de Ciências Exatas, C.P. 9 - 13418-900 - Piracicaba, SP - Brasil. 3
UFES/CCA - Depto. de Ciências Florestais - Jerônimo Monteiro, ES - Brasil. *Corresponding author <[email protected]>
ABSTRACT: Despite the importance of leaf wetness duration for plant disease epidemiology, there has been little attention paid to research on how its variability relates to different cropping situations. The objective of this study was to evaluate the spatial variability of leaf wetness duration (LWD) in three crops, comparing these measurements with turfgrass LWD, obtained in a standard weather station. LWD was measured by electronic sensors in three crops with different canopy structures and leaf area: cotton, coffee and banana. For the cotton crop, cylindrical sensors were deployed at the lower third and on the top of the canopy, facing southwest. For the coffee crop, flat plate sensors were installed in the lower third of the canopy facing northeast and southwest; in the middle third facing northeast and southwest; and inside and on the top of the canopy. For the banana canopy, cylindrical sensors were used to measure LWD in the lower third of the canopy and in the upper third of the plant. Turfgrass LWD was simultaneously measured in a nearby standard weather station. The LWD showed different patterns of variation in the three crop canopies. For coffee plants, the longest LWD was found in the lower portions of the canopy; for the banana crop, the upper third of the canopy showed the longest LWD; whereas for the cotton crop no difference was observed between the top and lower third of the canopy. Turfgrass LWD presented a good relationship with LWD measured on the top or in the upper third of the crops. Thus, the estimate of crop LWD can be perfomed based on turfgrass LWD, this being a useful tool for plant disease management purposes for crops in which the longer LWD occurs at the upper canopy portion.
Key words: dew, microclimate, plant disease, warning systems
VARIABILIDADE ESPACIAL DA DURAÇÃO DO PERÍODO DE
MOLHAMENTO FOLIAR NAS CULTURAS DO ALGODÃO,
DO CAFÉ E DA BANANA
RESUMO: Apesar da importância da duração do período de molhamento para a epidemiologia de doenças de plantas, pouca atenção tem sido dada à sua variabilidade em diferentes posições da cultura. O objetivo deste estudo foi avaliar a variabilidade espacial da duração do período de molhamento (DPM) em três culturas, comparando-se as medidas obtidas com a DPM medida sobre gramado em um posto meteorológico padrão. A DPM foi medida por sensores eletrônicos em três culturas com diferentes estruturas de dosséis e áreas foliares: algodão, café e banana. Na cultura do algodão, os sensores cilídricos foram instalados no terço médio e no topo do dossel voltados para o sudoeste. Na cultura do café, sensores de placa foram instalados no terço inferior do dossel voltados para nordeste e sudoeste; no terço médio também voltados para nordeste e sudoeste; no interior e no topo do dossel. Na cultura da banana, sensores cilíndricos foram instalados nos terços inferior e superior da planta. A DPM sobre gramado foi simultaneamente medida em um posto meteorológico próximo às culturas. A DPM exibiu diferentes padrões de variação nas três culturas. Para o cafeeiro, a DPM mais longa foi observada nas partes mais baixas da planta; para a bananeira, o terço superior foi o que apresentou a maior DPM; enquanto que para a cultura do algodão não houve diferença entre o topo e o interior do dossel. A DPM medida sobre gramado apresentou boa correlação com a DPM medida no topo ou no terço superior das culturas. Dessa forma, pode-se estimar a DPM nas culturas a partir da DPM do gramado, sendo esta uma ferramenta muito útil para o manejo de doenças de plantas em culturas onde a DPM mais longa ocorre nas porções superiores do dossel.
Microclimate variables drive the processes of condensation and evaporation of water on vegetal sur-faces. Therefore, microclimatic conditions control wetness duration, allowing various portions of leaves and canopies to become wet and dry at different times, consequently leading to a spatial variability of LWD measurements (Huber & Gillespie, 1992). This spatial variability is an important aspect to be considered when measuring LWD in crops. In previous studies, measurements have been carried out just below or on the top of crop canopies (Francl & Panigrahi, 1997; Pedro & Gillespie, 1982; Sentelhas et al., 2004b). However, some authors show that the LWD spatial variability changes from one crop to another. Wittich (1995) observed that LWD was longer at the top than at the bottom of an apple canopy. Sentelhas et al. (2005) showed that LWD lasted one hour longer at the top of apple and maize canopies than at the bottom; but no difference was found between LWD measured at different positions of young coffee plants and grape canopies.
These differences in LWD values have some practical implications in disease warning systems. Us-ing the Plasmo model to simulate grapevine downy mildew severity, Dalla Marta et al. (2004) observed that estimated severity using LWD data obtained inside the canopy was lower than the actual severity, whereas the use of LWD data obtained outside the canopy led to a disease severity overestimation.
Sentelhas et al. (2005) proposed to estimate the longest LWD in crop canopies using LWD data ob-tained in nearby standard weather stations. Their re-sults showed that by using this approach it is possible to obtain estimates reasonable enough for disease warning systems. Another advantage of this method-ology is to solve operational problems related to the measurements of LWD in crops.
Considering the importance of spatial variabil-ity of LWD for plant disease occurrence and control,
cal properties, following the recommendations of Gillespie & Kidd (1978) and Sentelhas et al. (2004a).
Before being used in the field, all LWD sen-sors were set up over turf grass in order to determine a resistance threshold for each sensor to be consid-ered wet and also to ensure that all sensors were working properly. The flat plate sensors were mounted on PVC tube sections and deployed at 45º in relation to the horizontal plane. Sentelhas et al. (2004b) ob-served that LWD measurements obtained by flat plate sensors deployed at this position over turfgrass and maize had a good agreement with visual observations of wetness. The cylindrical sensors were attached to adjustable-angle clamps at 15º since they have shown good agreement with flat plate sensor measurements when deployed at this angle (Santos, 2006). After this, the sensors were installed in three crops with differ-ent canopy structures and leaf area: cotton, coffee and banana (Figure 1).
For the cotton crop, the measurements were taken from November 29, 2005 to February 14, 2006, totaling 78 days. The LWD was obtained by cylindri-cal sensors deployed at 15º. The sensors were installed perpendicularly to the crop rows facing southwest in the lower third and at the top of the canopy (Figure 1). The height of the sensors was continuously ad-justed to follow plant growth. During this period cot-ton crop leaf area index (LAI) varied from one to three. The sensors were connected to a data logger (SIMAD, Autsens, SP, Brazil) which recorded their averages at 15 min intervals, which were used to calculate the pro-portion of the time that each sensor was wet.
LWD measurements in the coffee crop, with approximately four years old, rows oriented northwest-southeast and row spacing of 3.5 m, were preformed from April 1 to June 23, 2006, totaling 74 days. The sensors were installed in a plant of 1.6 m height and leaf area of 4.2 m2
canopy, at 0.35 m height; on both sides of the plant; at the middle third, at one meter, on both sides and in the interior of the canopy; and at 1.65 m height on the top of the canopy. At each position LWD was mea-sured using two flat plate sensors, deployed at 45°. The sensors were installed close to the leaves on both sides of the plant, and oriented northeast and south-west. They were connected to a data logger (CR7, Campbell Scientific, UT, USA) which provided histo-grams with the proportion of time for which each sen-sor was wet at 15 min intervals.
For the banana crop, with LAI = 6, with rows oriented north-south and row spacing of three meters, LWD measurements were obtained from May 30 to July 13, 2006, totaling 45 days, at two different posi-tions: the lower third of the canopy, at 2.3 m height, close to the insertion of the first leaf; and in the upper third of the plant, at 3.3 m height, close to the upper surface of the highest leaves (Figure 1). The cylindri-cal sensors were deployed at 15º facing west. The sen-sors were connected to a data logger (CR10, Campbell Scientific, UT, USA), which provided histograms with the proportion o time for which each sensor was wet. Simultaneously, LWD was also measured in nearby standard weather stations, located always less than two kilometers from the crops. This distance was not a problem for comparisons since the area is homogeneous in terms of microclimate allowing the weather station to represent the standard conditions for the whole area. Two flat plate sensors were mounted on PVC tube sections and deployed at 45º facing south, 30 cm above turf grass canopy. Pedro Junior (1980), Lau et al. (2000) and Sentelhas et al. (2004b) observed that LWD measurements obtained by flat plate sensors deployed at this
posi-tion presented good agreement with visual observa-tions of LWD over turfgrass, with errors smaller than 30 minutes. Thus these measurements were used as reference for comparisons with crop LWD. In addi-tion to LWD measurements, rainfall was also mea-sured during the experiments using a tipping bucket rain gauge (TE525WS-L, Texas Electronics, TX, USA).
The LWD was totaled for 24-hour periods, starting at 12h15 of day “n” and finishing at 12h00 of day “n + 1”. LWD data, obtained at different canopy positions were compared using the mean absolute dif-ference (MAD) which indicates the magnitude of the mean difference, and using the mean difference (MD), which describes the direction of the bias:
n x x MAD
n
i
T i
∑
=
−
= 1 (1)
(
)
n x x MD
n
i
T i
∑
=
− = 1
(2)
where: xi is the LWD onset and dry-off times at dif-ferent canopy positions, xT is the LWD onset and dry-off times at the top canopy and n is the number of observations.
The relationships between turfgrass LWD and crop LWD in different canopy positions were obtained using regression analysis. The significance of the re-gression analysis coefficients was determined by a t-test (p < 0.05). The models obtained by the regres-sion analysis were compared using the identity test pro-posed by Regazzi (1993). This analysis determines whether the coefficients obtained for two curves are statistically different.
the LWD measured at the lower third of the plant. The results for cotton may be related to the fact that LWD was measured for the initial crop phases, when the leaf area was small and sensors were close to each other leading to similar values of LWD. However, for the coffee crop the top of the canopy was more exposed to wind and solar radiation, reducing the dew deposition during the night and leading to faster drying-off during the day. Similar results were found by Sentelhas et al. (2005) who observed that LWD was 1.5 h longer at the lower third than at the top of young coffee plants, with approximately 80 cm height. For banana, the occurrence of shorter LWDs at the lower third of the canopy may be related to dif-ferences in the net radiation at these canopy positions, as a consequence of high LAI. The sensors installed in the canopy were partially covered by leaves which intercepted the long wave radiation during night, caus-ing a slower coolcaus-ing of the sensors, which resulted in the deposition of small amounts of dew over their sur-faces (Dalla Marta et al., 2004).
The canopy exposure was also an important fac-tor for the LWD variability. The sensors located at the middle third of the coffee plant, facing southwest, gen-erally measured longer LWD (1.3 h) than those sensors facing northeast. At the lower third, the effect of the exposure was not so evident, which is probably related to the shadow caused by plants in adjacent rows as well as by the leaves that partly covered the sensors. The effect of the exposure of the canopy on LWD has also been reported by Dalla Marta et al. (2004), who observed the longest LWD in the west face of a grape canopy.
A more detailed analysis of the LWD spatial variability can be provided by the differences between the wetness onset or dry-off times in different parts of the canopy (Table 2). For the cotton crop, the wet-ness onset at the top occurred on average 16 min be-fore the onset at the lower third of the canopy, whereas the dry-off was on average measured 4 min later in
the plant facing southwest had the dry-off occurring 118 min later than for the sensors installed at the top
Position* MD (min) MAD (min)
Onset Dry-off Onset Dry-off
MT_NE -41 -1 44 18
INS -64 - 11 77 32
LT_NE -88 13 104 21
MT_SW -48 74 50 75
LT_SW -101 84 118 85
Average -68 32 78 46
Table 2 - Mean difference (MD) and mean absolute difference (MAD) among wetness onset and dry-off times at different positions of coffee canopy, using as a reference onset and dry-off times obtained at the top of a coffee plant, in Piracicaba, SP, Brazil.
*MT_NE = middle third facing NE; INS = inside the canopy;
LT_NE = lower third facing NE; MT_SW = middle third facing SW; LT_SW = lower third facing SW.
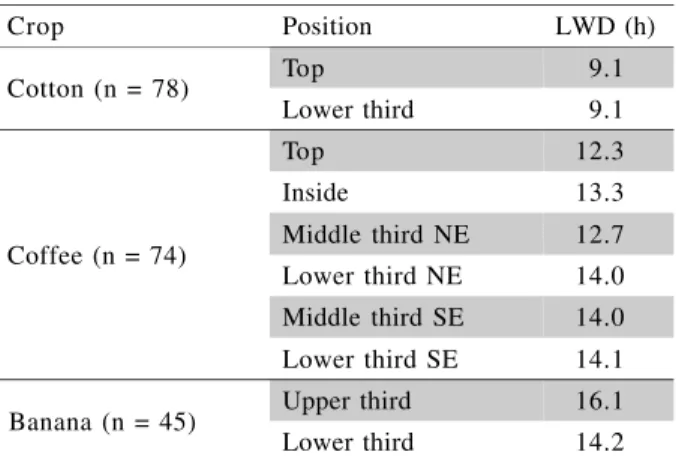
Crop Position LWD (h)
Cotton (n = 78) Top 9.1
Lower third 9.1
Coffee (n = 74)
Top 12.3
Inside 13.3
Middle third NE 12.7
Lower third NE 14.0
Middle third SE 14.0
Lower third SE 14.1
Banana (n = 45) Upper third 16.1
Lower third 14.2
Table 1 - Average leaf wetness duration (LWD) at different positions of cotton, coffee and banana canopies, in Piracicaba, SP, Brazil.
of the canopy; those sensors also presented the latest dry-off. The MAD for the dry-off ranged from 18 to 85 min with an average of 46 min.
The occurrence of wetness onset earlier at the lower portions and inside the plant is probably related to lower wind speed at these positions, which con-tributed to a faster dew formation. In addition, the lower parts of the canopy were closer to the soil, which is an important source of water vapor for the dew formation process (Rosenberg et al., 1983). On the other hand, the top and the northwest canopy side were more exposed to solar radiation, which is the main reason for the faster wetness dry-off observed at these canopy positions. It was expected that the sen-sors located inside the canopy would record the dry-off later than the sensors located outside the canopy, as they were less exposed to solar radiation. However, it is probable that a smaller amount of dew was de-posited on the plant surfaces inside the canopy, lead-ing to an earlier dry-off inside the canopy. On the op-posite, the lower parts of the canopy and those fac-ing southwest were less exposed to the solar radia-tion leading to a late wetness dry-off. When measur-ing the LWD at different positions of a tomato canopy, Lau et al. (2000), noticed that sensors facing east had the wetness dry-off 20 min later than the sensors fac-ing north, south and west.
For banana, the wetness onset at the upper third of the canopy occurred 96 min earlier than at the middle third. The MAD between these positions was 99 min. The wetness dry-off occurred on average 24 min ear-lier at the middle third than at the upper third of the canopy. The MAD for the dry-off between the two po-sitions was 38 min. Similar results were observed by Wittich (1995), who reported longer LWD at the top of apple trees than at the bottom of the canopy. Sentelhas
et al. (2005) also found longer LWD for apple trees, ranging from 8.7 h for the top to 6.8 h for the lower third of the canopy, and for maize plants, from 14.5 h for the top to 13.5 h inside the canopy. The results found for the banana crop apparently disagree with what was found for coffee in this study; however it is nec-essary to consider that the highest sensors in the ba-nana crop were installed at the middle third of the canopy, under upper leaves, instead at the top. There-fore the sensors were affected by the foliage, which reduced the wind speed and sunshine in this position, leading to higher values of LWD.
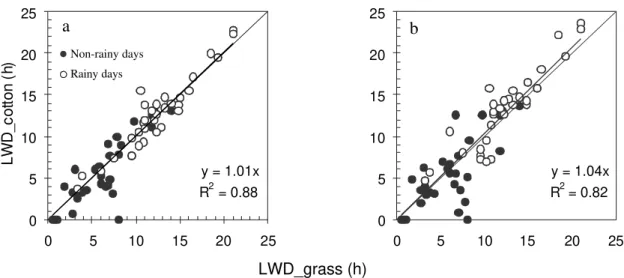
The agreements between turfgrass LWD and crop LWD, obtained for the upper canopy portions, were high. All coefficients, obtained using regression analysis, were significant by t-test (p < 0.05). There was a broader range of values of LWD for cotton as compared to the other crops (Figure 2). This is re-lated to the fact that the measurements in cotton were carried out during the rainy season when the occur-rence of longer LWD was usual. On the other hand, short nights with higher temperatures and low relative humidity contributed to the occurrence of short LWDs. The relationships between turfgrass LWD and crop LWD resulted in coefficients of determination of 0.89 for the top and 0.82 for the lower third of the canopy. The slope of the regression showed that LWD in the lower third of the cotton crop was about 3% higher than the LWD obtained over turfgrass, while the dif-ference between the LWD on the top and over turfgrass was less than 1%. The identity model test showed that regression coefficients for both equations were not dif-ferent by the F-test (p < 0.05). Therefore, the rela-tionship between turfgrass and crop LWD, measured at the top or at the lower third of the canopy, can be represented by one single equation.
Figure 2 - Relationship between leaf wetness duration (LWD) measured over turfgrass in a standard weather station and at the top (a) and at the lower third (b) of a cotton canopy, in Piracicaba, SP, Brazil.
LWD_grass (h)
y = 1.04x
R2 = 0.82
0 5 10 15 20 25
0 5 10 15 20 25
b
y = 1.01x
R2 = 0.88
0 5 10 15 20 25
0 5 10 15 20 25
Non-rainy days
Rainy days
a
LW
D
_c
ot
ton
(h
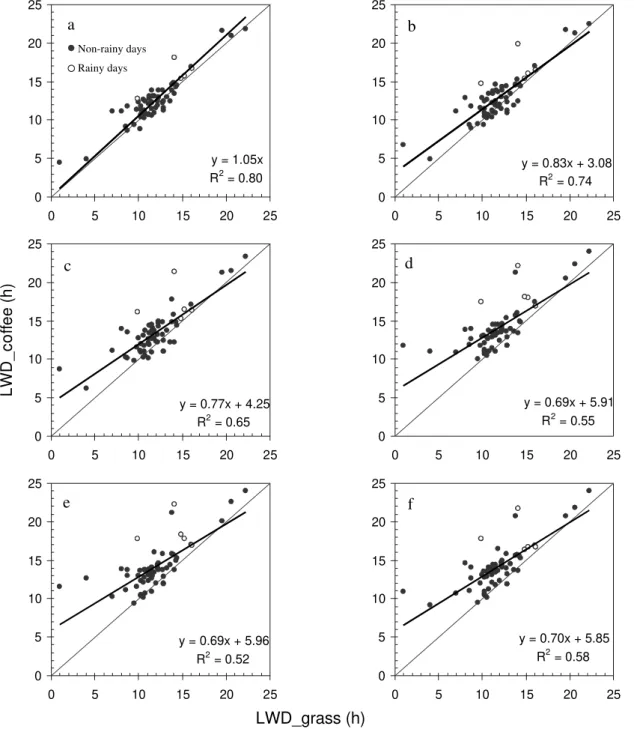
Figure 3 - Relationships between leaf wetness duration (LWD) measured over turfgrass in a standard weather station and obtained at different positions of a coffee canopy: top (a), middle third facing NE (b); inside the canopy (c); lower third facing NE (d); middle third facing SW (e); lower third facing SW (f), in Piracicaba, SP, Brazil.
LWD_grass (h)
y = 0.83x + 3.08 R2 = 0.74 0
5 10 15
0 5 10 15 20 25
y = 0.77x + 4.25 R2 = 0.65 0
5 10 15 20 25
0 5 10 15 20 25
y = 0.69x + 5.91 R2 = 0.55 0
5 10 15 20 25
0 5 10 15 20 25
y = 0.69x + 5.96 R2 = 0.52 0
5 10 15 20 25
0 5 10 15 20 25
y = 0.70x + 5.85 R2 = 0.58 0
5 10 15 20 25
0 5 10 15 20 25
y = 1.05x R2 = 0.80 0
5 10 15
0 5 10 15 20 25
c d
e f
LW
D
_
c
o
ff
ee
(h
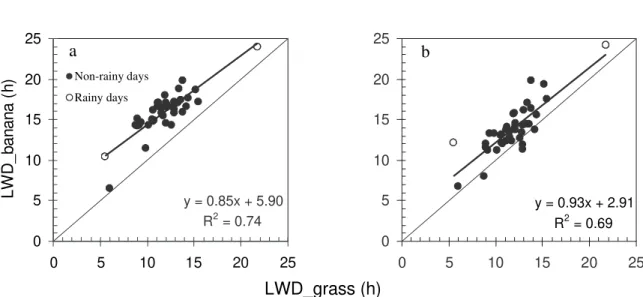
Figure 4 - Relationship between leaf wetness duration (LWD) measured over turfgrass in a standard weather station and at the upper third (a) and lower third (b) of a banana canopy, in Piracicaba, SP, Brazil.
LWD_grass (h)
y = 0.85x + 5.90R2 = 0.74 0 5 10 15 20 25
0 5 10 15 20 25
Non-rainy days Rainy days
a
y = 0.93x + 2.91
R2 = 0.69
0 5 10 15 20 25
0 5 10 15 20 25
b
L W D _ ba na na (h)sitions (middle third facing SW, lower third facing NE and lower third facing SW).
In general, the LWD measured in the coffee canopy was longer than that over turfgrass in the nearby weather station. The LWD at the top of the cof-fee plant was around 5% longer than that over turfgrass. For the other positions, turfgrass LWD was smaller than crop LWD for turfgrass wetness dura-tion below 20 h and greater than that for turfgrass LWD higher than 20 h. Such trends make it more dif-ficult to adopt a single linear correction factor for es-timating crop LWD from turfgrass LWD. In this case it is necessary to use more complex models as men-tioned by Sentelhas et al. (2005).
As observed for the other crops, the best re-lationship between turfgrass and crop LWD for banana was obtained for the top of the canopy, with a R2
of 0.74 (Figure 4). At this position, the crop LWD was systematically longer than that of the turfgrass whereas for the middle third of the crop, the difference was smaller, but with a greater data dispersion, with a R2
of 0.69. The coefficients of the relationship between turfgrass and banana LWD were not different by the F-test (p < 0.05).
LWD was affected not only by meteorologi-cal conditions but also by canopy characteristics, as for example plant height, plant architecture, leaf ex-position and leaf area, whose interaction determines the crop microclimate. The relationships between the turfgrass LWD measured at the weather station and the crop LWD measured at the upper canopy positions, showed that is possible to use electronic sensors in-stalled at weather stations in a reference position to estimate LWD for different crops, as also observed by Sentelhas et al. (2005). However, further studies
re-lated to the spatial variability of crop LWD and its es-timation from turfgrass LWD are required to ensure the accuracy of this technique for other crops.
REFERENCES
DALLA MARTA, A.; ORLANDINI, S.; GHIRONI, M.; SABATINI, F. Influence of different sensor positions on leaf wetness measurements and their effect on the simulation of grapevine downy mildew (Plasmopara viticola).Idõjárás, v.108, p.253-263, 2004.
FRANCL, L.J.; PANIGRAHI, S. Artificial neural network models of wheat leaf wetness. Agricultural and Forest Meteorology, v.88, p.57-65, 1997.
GILLESPIE, T.J.; KIDD, G.E. Sensing duration of moisture retention using electrical impedance grids. Canadian Journal of Plant
Science, v.54, p.179-187, 1978.
HUBER, L.; GILLESPIE, T.J. Modeling leaf wetness in relation to plant disease epidemiology. Annual Review of
Phytopathology, v.30, p.553-577, 1992.
LAU, Y.F.; GLEASON, M.L.; ZRIBA, N.; TAYLOR, S.E; HINZ, P.N. Effects of coating, deployment angle, and compass orientation on perfomance of electronic wetness sensors during dew periods. Plant Disease, v.84, p.192-197, 2000. MADEIRA, A.C.; KIM, K.S; TAYLOR, S.E.; GLEASON, M.L. A
simple cloud-based energy balance model to estimate dew.
Agricultural and Forest Meteorology, v.111, p.55-63, 2002. MAGAREY, R.D. A theoretical standard for estimation of surface wetness duration in grape. Ithaca: Cornell University, 1999. 208p. (Ph.D.).
MONTEITH, J.L.; UNSWORTH, M.H. Principles of
environmental physics. 2 ed. New York: Routledge, 1990. 291p.
PEDRO JUNIOR, M.J. Relation of leaf surface wetness
duration to meteorological parameters. Guelph: University of Guelph, 1980. 147p. (Ph.D.).
PEDRO JUNIOR, M.J.; GILLESPIE, T.J. Estimating dew duration I. Utilizing micrometeorological data. Agricultural
Meteorology,v.25, p.283-296, 1982.
REGAZZI, A.J. Teste para identidade de modelos de regressão e igualdade de alguns parâmetros num modelo polinomial ortogonal. Revista Ceres, v.40, p.176-195, 1993.