Chromatic spatial contrast sensitivity
estimated by visual evoked cortical
potential and psychophysics
M.T.S. Barboni
3, B.D. Gomes
1, G.S. Souza
1,2, A.R. Rodrigues
2,
D.F. Ventura
3and L.C.L. Silveira
1,21Instituto de Cieˆncias Biolo´gicas, Universidade Federal do Para´, Bele´m, PA, Brasil
2Nu´cleo de Medicina Tropical, Universidade Federal do Para´, Bele´m, PA, Brasil
3Instituto de Psicologia, Universidade de Sa˜o Paulo, Sa˜o Paulo, SP, Brasil
Abstract
The purpose of the present study was to measure contrast sensitivity to equiluminant gratings using steady-state visual evoked cortical potential (ssVECP) and psychophysics. Six healthy volunteers were evaluated with ssVECPs and psychophysics. The visual stimuli were red-green or blue-yellow horizontal sinusoidal gratings, 5
˚
65˚
, 34.3 cd/m2mean luminance, presented at6 Hz. Eight spatial frequencies from 0.2 to 8 cpd were used, each presented at 8 contrast levels. Contrast threshold was obtained by extrapolating second harmonic amplitude values to zero. Psychophysical contrast thresholds were measured using stimuli at 6 Hz and static presentation. Contrast sensitivity was calculated as the inverse function of the pooled cone contrast threshold. ssVECP and both psychophysical contrast sensitivity functions (CSFs) were low-pass functions for red-green gratings. For electrophysiology, the highest contrast sensitivity values were found at 0.4 cpd (1.95 ± 0.15). ssVECP CSF was similar to dynamic psychophysical CSF, while static CSF had higher values ranging from 0.4 to 6 cpd (P,0.05, ANOVA). Blue-yellow chromatic functions showed no specific tuning shape; however, at high spatial frequencies the evoked potentials showed higher contrast sensitivity than the psychophysical methods (P,0.05, ANOVA). Evoked potentials can be used reliably to evaluate chromatic red-green CSFs in agreement with psychophysical thresholds, mainly if the same temporal properties are applied to the stimulus. For blue-yellow CSF, correlation between electrophysiology and psychophysics was poor at high spatial frequency, possibly due to a greater effect of chromatic aberration on this kind of stimulus.
Key words: Contrast sensitivity; Color vision; Steady-state visual evoked cortical potential; Visual thresholds; Spatial vision; Psychophysics
Introduction
The visual system of mammals, including primates and humans, is organized in parallel visual pathways that originate in the retina and are distributed to several subcortical targets in the mesencephalon and diencepha-lon. It is understood that the visual pathways more important for visual perception of form, movement, and several spatial and temporal aspects of vision are those that connect the retina to the lateral geniculate nucleus (LGN) and primary visual cortex (V1): the M (magnocel-lular), P (parvocel(magnocel-lular), and K (koniocellular) pathways, named according to the relay layers of the lateral geniculate nucleus (1,2). Shapley and Perry (1) estab-lished the original distinction and significance between M and P cells. A recent review about the morphological and physiological properties of such cells may be found
elsewhere (2), providing readers with the appropriate baseline references. M cells comprise about 10% of all ganglion cells and are very sensitive to achromatic contrast but their response saturates at high contrast levels, and they do not respond to pure chromatic contrast. They project to the LGN magnocellular layers and from there cells with similar properties project to V1 layer 4Ca (1,2). P cells comprise about 80% of ganglion cells and are insensitive to low levels of achromatic contrast but their response continues to increase in amplitude when contrast is raised to high levels, and they respond to red-green contrast. They project to the LGN parvocellular layers and from there cells with similar properties project to V1 layer 4Cb(1,2). K cells comprise a heterogeneous group of ganglion cells and LGN cells,
Correspondence: B.D. Gomes, Instituto de Cieˆncias Biolo´gicas, Universidade Federal do Para´, Campus Universita´rio do Guama´,
66075-110 Bele´m, PA, Brasil. Fax:+55-91-3241-0032. E-mail: [email protected] or [email protected]
some of them responding to blue-yellow chromatic contrast, and project to V1 layer 4A (3). In addition to the visual cortex, at least two main visual streams provide visual information to the visual and visuomotor areas located in the dorsal and ventral regions of the cerebral cortex (3).
While numerous psychophysical studies have demon-strated the spatial contrast sensitivity function (CSF) using achromatic stimuli (e.g., 4-7), fewer investigations have looked at the psychophysical chromatic spatial CSF (6,8-11). This is also the case for human electrophysio-logical studies. The achromatic spatial CSF was mea-sured by means of threshold estimation using noninvasive electrophysiology such as the visual evoked cortical potential and both steady-state VECP (ssVECP) and transient VECP (6,7,12-16). Visual contrast thresholds for achromatic spatial patterns, such as gratings, have been estimated by using ssVECPs at as many as 18 spatial frequencies, providing a detailed electrophysiological account of the human achromatic spatial CSF (15). The study of chromatic spatial CSF using VECP was limited to a few studies and chromatic spatial or temporal CSFs based on electrophysiological threshold estimates are rare in the literature both for red-green temporal CSF (17) and red-green spatial CSF (6). Chromatic spatial contrast sensitivity was more often studied based on suprathres-hold VECP amplitudes (18,19), and additional studies comparing electrophysiological chromatic versus achro-matic CSFs, as well as comparing electrophysiological and psychophysical chromatic CSFs.
The linear correspondence between VECP and con-trast has been well established by other studies either using achromatic gratings (7,12,20,21) or equiluminant chromatic gratings (21-27), as well as equiluminant sinusoidal plaid patterns (6,17). Thus, we estimated the chromatic contrast sensitivity from pooled cone contrast thresholds (28) by recording ssVECPs in response to red-green and blue-yellow gratings at a wide range of contrast levels.
Subjects and Methods
Subjects
Six healthy trichromats (28.3 ± 3.5 years old) with normal acuity or corrected to 20/20 participated in the study. Normal trichromacy was verified using Ishihara’s pseudoisochromatic plates and a custom-made compu-terized version of the 100-hue Farnsworth-Munsell color arrangement test. Only the eye with lower dioptric error was tested. Inclusion criteria were absence of ophthalmo-logic and degenerative diseases or diseases that could affect the visual nervous system. All subjects gave written informed consent prior to the test. Tests were performed according to the tenets of the Declaration of Helsinki and were approved by the Human Research Ethics Committee, Nu´cleo de Medicina Tropical, Universidade
Federal do Para´ (Report #113/2004, November 25, 2004), according to Resolution #196/96 of the National Health Council of Brazil.
Visual stimulation
The Visage platform (Cambridge Research System, UK) was used to generate stimuli. The stimuli were displayed on a 200Diamond Pro 2070 CRT monitor, 100-Hz frame rate, 800 6 600 pixels (Mitsubishi Electric,
Australia). Gamma correction was performed using a ColorCAL colorimeter (Cambridge Research System). Stimulus luminance and chromaticity were measured with a CS-100A Chroma Meter (Konica Minolta, USA).
Visual stimuli consisted of horizontal red-green and blue-yellow equiluminant gratings displayed in 180
˚
phase reversal at 6-Hz temporal frequency, i.e., 12 reversals per second, with square temporal modulation. Eight spatial frequencies from 0.2 to 8 cpd were evaluated. A central cross (1˚
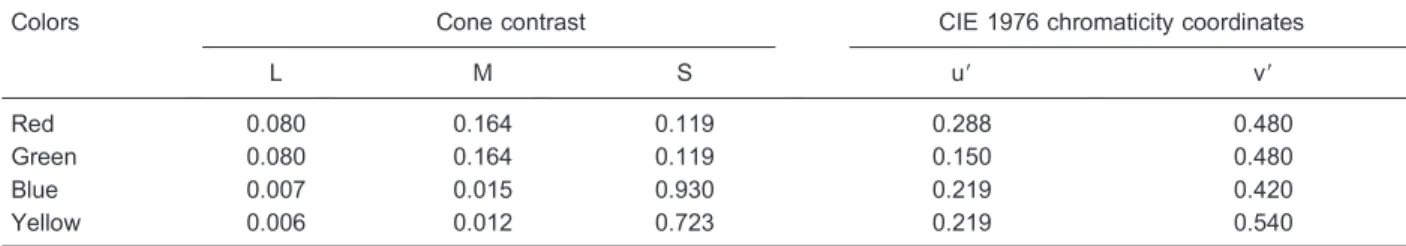
of visual field) was used for fixation. Eight contrast levels were used for each spatial frequency. Chromaticities were at the highest contrast: red, u9 = 0.288, v9= 0.480; green, u9= 0.150, v9= 0.480; blue, u9= 0.219, v9= 0.420; yellow = 0.219, v9= 0.540. Stimuli were displayed against a background of the same mean luminance (34.3 cd/m2) and chromaticity (u9= 0.219, v9
= 0.480). The reason to use these coordinates is that in our previous studies they were effective to elicit robust VECP amplitudes and are optimized to stimulate psycho-physically color opponent pathways (25,26).
Equiluminance was achieved for each subject and spatial frequency by heterochromatic flicker photometry with temporal frequency at 20 Hz. In this procedure, for each stimulus, the subject had to diminish the flicker sensation as much as he could. Luminance from each grating color after flicker fusion was then added to each stimulus used in all tests.
We used Judd modified values (x9, y9, z9) (29) to obtain tristimulus values and the Smith and Pokorny (30) cone fundamentals to calculate cone contrast. As a single measurement of cone contrast, we calculated the pooled value:
C~
ffiffiffiffiffiffiffiffiffiffiffiffiffiffiffiffiffiffiffiffiffiffiffiffiffiffiffiffi C2
LzC2MzC2S
3
s
(Equation 1)
whereCis the pooled cone contrast, andCL,CM,CSare
color are shown in Table 1 for the maximum chromatic contrast.
Electrophysiological procedure
The electrophysiological procedure followed the guidelines of the International Federation of Clinical Physiology (IFCN) (32). Gold-cup electrodes were used to obtain one-channel recordings from Oz (active elec-trode), Fp (reference elecelec-trode), and Fpz (ground) according to the International 10/20 System. The record-ings were sampled at 1 kHz and amplified 50,0006and
on-line band-pass filtered between 0.3 and 100 Hz. For each condition, 120-240 epochs, 1 s each, were aver-aged. The evoked potential signals were amplified with a CEDTM 1902 pre-amplifier and recorded with a CEDTM
1401 device (Cambridge Electronic Design Ltd., UK). VECPs were analyzed after fast Fourier transform (FFT) to obtain the amplitude of the second harmonic (12 Hz) measured in the frequency domain. This amplitude was then used as a chromatic sensitivity index. To determine if signals were above noise level, the statistical significance of the ssVECP was estimated as indicated by Meigen and Bach (33). According to this method, the signal-to-noise ratio (SNR) was calculated by the relation SNR = Hamp12 / (Hamp11 + Hamp13 / 2), where Hamp12, Hamp11, and Hamp13 are the amplitudes of harmonics at the frequencies 12, 11, and 13 Hz, respectively. From some assumptions about the spectral properties and the probability density of Fourier components at the stimulus frequency, for a significance level of 5%, the critical SNR is 2.82. This means that a value above 2.82 is considered to be significantly different from noise. Contrast threshold was estimated by extrapolation of straight line functions to zero amplitude. The contrast sensitivity was calculated as the inverse function of the pooled cone contrast threshold.
Psychophysics
In order to compare electrophysiological and beha-vioral data, a psychophysical procedure was implemented in two conditions: 6-Hz phase reversal, as used in the electrophysiological measurements, and static presenta-tion. Thresholds were determined by the adjustment method. In this procedure, for each grating and spatial
frequency the stimulus was first shown at the highest contrast and then the subjects had to decrease chromatic contrast until they barely saw the stimulus. The contrast was then recorded and, in the next step, the starting contrast was shown with 1.5 dB relative to the last contrast recorded. This reduced the time of the procedure and avoided anticipation error. A threshold was then assumed as an average of six independent trials at each spatial frequency.
Results
Electrophysiology
Figure 1 shows mean time-averaged ssVECP wave-forms and FFT spectra for all subjects at different pooled cone contrasts for the spatial frequency of 2 cpd. Spectra showed a peak at 12 Hz corresponding to the number of reversals per cycle and an additional peak at 6 Hz more prominent at the lowest contrasts, where the response of first harmonic did not differ from noise. A comparison is shown in Figure 1 with different pooled cone contrasts for high and low responses according to the contrast. As blue-yellow stimulation elicited responses that quickly decreased with contrast in comparison to red-green stimulation, an abrupt response decrease occurred for pooled contrasts below 20.4, which corresponded to 40% of the maximum contrast used. The second harmonic amplitude as a function of log pooled cone contrast was well fitted by linear functions (Figure 2). Correlation coefficients were higher for the red-green than for the blue-yellow amplitude modulation.
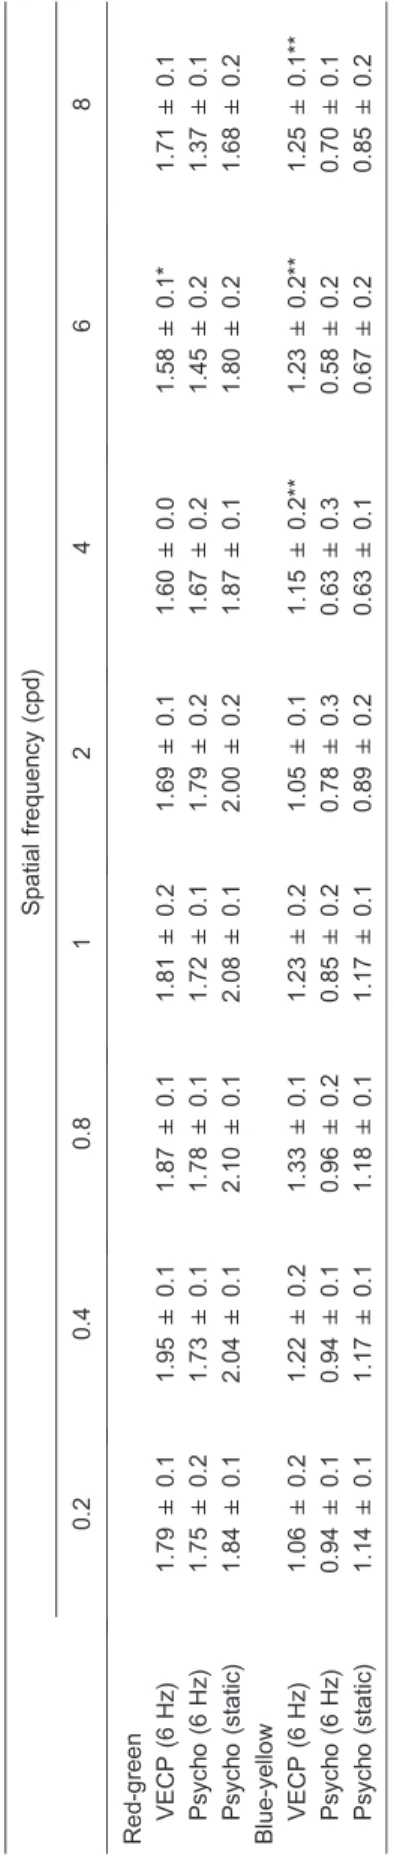
For red-green gratings, the highest contrast sensitivity values were found at 0.4 cpd (1.95 ± 0.1) and the lowest sensitivity values were observed at 4 cpd (1.60 ± 0.0) and 6 cpd (1.58 ± 0.1; Table 2, Figure 3A). For blue-yellow gratings, the highest contrast sensitivity values were found at 0.8 cpd (1.33 ± 0.1) and the lowest at 2 cpd (1.05 ± 0.1; Table 2, Figure 3B). Red-green function showed a small attenuation at low spatial frequencies and a more pronounced attenuation at high spatial frequencies. At the highest spatial frequency tested, 8 cpd, the sensitivity started to increase, an indication of luminance intrusion due to chromatic
Table 1. Cone contrast for each color used in the red-green and blue-yellow gratings.
Colors Cone contrast CIE 1976 chromaticity coordinates
L M S u9 v9
Red 0.080 0.164 0.119 0.288 0.480
Green 0.080 0.164 0.119 0.150 0.480
Blue 0.007 0.015 0.930 0.219 0.420
Yellow 0.006 0.012 0.723 0.219 0.540
Values are for the maximum contrast used. For each cone type the cone contrast was calculated according to the ratios L = lb- l / lb, M
aberration. Thus, chromatic aberration did not permit us to extend the study further at higher spatial frequencies. Blue-yellow function showed a similar trend, but at 4 cpd the sensitivity started to increase, an indication that luminance intrusion was more severe for this kind of chromatic stimulus than for red-green gratings.
Psychophysics
Red-green CSFs obtained with 6-Hz stimulation and static presentation showed a small attenuation at low spatial frequencies and a more accentuated attenuation at high spatial frequencies similar to the electrophysiological results for red-green gratings (Figure 3A). Blue-yellow CSFs showed a trend similar to red-green CSF up to 4 cpd, but at higher spatial frequencies (6 and 8 cpd) there were signs of luminance intrusion to chromatic aberration (Figure 3B). The static red-green CSF provided higher values than the 6-Hz red-green CSF (one-way ANOVA,a= 0.05). For blue-yellow gratings no significant difference was found between the two psychophysical conditions (one-way ANOVA,a= 0.05).
Comparison between VECP and psychophysics CSF
For red-green gratings the electrophysiological func-tion was similar to psychophysics 6-Hz CSF but different from static psychophysics CSF (one-way ANOVA, a = 0.05). The static psychophysics CSF was higher than ssVECP and 6-Hz psychophysics CSFs (Table 2, Figure 3A). When using blue-yellow gratings as stimuli, ssVECP was different from both psychophysical conditions (a = 0.05, one-way ANOVA). This difference was observed mainly at the higher spatial frequencies (Table 2, Figure 3B).
Discussion
We were able to measure ssVECP amplitude as a function of pooled cone contrast for red-green and blue-yellow sine wave gratings. From these measurements, it was possible to estimate contrast thresholds and provide color contrast sensitivity over a range of spatial frequen-cies. Morrone et al. (6) measured red-green contrast sensitivity along a similar range of spatial frequencies as
Figure 1.A, Average recordings for all subjects obtained for 2 cpd in both conditions, red-green and blue-yellow grating stimulation.
The numbers on the left of each recording are pooled cone contrast values.B, Fast Fourier transform spectra from the recordings inA.
the one used in the present study (they did not study blue-yellow contrast sensitivity as we did in this research). Similarly to our study, they estimated chromatic contrast thresholds by extrapolating the ssVECP amplitude versus contrast fittings to the zero level. However, the methodol-ogy they used differed from that used in our study in many aspects: 5-Hz temporal frequency, sinusoidal plaid patterns as spatial stimuli, Michelson contrast as contrast metrics according to the study of Mullen (11). In contrast, in the present study we used 6-Hz temporal frequency, sine wave gratings, and pooled cone contrast metrics. In Figure 4, we compare our results with those of Morrone et al. (6) and Mullen (11). Due to the different conditions used in the three studies, data sets were normalized to their peak values. The results were generally similar up to 2-3 cpd. From 4 cpd onwards the data sets diverged and those from the present study showed higher values than those of Morrone et al. (6) and Mullen (11). A possible explanation for this difference is the intrusion of luminance artifacts due to chromatic aberration under our experi-mental conditions, which became significant for sine wave gratings only for medium to high spatial frequencies, while the optical procedure used by Morrone et al. (6) and Mullen (11) avoided this, at least in the range of spatial
frequencies used by them.
Regan (21) analyzed steady-state evoked potentials for a variety of chromatic contrasts at a single-spatial frequency using red-green gratings and checkerboard patterns. Our results agree with Regan’s findings regard-ing the good correlation between evoked potentials and psychophysical thresholds. In the present study, this agreement between VECP and dynamic psychophysics was extended to thresholds estimated at a range of spatial frequencies. There was also a relationship with Regan’s results regarding the amplitude saturation we found mainly at the higher contrasts, as can be seen in Figure 2.
An important issue is the use of pattern reversal to assess chromatic responses. There is evidence that steady-state onset/offset stimulation using equiluminant chromatic gratings could be more effective to elicit responses that are related to the activity of color opponent pathways. We have previously and successfully used 1-Hz onset/offset stimulation to elicit responses along a variety of color axes (25,26) and also compared these responses with those from onset/offset achromatic grat-ings (34). When using equiluminant gratgrat-ings to obtain transient instead of steady-state VECP, the opposite
Figure 2.Amplitude variation plotted against pooled cone contrast for one of the subjects tested. Pearson’s correlation coefficients are shown. Black filled circles were used to estimate regression lines. Red filled circles are amplitude data that were not different from
noise.AandB, data for red-green gratings at 2 and 4 cpd, respectively.CandD, data for blue-yellow gratings at 2 and 4 cpd,
Figure 3.Contrast sensitivity to red-green (A) and blue-yellow (B) sinusoidal gratings obtained as the inverse of contrast thresholds estimated for 6 normal trichromat subjects. Data are reported as means ± SD for 6 subjects. Filled circles and empty triangles are contrast sensitivity data from visual evoked cortical potential (VECP) and psychophysics using the same temporal parameters as in VECP, respectively. Empty squares are contrast sensitivity data from psychophysics using the same gratings but static presentation. Contrast sensitivity values measured with ssVEP were compared with each psychophysical procedure and also a comparison between psychophysics tests was made (one-way
ANOVA, a = 0.05). When using red-green gratings, ssVEP
function was similar to 6-Hz psychophysics but different from static psychophysical contrast sensitivity function (one-way
ANOVA, a = 0.05). For blue-yellow gratings ssVECP was
different from both psychophysical conditions (one-way ANOVA,
a= 0.05).
polarity elicited by the appearance of the chromatic and achromatic gratings might make it difficult to measure the chromatic signal (22,25,26,34-36). This difference in morphology seems consistent with non-overlapping acti-vation of magnocellular and parvocellular pathways. However, there is no such indication of color response selectivity in steady-state VECP. McKeefry et al. (37) compared VECP elicited by gratings displayed in onset/ offset and reversal at three temporal frequencies. Two of the frequencies were high enough to give rise to steady-state VECP and thus higher amplitudes in the frequency domain. They reported decreased amplitude for reversal in comparison to onset/offset in the time and frequency domain mainly at higher temporal frequencies. However, using onset/offset leads to some second harmonic contribution evident at 8.33 Hz, which indicates a magno-cellular activity intrusion. The authors suggested a magnocellular origin for the harmonic measured in pattern reversal even though they used equiluminant chromatic gratings. This is not in agreement with our previous results (26), which also showed higher amplitudes for steady-state onset/offset in comparison to pattern rever-sal in the time and frequency domain. However, pattern reversal amplitude was more persistent at the lowest contrasts, providing lower VECP thresholds than onset/
offset (26). In addition, single-cell recording showed that many neurons in V1 respond robustly to pure color and luminance stimuli. Skottun and Skoyles (38) pointed out several reasons that make it difficult to consider second harmonic response as a good measurement of magno-cellular activity in chromatic ssVECP. Thus, we suggest that our results were evoked mainly by contribution from color opponent pathways.
Evoked potentials and psychophysics for red-green gratings
Our results for red-green ssVECP at different spatial frequencies showed a low-pass function with a decrease in amplitude at the higher spatial frequencies, in agree-ment with studies that measured suprathreshold ampli-tude against contrast variation. Arakawa et al. (19) studied ssVECP suprathreshold amplitude responses at nine spatial frequencies varying from 0.5 to 8.0 cpd at 4 Hz for chromatic and achromatic gratings shown within 11.967.8 degrees of visual field. They found a low-pass
spatial tuning function for chromatic stimuli and a band-pass function for the achromatic case. Arakawa et al. (19) found a steeper decrement of the chromatic response at high spatial frequencies compared to our results. This difference might be explained by the fact that they measured sensitivity using suprathreshold amplitudes. It is interesting to note that, for chromatic evoked potentials, there appears to be a disagreement between transient and steady-state stimulation at the amplitude-contrast functions measured at suprathreshold contrasts. For instance, transient chromatic VECP amplitude has a band-pass tuning function with sharp attenuation at the higher and lower spatial frequencies (23).
At 8 cpd, the sensitivity was a bit higher than at 2.4 and 6 cpd. This discrepancy is probably related to a low SNR value at that frequency. Because the selection of data points to be measured was based on the Meigen and Bach method (33), this caused the amount of data points to be measured in each subject to be less than at the other frequencies, which makes the regression lines extrapolate to zero amplitude in lower contrasts than if all the amplitude values were considered for measure-ment.
The fact that psychophysical and evoked potential thresholds were similar when using the same temporal frequency is in agreement not only with previous studies that compared VECP and behavioral data but also with studies about the tuning of the psychophysical chromatic contrast sensitivity function (11). The low-pass tuning for red-green sinusoidal gratings has been well described by Mullen (11). Despite the fact that the static psychophysi-cal thresholds were higher than VECP and dynamic psychophysical thresholds, the low-pass characteristic of the static psychophysical function was maintained. Psychophysical thresholds estimated with static stimula-tion were significantly higher than electrophysiological or
dynamic psychophysical thresholds. The difference between static and dynamic psychophysical results could be understood on the basis of chromatic adaptation caused by the threshold estimation used. For static presentation, when decreasing the contrast in order to find the threshold, the subjects did report what seems to be an after-image effect similar to the effect reported when changing contrast abruptly from its maximum value to the background of mean chromaticity and luminance. In the dynamic psychophysics protocol the reversal of the gratings minimizes this effect, thus providing higher thresholds. It is interesting to note that the ssVECP thresholds did not receive a contribution from this effect, probably because they occurred in very low contrast.
Evoked potentials and psychophysics for blue-yellow gratings
The ssVECP amplitudes were lower for blue-yellow compared to red-green gratings. This decrease in amplitude has been reported since Regan’s study in 1973 (21) and can be attributed to koniocellular pathway properties such as fewer projections from retina to LGN and lack of S cones in the central fovea.
The VECP function for blue-yellow stimulation had no spatial tuning and was different for both psychophysical conditions, which were low-pass tuned. This happened mainly because ssVECP thresholds were lower at the higher spatial frequencies in comparison to psychophy-sics. It is possible that a luminance intrusion could have caused this difference. Some precautions were taken to avoid chromatic aberration when stimulating with blue-yellow gratings. First, all subjects performed the Heterochromatic Flicker Photometry task before each test. Second, the size of the field was small (5
˚
). However, chromatic aberration cannot be ruled out. Kulikowski and Robson (39) used transient on-off VECPs elicited by stimulation with blue-yellow gratings at 2 cpd with 3˚
and 6˚
field size. For the latter, VECP showed degraded responses beyond 4 cpd. Our results show something similar in Figure 3B, where it can be seen that a major difference between VECP and both psychophysical tests occurs from 4 to 8 cpd.If this difference cannot be fully attributed to chromatic aberration in view of our precautions, it might perhaps be related to the macular pigment (MP). Robson et al. (40) evaluated subjects with either transient or steady-state equiluminant VECP. They used gratings of various field sizes and quantified the achromatic response intrusion by
the onset of reversal-like waves in onset/offset transient VECP waveform or by the decreased amplitude in fundamental harmonics for ssVECP. Their results clearly showed a minor influence of chromatic aberration in subjects with less MP. Subjects with dense MP showed VECP with waveform and fundamental frequency indica-tive of luminance intrusion. It was suggested that MP could be important to generate luminance intrusion, which should be weighted with the chromatic aberration influ-ence.
We conclude that, despite the shallower decrease at the high spatial frequencies observed in our results for red-green chromatic sensitivity, VECP sensitivities were similar to those measured for suprathreshold amplitude as well as to CSF measured by threshold estimates reported in other studies. In contrast to suprathreshold measure-ments, CSFs determined at a range of contrast levels can provide a better estimate of chromatic discrimination in spite of the longer testing time and the more laborious procedure. CSFs measured with ssVECP for red-green gratings can be reliably used to evaluate chromatic CSFs in agreement with psychophysics, especially for stimuli with similar temporal properties. Care must be taken when using spatial frequencies 4 cpd or higher to elicit blue-yellow VECPs since chromatic aberration might quickly degrade the response, impairing a comparison with psychophysics. What is new in our study is the use of a threshold estimate taken from a range of contrasts for both red-green and blue-yellow stimuli and the use of pooled cone contrast metrics. In addition, the present study corroborates previous research showing that suprathreshold measurements obtained by ssVECP correlate well with psychophysical procedures for red-green CSF and draws attention to the overestimated thresholds provided by ssVECP at spatial frequencies 4 cpd or higher in comparison with psychophysical thresholds for blue-yellow CSF.
Acknowledgments
Research supported by FAPESP (Projeto Tema´tico
#02012733-8), CNPq-PRONEX/FAPESPA (#2268 and
#316799/2009), CNPq (#620037/2008-3, #476744/ 2009-1, and #479500/2011-8), CAPES-PROCAD (#182/2007), FINEP/UFPA/ADESP (#1723) (IBN Net). M.T. Barboni was the recipient of a FAPESP fellowship (#07/55125-1). L.C.L. Silveira and D.F. Ventura are recipients of CNPq research fellowships.
References
1. Shapley RM, Perry VH. Cat and monkey ganglion cells and
their visual functional roles.Trends Neurosci1986; 9:
229-235, doi: 10.1016/0166-2236(86)90064-0.
2. Silveira LC, Saito CA, Lee BB, Kremers J, da Silva Filho M, Kilavik BE, et al. Morphology and physiology of primate
M- and P-cells. Prog Brain Res 2004; 144: 21-46, doi:
10.1016/S0079-6123(03)14402-0.
3. Livingstone M, Hubel D. Segregation of form, color, move-ment, and depth: anatomy, physiology, and perception.
4. Campbell FW, Green DG. Optical and retinal factors
affecting visual resolution.J Physiol1965; 181: 576-593.
5. Robson JG. Spatial and temporal contrast-sensitivity
func-tions of the visual system.J Opt Soc Am1966; 56:
1141-1142, doi: 10.1364/JOSA.56.001141.
6. Morrone MC, Burr DC, Fiorentini A. Development of infant
contrast sensitivity to chromatic stimuli. Vision Res1993;
33: 2535-2552, doi: 10.1016/0042-6989(93)90133-H. 7. Souza GS, Gomes BD, Saito CA, da Silva Filho M, Silveira
LC. Spatial luminance contrast sensitivity measured with transient VEP: comparison with psychophysics and
evi-dence of multiple mechanisms.Invest Ophthalmol Vis Sci
2007; 48: 3396-3404, doi: 10.1167/iovs.07-0018.
8. Van der Horst CJ, Bouman MA. Spatiotemporal chromaticity
discrimination. J Opt Soc Am 1969; 59: 1482-1488, doi:
10.1364/JOSA.59.001482.
9. Granger EM, Heurtley JC. Letters to the editor: Visual
chromaticity-modulation transfer function. J Opt Soc Am
1973; 63: 1173-1174, doi: 10.1364/JOSA.63.001173. 10. Kelly DH. Spatiotemporal variation of chromatic and
achromatic contrast thresholds. J Opt Soc Am 1983; 73:
742-750, doi: 10.1364/JOSA.73.000742.
11. Mullen KT. The contrast sensitivity of human colour vision to
red-green and blue-yellow chromatic gratings. J Physiol
1985; 359: 381-400.
12. Campbell FW, Maffei L. Electrophysiological evidence for the existence of orientation and size detectors in the human
visual system.J Physiol1970; 207: 635-652.
13. Seiple WH, Kupersmith MJ, Nelson JI, Carr RE. The assessment of evoked potential contrast thresholds using
real-time retrieval.Invest Ophthalmol Vis Sci1984; 25:
627-631.
14. Katsumi O, Tanino T, Hirose T. Measurement of contrast sensitivity function using pattern-reversal visual evoked
responses.Graefes Arch Clin Exp Ophthalmol1985; 223:
190-195, doi: 10.1007/BF02174058.
15. Strasburger H, Scheidler W, Rentschler I. Amplitude and phase characteristics of the steady-state visual evoked
potential. Appl Opt 1988; 27: 1069-1088, doi: 10.1364/
AO.27.001069.
16. Lopes de Faria JM, Katsumi O, Arai M, Hirose T. Objective measurement of contrast sensitivity function using contrast
sweep visual evoked responses.Br J Ophthalmol1998; 82:
168-173, doi: 10.1136/bjo.82.2.168.
17. Fiorentini A, Burr DC, Morrone CM. Temporal character-istics of colour vision: VEP and psychophysical
measure-ments. In: Valberg A, Lee BB (Editors),From pigments to
perception - advances in understanding visual processes. New York: Plenum Press; 2012. p 139-149.
18. Tobimatsu S, Tomoda H, Kato M. Parvocellular and magnocellular contributions to visual evoked potentials in humans: stimulation with chromatic and achromatic gratings
and apparent motion.J Neurol Sci1995; 134: 73-82, doi:
10.1016/0022-510X(95)00222-X.
19. Arakawa K, Tobimatsu S, Tomoda H, Kira J, Kato M. The effect of spatial frequency on chromatic and achromatic
steady-state visual evoked potentials. Clin Neurophysiol
1999; 110: 1959-1964, doi: 10.1016/S1388-2457(99)00139-X.
20. Campbell FW, Kulikowski JJ. The visual evoked potential as
a function of contrast of a grating pattern.J Physiol1972;
222: 345-356.
21. Regan D. Evoked potentials specific to spatial patterns of
luminance and colour.Vision Res1973; 13: 2381-2402, doi:
10.1016/0042-6989(73)90237-X.
22. Rabin J, Switkes E, Crognale M, Schneck ME, Adams AJ. Visual evoked potentials in three-dimensional color space:
correlates of spatio-chromatic processing.Vision Res1994;
34: 2657-2671, doi: 10.1016/0042-6989(94)90222-4. 23. Porciatti V, Sartucci F. Normative data for onset VEPs to
red-green and blue-yellow chromatic contrast. Clin
Neurophysiol 1999; 110: 772-781, doi: 10.1016/S1388-2457(99)00007-3.
24. Boon MY, Suttle CM, Henry B. Estimating chromatic contrast thresholds from the transient visual evoked
potential. Vision Res 2005; 45: 2367-2383, doi: 10.1016/
j.visres.2005.02.017.
25. Gomes BD, Souza GS, Rodrigues AR, Saito CA, Silveira LC, da Silva Filho M. Normal and dichromatic color discrimination measured with transient visual evoked
potential. Vis Neurosci 2006; 23: 617-627, doi: 10.1017/
S0952523806233194.
26. Gomes BD, Souza GS, Lima MG, Rodrigues AR, Saito CA, da Silva Filho M, et al. Color discrimination ellipses of trichromats measured with transient and steady state visual
evoked potentials. Vis Neurosci 2008; 25: 333-339, doi:
10.1017/S0952523808080383.
27. Souza GS, Gomes BD, Lacerda EM, Saito CA, da Silva Filho M, Silveira LC. Amplitude of the transient visual evoked potential (tVEP) as a function of achromatic and chromatic contrast: contribution of different visual
pathways.Vis Neurosci2008; 25: 317-325, doi: 10.1017/
S0952523808080243.
28. Brainard DH. Cone contrast and opponent modulation color
spaces. In: Kaiser PK, Boynton RM (Editors),Human color
vision. 2nd edn. Washington: Optical Society of America; 1996. p 563-579.
29. Vos JJ. Colorimetric and photometric properties of a 2-deg
fundamental observer.Color Res Appl1978; 3: 125-128,
doi: 10.1002/col.5080030309.
30. Smith VC, Pokorny J. Spectral sensitivity of the foveal cone
photopigments between 400 and 500 nm.Vision Res1975;
15: 161-171, doi: 10.1016/0042-6989(75)90203-5. 31. Cole GR, Hine T. Computation of cone contrasts for color
vision research.Behav Res Methods, Inst Comp1992; 24:
22-27, doi: 10.3758/BF03203465.
32. Celesia GG, Brigell MG. Recommended standards for pattern electroretinograms and visual evoked potentials. The International Federation of Clinical Neurophysiology.
Electroencephalogr Clin Neurophysiol Suppl1999; 52: 53-67. 33. Meigen T, Bach M. On the statistical significance of
electro-physiological steady-state responses.Doc Ophthalmol1999;
98: 207-232, doi: 10.1023/A:1002097208337.
34. Gomes BD, Souza GS, Saito CA, da Silva Filho M, Rodrigues AR, Ventura DF, et al. Cone contrast influence on components of the pattern onset/offset VECP.
Ophthalmic Physiol Opt2010; 30: 518-524, doi: 10.1111/ j.1475-1313.2010.00751.x.
35. Murray IJ, Parry NRA, Carden D, Kulikowski JJ. Human visual evoked potentials to chromatic and achromatic
gratings.Clin Vis Sci1987; 1: 231-244.
intra-cortical responses to chromatic and achromatic stimuli
in primates. Doc Ophthalmol 2002; 105: 243-279, doi:
10.1023/A:1020557105243.
37. McKeefry DJ, Russell MH, Murray IJ, Kulikowski JJ. Amplitude and phase variations of harmonic components in human achromatic and chromatic visual evoked
poten-tials. Vis Neurosci 1996; 13: 639-653, doi: 10.1017/
S0952523800008543.
38. Skottun BC, Skoyles JR. Some remarks on the use of visually evoked potentials to measure magnocellular
activity. Clin Neurophysiol 2007; 118: 1903-1905, doi:
10.1016/j.clinph.2007.06.007.
39. Kulikowski JJ, Robson AG. Spatial, temporal and chromatic
channels: electrophysiological foundations.J Opt Technol
1999; 66: 797-806, doi: 10.1364/JOT.66.000797.
40. Robson AG, Holder GE, Moreland JD, Kulikowski JJ. Chromatic VEP assessment of human macular pigment: comparison with minimum motion and minimum flicker
profiles. Vis Neurosci 2006; 23: 275-283, doi: 10.1017/