Psychophysical measurements of luminance and chromatic
spatial and temporal contrast sensitivity in Duchenne muscular
dystrophy
Marcelo Fernandes Costa, Mirella Telles Salgueiro Barboni and Dora Fix Ventura
Universidade de São Paulo, São Paulo, SP, Brasil
Abstract
In children with Duchenne muscular dystrophy, color vision losses have been related to dystrophin deletions downstream of exon 30, which affect a dystrophin isoform, Dp260, present in the retina. To further evaluate visual function in DMD children, we measured spatial, temporal, and chromatic red-green and blue-yellow contrast sensitivity in two groups of DMD children with gene deletion downstream and upstream of exon 30. Psychophysical spatial contrast sensitivity was measured for low, middle, and high spatial frequencies with achromatic gratings and for low and middle frequencies with red-green and blue-yellow chromatic gratings. Temporal contrast sensitivity was also measured with achromatic stimuli. A reduction in sensitivity at all spatial luminance contrasts was found for the DMD patients with deletion downstream of exon 30. Similar results were found for temporal luminance contrast sensitivity. Red-green chromatic contrast sensitivity was reduced in DMD children with deletion downstream of exon 30, whereas blue-yellow chromatic contrast sensitivity showed no signiicant differences. We conclude that visual function is impaired in DMD children. Furthermore, we report a genotype-phenotype relationship because the visual impairment occurred in children with deletion downstream but not upstream of exon 30, affecting the retinal isoform of dystrophin Dp260. Keywords: Duchenne muscular dystrophy, color vision, contrast sensitivity, temporal and spatial visual function, psychophysics.
Received 4 March 2011; received in revised form 25 May 2011; accepted 25 May 2011. Available on line 15 June 2011.
Marcelo Fernandes Costa, Mirella Telles Salgueiro Barboni, and Dora Fix Ventura, Departamento de Psicologia Experimental, Instituto de Psicologia, Universidade de São Paulo, São Paulo, Brasil. Marcelo Fernandes Costa, Mirella Telles Salgueiro Barboni, and Dora Fix Ventura, Núcleo de Neurociências e Comportamento, Universidade de São Paulo, São Paulo, Brasil. Correspondence regarding this article should be directed to: Marcelo Fernandes da Costa, Departamento de Psicologia Experimental, Instituto de Psicologia, Universidade de São Paulo, Av. Prof. Mello Moraes, 1721, Bloco A, sala D-9, São Paulo, SP 05508-900, Brasil. Phone: +55 11 3091 1918. E-mail: costamf@usp.br
Introduction
Duchenne muscular dystrophy (DMD) is the most common dystrophy disease, which is caused by an alteration in dystrophin. Duchenne muscular dystrophy affects 1 in every 3500 males (Matsuo, 1996; Nobile, Marchi, Nigro, Roberts, & Danieli, 1997; O’Brien & Kunkel, 2001). The dystrophin gene is composed of 79 exons with approximately 2500 kilobases (kb) of DNA (Nobile et al., 1997) and is located in region 21 of the short arm of the X-chromosome. The defective expression of muscle dystrophin, an X-linked genetic disease, is characterized by progressive muscle degeneration, leading to death (Koenig, Monaco, & Kunkel, 1988).
Genetic alterations may differ in DMD patients. Gene deletions occur with a frequency of 65%; duplications occur with a frequency of 5%; and point mutations or deletions/duplications that occur on a small scale occur in 30% (Sitnik et al., 1997; Verbovaia & Razin, 1997). Severely affected DMD patients might have deletions in the regions of dystrophin that make connections with other proteins, such as the N- and C-terminal regions. The less severe cases may have up to 50% deletions of the total size of the gene. If these deletions occur in the central region and do not affect the rod-form region of dystrophin, then the connection sites with other proteins, such as actin, may be preserved (Zatz, 2002).
One of the aspects of phenotypes of DMD and its milder allelic variant Becker muscular dystrophy (BMD) are alterations in the electric activity of the
retina measured by full-ield electroretinogram (ERG).
rod pathway cells (Pillers et al., 1999) and functionally
identiies the outer plexiform layer as the main site of
dystrophin in the retina (D’Souza et al., 1995; Fitzgerald et al., 1999; Fitzgerald, Cibis, Giambrone, & Harris, 1994; Pillers et al., 1993; Yang et al., 2001). A phenotype-genotype correlation was evident in these previous studies, in which reductions were associated with deletion downstream of exon 30. Children with deletion upstream of exon 30 showed a normal ERG. The ERG of cone responses under photopic stimulation revealed a lower amplitude and increased latency of the b-wave (Fitzgerald et al., 1994; Pillers et al., 1999; Schmitz & Drenckhahn, 1997), although these alterations were not as evident as the scotopic ERG changes.
Sigesmund et al. (1994) studied vision in 26
patients with DMD and did not ind alterations in
refraction, ocular motility, or Snellen’s visual acuity. Of these patients, 21 were evaluated with the Farsnworth-Munsell 100Hue and Ishihara color vision tests, and only one showed a red-green defect. The usual clinical measure for evaluating human spatial vision is visual acuity, which is the spatial resolution capacity for a
high-contrast stimulus. Sigesmund et al. (1994) classiied the
spatial vision of their 26 patients as normal, based only on their Snellen visual acuity.
In a recent study, which considered the genotype-phenotype association found in the ERG evaluation, we measured color discrimination in DMD children
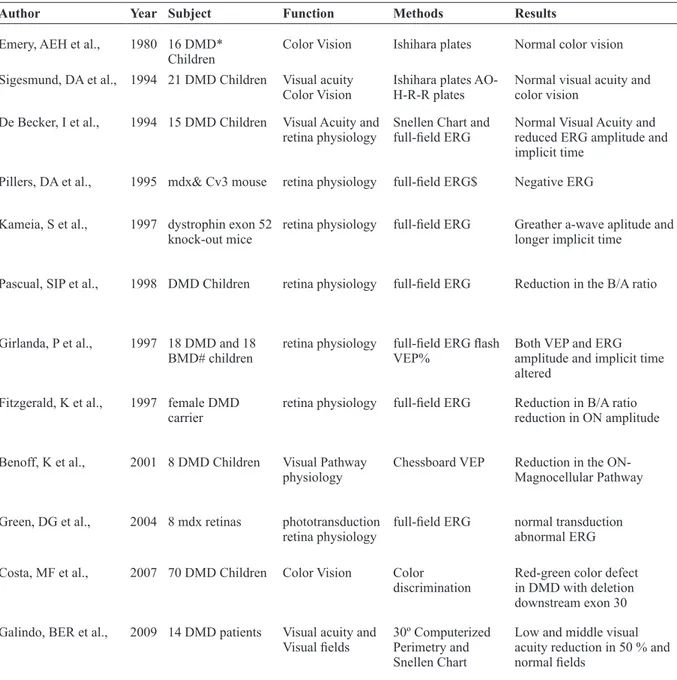
Author Year Subject Function Methods Results
Emery, AEH et al., 1980 16 DMD* Children
Color Vision Ishihara plates Normal color vision
Sigesmund, DA et al., 1994 21 DMD Children Visual acuity Color Vision
Ishihara plates AO-H-R-R plates
Normal visual acuity and color vision
De Becker, I et al., 1994 15 DMD Children Visual Acuity and retina physiology
Snellen Chart and
full-ield ERG Normal Visual Acuity and reduced ERG amplitude and implicit time
Pillers, DA et al., 1995 mdx& Cv3 mouse retina physiology full-ield ERG$ Negative ERG
Kameia, S et al., 1997 dystrophin exon 52 knock-out mice
retina physiology full-ield ERG Greather a-wave aplitude and longer implicit time
Pascual, SIP et al., 1998 DMD Children retina physiology full-ield ERG Reduction in the B/A ratio
Girlanda, P et al., 1997 18 DMD and 18 BMD# children
retina physiology full-ield ERG lash VEP%
Both VEP and ERG amplitude and implicit time altered
Fitzgerald, K et al., 1997 female DMD carrier
retina physiology full-ield ERG Reduction in B/A ratio reduction in ON amplitude
Benoff, K et al., 2001 8 DMD Children Visual Pathway physiology
Chessboard VEP Reduction in the ON-Magnocellular Pathway
Green, DG et al., 2004 8 mdx retinas phototransduction retina physiology
full-ield ERG normal transduction abnormal ERG
Costa, MF et al., 2007 70 DMD Children Color Vision Color discrimination
Red-green color defect in DMD with deletion downstream exon 30
Galindo, BER et al., 2009 14 DMD patients Visual acuity and
Visual ields 30º Computerized Perimetry and Snellen Chart
Low and middle visual acuity reduction in 50 % and normal ields
Table 1. Visual pathway physiology and visual function in DMD patients
grouped according to their gene deletion site (i.e., downstream of exon 30 [dDMD] or upstream of exon 30 [uDMD]; Costa, Oliveira, Feitosa-Santana, Zatz, & Ventura, 2007). A red-green color vision defect was found in children with dDMD. The uDMD children had normal color vision. These results led us to conclude that the impairment in color vision in these DMD children had at least a partial retinal origin.
Vision in DMD patients has not been extensively examined, and very few studies are available. Table 1
summarizes the studies we could ind in the literature.
Little attention has been dedicated to the examination
of visual function in patients with DMD. We had previously
found evident color perception impairment in subjects with dDMD. The present study further investigated visual function in DMD. Psychophysical measurements of spatial and temporal visual processing were conducted by measuring contrast sensitivity for both spatial (luminance and chromatic) and temporal modulations.
Methods
Subjects
The DMD group was composed of 60 boys aged 9 to 21 years (mean, 14.2 years, standard deviation [SD], 4.1 years). They were referred from the Brazilian Muscular Dystrophy Association (ABDIM) in São Paulo. The control group was composed of 24 healthy boys aged 10 to 23 years (mean= 15.4 years; SD= 3.9 years) with no ophthalmological or systemic diseases that could affect the visual system. All subjects underwent ophthalmological examination and had normal eye fundi and visual acuity. The number of subjects tested for each visual function varied because the contrast sensitivity tests were performed on different days to avoid fatigue, and not all subjects could return for the second session. Luminance spatial contrast sensitivity was measured in 57 Duchenne patients and 24 controls. Luminance temporal contrast sensitivity was measured in 32 Duchenne patients (i.e., 22 dDMD and 10 uDMD) and 24 controls. Chromatic spatial contrast sensitivity was measured in 18 Duchenne patients (10 dDMD and 8 uDMD) and seven controls.
Genetic analysis, aimed at identifying the possible deletion or duplication sites in the dystrophin gene, was performed at the Center for Human Genome Studies, Institute of Biosciences, University of São Paulo. All procedures were performed under the tenets of the Declaration of Helsinki and were approved by the Ethical Committee of the University Hospital, University of São Paulo (CEP-HU/USP 642/06). Signed informed consent was obtained from the subjects after explanation of the nature of the study.
Stimuli and procedure
Temporal and spatial luminance contrast sensitivity was measured psychophysically using the PSYCHO
software for Windows, version 2.36 (Cambridge
Research Systems). The stimuli were presented on a 19 inch Sony Trinitron monitor (GFD-420) with a Cambridge Research VSG 2/4 graphic card, a sweeping frequency of 100 Hz, and a resolution of 800 ´ 600 dots per inch (dpi). For the spatial luminance contrast sensitivity measures, the stimuli were black and white sinusoidal gratings subtending 4° of the visual angle at 1
m. We tested the following spatial frequencies: 0.5, 1.0,
2.0, 5.3, 9.7, and 19.4 cycles per degree (cpd). The mean luminance of the stimulus was 34.4 cd/m2, measured
using an Optical OP200-E photometer (Cambridge Research Systems). The stimulus was presented on a gray background of the same mean luminance. Measurements were made monocularly in one randomly selected eye. For more details on the methods, see Ventura et al. (2005a, b) and Canto-Pereira et al. (2005).
To determine the contrast sensitivity function, we used the psychophysical method of adjustments, in which contrast thresholds were obtained by varying contrast at each spatial frequency. The subject was instructed to inform the examiner when he stopped seeing the stimulus and when the stimulus was back. Because some DMD subjects had motor problems in the upper limbs, the examiner controlled the response box (CB3; Cambridge Research Systems), which had two buttons: one was used to adjust the level of the contrast, and the other was used to record the response. At the beginning of the test, the sinusoidal grating was at the maximum contrast. The examiner then reduced the contrast level in 1% steps from 100% to 0% until the subject was unable to discriminate the stimulus from the uniform background. The contrast level was then further reduced by approximately 5%, and then the examiner increased the contrast level in 1% steps until the subject informed the experimenter that he saw the stimulus again. The procedure was repeated three times at each spatial frequency. The presentation of spatial frequencies was randomized by the software.
For the temporal luminance contrast sensitivity measure, we used sinusoidal modulation between black and white with a 2.7° radius Gaussian function superimposed and a cutoff for the average luminance at 1 SD. The mean luminance level was the same as that used
for the spatial contrast measure. We used the following
temporal frequencies: 1.0, 2.0, 10.0, 20.0, and 33.0 Hz. The testing procedure was analogous to that of the spatial contrast sensitivity determination, with the exception that the subject had to inform the examiner
whether the stimulus ceased or started to licker, depending
using a heterochromatic licker photometry procedure at 20
Hz. All measurements were performed monocularly in the same eye that was selected for luminance contrast sensitivity. The chromaticities of the stimuli in x, y coordinates of the 1931 CIE color space were the following: D6500: 0.296, 0.31; green: 0.225, 0.333; red: 0.356, 0.275; blue: 0.254, 0.2; yellow: 0.386, 0.53. The red–green and blue–yellow axes were orthogonal and corresponded, respectively, to L–M-isolating and S-isolating stimuli (De Valois, De Valois, Switkes, & Mahon, 1997).
Results
A full descriptive analysis was performed for the data. The normality of distribution was checked using the
Komolgorov-Smirnov test. Because the results were close to normality, one-way analysis of variance (ANOVA) was used to assess the mean differences, followed by the
Fisher Least Signiicant Difference (LSD) post hoc test
when signiicant differences were observed.
Table 2 shows a summary of the results found for the DMD groups compared with the controls for each visual function tested.
Luminance contrast sensitivity
Spatial modulation
The average (± 1 SD) luminance spatial contrast sensitivity as a function of spatial frequency is shown in Figure 1 for each group. The luminance spatial contrast
DMD Upstr 30# DMD Downstr 30$
Luminance Contrast Senstivity
Spatial Modulation (cpd)
0.5 NS* p< 0.001
1.0 NS p< 0.001
2.0 NS p< 0.001
5.3 NS p< 0.001
9.7 NS p< 0.001
19.4 NS p< 0.001
Temporal Modulation (Hz)
1.0 NS p< 0.001
2.0 NS p< 0.001
10.0 NS p< 0.001
20.0 NS p= 0.011
33.0 NS NS
Chromatic Contrast Senstivity
Red-green Modulation (cpd)
0.2 NS p= 0.002
0.3 NS p= 0.003
0.5 NS p= 0.002
0.7 NS p< 0.001
1.2 NS p< 0.001
2.0 NS p< 0.001
Blue-Yellow Modulation (cpd)
0.2 NS NS
0.3 NS NS
0.5 NS NS
0.7 NS NS
1.2 NS p= 0.004
2.0 NS p= 0.002
Table 2. Summary of the Contrast Sensitivity Results for DMD Children Compared to Control Subjects
sensitivity functions (CSFs) exhibit normal bandpass shapes known for sinusoidal gratings in all groups, but the controls’ thresholds were higher than the patients’
thresholds (Figure 1). A statistically signiicant difference
between the results from control subjects and dDMD subjects was found for the low and lower-middle spatial frequencies (0.5 cpd, F = 17.31, p < .001; 1.0 cpd, F =
26.22, p < .001; 2.0 cpd, F = 30.88, p < .001). For the higher-middle spatial frequency (5.3 cpd, F = 20.72, p < .001) and high spatial frequencies (9.7 cpd, F = 21.42, p < .001; 19.4 cpd, F = 35.89, p < .001), signiicant differences
were found between the controls and the dDMD group.
Temporal modulation
Luminance temporal contrast sensitivity was measured in 32 Duchenne patients (i.e., 22 dDMD and 10 uDMD) and 24 age-matched control subjects. The temporal CSFs exhibited bandpass shapes in all groups (Figure 2).
Signiicant differences were found between groups at all
temporal frequencies, with the exception on 33 Hz (p > .05).
Figure 1. Spatial luminance contrast sensitivity function in controls and DMD children. A sensitivity reduction of approximately 0.5 log unit was found in the DMD children with deletion downstream of exon 30 for all spatial frequencies.
Figure 2. Temporal luminance contrast sensitivity function in controls and DMD children. Sensitivity reduction was found in the DMD children with deletion downstream of exon 30 at all temporal frequencies, with the exception of 33 Hz.
For 1 and 2 Hz, the control subjects and uDMD patients differed from the dDMD patients (1 Hz, F = 9.87, p < .001; 2 Hz, F = 6.86, p < .001). For 10 and 20 Hz, control subjects differed only from dDMD subjects (F = 8.28, p < .001, and
F = 5.03, p = .011, respectively). For 33 Hz, controls and both groups of Duchenne patients had similar thresholds.
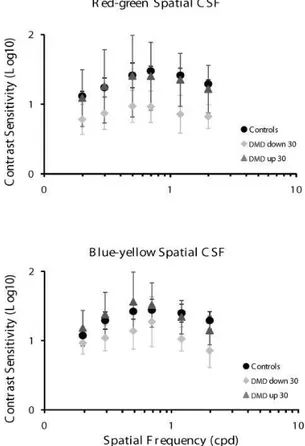
Chromatic contrast sensitivity
In the red-green spatial CSF, control subjects and uDMD patients had higher contrast sensitivity values compared with the dDMD group for all spatial frequencies (0.2 cpd, F = 9.43, p = .002; 0.3 cpd, F = 7.27, p = .003; 0.5 cpd, F = 8.96, p = .002; 0.7 cpd, F = 22.54, p < .001; 1.2 cpd, F = 10.53, p < .001; 2 cpd, F = 19.09, p < .001).
Figure 3. Red-green (upper panel) and blue-yellow (lower panel) chromatic contrast sensitivity function in controls and DMD children. Sensitivity reduction was found for red-green contrast in DMD children with deletion downstream of exon 30 compared with controls at all spatial frequencies. Blue-yellow contrast showed a reduction in sensitivity only for the two highest spatial frequencies tested.
Discrepant results were found for the blue-yellow spatial CSF compared with the results of the red-green CSF.
Signiicant differences were found in the control group and
Discussion
The present study revealed visual losses in dDMD patients for the detection of spatial luminance and chromatic sinusoidal gratings and for the processing of temporally modulated stimuli. The visual system in DMD patients has been studied more intensely in the past two decades, mainly using electrophysiological methods (Ino-ue et al., 1997; Fitzgerald et al., 1999; Pillers et al., 1999). The few studies that investigated
visual function behaviorally did not ind alterations in
color vision or visual acuity (Sigesmund et al. 1994). In contrast with these results, our previous work found that a red-green color vision defect existed in DMD children with dDMD (Costa et al., 2007; Costa, Oliveira, Feitosa-Santana, Zatz, & Ventura, 2008). This result was consistent with ERG studies that demonstrated impairment associated with this genotype (Fitzgerald et al., 1999; Pillers et al., 1993, 1999).
To our knowledge, the present study shows the irst
contrast sensitivity data obtained in patients with DMD. The only information available in the literature about spatial vision in subjects with DMD is from the work of Sigesmund et al. (1994), in which Snellen visual acuity was evaluated in 20 DMD children who were found to have normal vision.
The early studies on vision in DMD children concluded that they had normal vision, despite abnormal
ERG indings (Sigesmund et al., 1994). However, we
showed in our previous work and in the present study that the dDMD subgroup of children had chromatic and spatial vision impairment, and these impairments were
related to a speciic visual pathway, as explained below.
Spatial and temporal perception
The spatial luminance contrast sensitivity results showed a reduction in sensitivity in the dDMD subjects compared with control and uDMD subjects. The reduction observed occurred at all spatial frequencies tested, suggesting a decrease in the perceptual ability to visually detect spatial changes of luminance for a wide range of size elements.
The deletion that occurs downstream of exon 30 impairs Dp260 function and the existence of the phenotype-genotype relationship strongly supports the hypothesis that the reduction in CSF could be related to damage of the visual information processing pathways at the retinal level.
The signiicant reduction in spatial contrast sensitivity
of almost one log unit compared with the control group is fundamentally important for clinical application. Unfortunately, the clinical evaluation of spatial visual function is limited to the measurement of visual acuity. For this reason, DMD patients were regarded as having normal vision by Sigesmund et al. (1994).
In the present work, contrast sensitivity was also
tested for temporally modulated stimuli. We found a
reduction in the detection of luminance contrasts for the two lowest temporal modulations (i.e., 1 and 2 Hz). The reduction affected visual function in dDMD subjects, suggesting a phenotype-genotype relationship. The reduction in the lowest temporal frequencies also has important physiological implications related to the visual pathways, which is discussed in the following section.
No signiicant difference was found for the highest
temporal frequency tested (i.e., 33 Hz). At this temporal frequency, the ability to discriminate differences in contrast was reduced in all groups, and showing differences between groups was not possible. Nevertheless, the similar luminance detection found for the 20 Hz modulations indicates that the information processing for high temporal frequencies was preserved in dDMD children.
Interesting results were obtained with regard to spatial chromatic CSF. For red-green contrast, the
sensitivity of dDMD children was signiicantly reduced
compared with controls and uDMD children. However, for the blue-yellow color contrast, the difference was only found for the two highest spatial frequencies tested, with the dDMD children being the most affected group. This result is consistent with our previous study of color discrimination (Costa et al., 2007, 2008), in which we found red-green color vision impairment in dDMD children and normal blue-yellow discrimination.
These results suggest that the dystrophy isoform (Dp260) plays an important role in retina physiology (Ino-ue et al., 1997; Pillers, 1999), and impairment in the gene structure caused by deletions affects many visual functions (Costa et al., 2007, 2008).
Possible visual pathways implications
Visual information is conducted to the visual areas of the brain via three main visual pathways: (i) magnocellular pathway, related to processing of high temporal frequencies and low spatial frequencies, (ii) parvocellular pathway, related to low temporal and high spatial frequencies and red-green color processing, and (iii) koniocellular pathway, related to blue-yellow color vision, low to middle spatial frequencies, and middle to high temporal frequencies (for review, see Xu et al., 2001). The battery of spatial and temporal contrast sensitivity tests that we used supports the hypothesis that the parvocellular pathway is the most
affected visual pathway in DMD. With regard to
spatial contrast sensitivity, we found impairment at
all spatial frequencies, relecting both magno- and
pathway. Our chromatic contrast sensitivity results showed red-green impairment but quasi normal blue-yellow color contrast, in which worse discrimination was observed only for the highest spatial frequencies, reinforcing the conclusion of preferential parvocellular pathway impairment in dDMD children.
Previous studies in DMD children that used electrophysiological methods found impairment in the functions processed by the magnocellular pathways (Benoff et al., 2001). They measured VEPs to checkerboard stimuli of different spatial frequencies in black-gray and white-gray modulation to isolate the ON- and OFF-pathway responses. They found a large reduction in magnocellular ON-pathway luminance processing in dDMD children. Our observation of reduced contrast sensitivity at low spatial frequencies is consistent with this previous study and supports the possible existence of magnocellular impairment in dDMD children. One possibility is that spatial processing mediated by the magnocellular pathway could be impaired despite normal or close to normal temporal processing.
No differences were found between the two DMD groups and controls for blue-yellow contrast sensitivity.
This absence of impairment conirms our previous
results on chromatic discrimination, showing that dDMD children had selective red-green impairment and normal discrimination along the blue-yellow color confusion axis.
The mechanisms that underlie this color vision loss in DMD are unknown. Some possible explanations may explain why deletion downstream of exon 30 had greater effects in parvo- and magnocellular visual pathway function despite normal visual function processed by the koniocellular pathway. The participation of S-cones in the detection of the luminance levels of stimuli with spatial variations is practically null (Kaiser & Boynton, 1996); therefore, normal S-cone function can coexist with a generalized reduction in spatial contrast sensitivity function, similar to the present observations. Dystrophin is present in all three cone types and in rods, which would lead to the expectation that a deletion in its gene would result in impairment for all visual functions tested. However, our results revealed a different picture. Blue-yellow contrast sensitivity and the response to high temporal frequencies were unimpaired.
The understanding of S-cone color processing in the retina is limited, and the existence of the S-OFF cone pathway in the retina is still not established (Dacey
& Packer, 2003; Lee, 2004; Joselevitch, 2008). We may
attempt to understand why blue system sensitivity is spared in DMD by examining the morphology of the connections between S-cones and ON bipolar cells. A study by Calkins (2001) showed that ON bipolar cells make contact with S-cones in two different ways: characteristic ON-type invaginating contacts and other numerous semi-invaginating contacts with S-cones.
Because dystrophin would affect invaginating contacts because of its location near the synaptic ribbon,
it might not inluence the physiology of these ON
bipolar cells, considering that most of their contacts with S-cones are located close to, but not directly in, the invaginating region. This could explain why DMD children had normal blue-yellow contrast sensitivity. The normal temporal contrast sensitivity for higher spatial frequencies could also be attributable to the
speciicity of koniocellular pathway synapses. Konio
cells have three subgroups: K1 and K2 related to spatial and temporal information processing and K3 related to color processing (Xu et al., 2001). The K1 and K2
subgroups could maintain suficient information of
temporal processing, supporting normal temporal contrast sensitivity for middle and higher frequencies.
Concluding remarks
In recent years, studies have shown that dDMD
children have abnormal ERG function. We showed that
they also have impairment in spatial, temporal, and chromatic visual function mediated by the parvocellular and magnocellular pathways, with normal blue-yellow chromatic visual function. The phenotype-genotype relationship suggests that the early stages of sensory inputs of visual information are damaged, and the visual losses could be at least partially attributable to impairment in the Dp260 retinal isoform of dystrophin. The selective losses in the parvocellular pathway and magnocellular pathway, although less evident, should be investigated further. Analyses of the anatomical and physiological properties of the retina that could be related to these losses may lead to future studies on retinal structure and physiology.
Children with DMD also have mental impairment,
relected in borderline or reduced scores in the full intelligence quotient and visuospatial tests (Wicksell, Kihlgren, Melin,
& Eeg-Olofsson, 2004), visuomotor impairment (Marsh, 1972; Mehler, 2000), a reduction in verbal ability (Bresolin et al., 1994), and impairment in reading ability (Billard, Gillet, Barthez, Hommet, & Bertrand, 1998).
Improvements in respiratory management and pharmacological drugs have increased the life expectancy of DMD children by almost a decade. Understanding their sensory, perceptual, and cognitive capacities will became crucial for increasing their
quality of life through the support of more eficient
rehabilitation procedures.
Acknowledgements
We would like to thank Mayana Zatz from the
Temático, FAPESP (02/12344-8) to DFV. MFC and DFV are CNPq (Conselho Nacional de Desenvolvimento
Cientíico e Tecnológico) research fellows, and MTSB
has a FAPESP doctoral fellowship (2007/55125-1).
References
Benoff, K., Fitzgerald, K., Zemon, V., Pinkhasov, E., Gordon, J., & Cibis, G. (2001). Magnocellular ON-pathway deicits in Duchenne
muscular dystrophy: a visual evoked potential study. Investigative
Ophthalmology & Visual Science, 42, S787.
Billard, C., Gillet, P., Barthez, M., Hommet, C., & Bertrand, P. (1998). Reading ability and processing in Duchenne muscular dystrophy
and spinal muscular atrophy. Developmental Medicine and Child
Neurology, 40, 12-20.
Blake, D.J., & Kroger, S. (2000). The neurobiology of Duchenne
muscular dystrophy: learning lessons from muscle? Trends in
Neurosciences, 23, 92-99.
Bresolin, N., Castelli, E., Comi, G.P., Felisari, G., Bardoni, A., Perani, D., ...Scarlato, G. (1994). Cognitive impairment in Duchenne
muscular dystrophy. Neuromusculal Disorders, 4, 359-369.
Calkins, D.J. (2001). Seeing with S cones. Progress in Retinal and
Eye Research, 20, 255-287.
Canto-Pereira, L.H.M., Lago, M., Costa, M.F., Rodrigues, A.R., Saito, C.A., Silveira, L.C.L., & Ventura, D.F. (2005). Visual impairment on dentists related to occupational mercury exposure.
Environmental Toxicology and Pharmacology, 19, 517-522.
Costa, M.F., Oliveira, A.G.F., Feitosa-Santana, C., Zatz, M., & Ventura, D.F. (2007). Red-green color vision impairment in
Duchenne muscular dystrophy. American Journal of Human
Genetics, 80, 1064-1075.
Costa, M.F., Oliveira, A.G.F., Feitosa-Santana, C., Zatz, M., & Ventura, D.F. (2008). Red-green color vision impairment in
Duchenne muscular dystrophy. American Journal of Human
Genetics, 83, 148-149.
Dacey, D.M., & Packer, O.S. (2003). Colour coding in the primate retina: diverse cell types and cone-speciic circuitry. Current
Opinion in Neurobiology, 13, 421-427.
De Valois, R.L., De Valois, K.K., Switkes, E., & Mahon, L. (1997). Hue scaling of isoluminant and cone-speciic lights. Vision
Research, 37, 885-897.
D’Souza, V.N., Nguyen, T.M., Morris, G.E., Karges, W., Pillers, D.A.M., & Ray, P.N. (1995). A novel dystrophin isoform is
required for normal retinal electrophysiology. Human Molecular
Genetics, 4, 837-842.
Fitzgerald, K.M., Cibis, G.W., Giambrone, S.A., & Harris, D.J. (1994). Retinal signal transmission in Duchenne muscular-dystrophy: evidence for dysfunction in the photoreceptor/depolarizing bipolar
cell pathway. Journal of Clinical Investigation, 93, 2425-2430.
Fitzgerald, K.M., Cibis, G.W., Gettel, A.H., Rinaldi, R., Harris, D.J., & White, R.A. (1999). ERG phenotype of a dystrophin mutation in heterozygous female carriers of Duchenne muscular dystrophy.
Journal of Medical Genetics, 36, 316-322.
Girlanda, P., Quartarone, A., Buceti, R., Sinicropi, S., Macaione, V., Saad, F.A., ...Vita, G. (1997). Extra-muscle involvement in dystrophinopathies: an electroretinography and evoked potential
study. Journal of the Neurological Sciences, 146, 127-132.
Ino-ue, M., Honda, S., Nishio, H., Matsuo, M., Nakamura, H., & Yamamoto, M. (1997). Genotype and electroretinal heterogeneity
in Duchenne muscular dystrophy. Experimental Eye Research, 65,
861-864.
Joselevitch, C. (2008). Human retinal circuitry and physiology.
Psychology and Neuroscience, 1(2), 141-165.
Kaiser, P.K., & Boynton, R.M. (1996). Human color vision, 2nd
edition. Washington, D.C.: Optical Society of America.
Koenig, M., Monaco, A.P., & Kunkel, L.M. (1988). The complete sequence of dystrophin predicts a rod-shaped cytoskeletal protein.
Cell, 53, 219-228.
Lee, B.B. (2004). Paths to colour in the retina. Clinical and
Experimental Optometry, 87, 239-248.
Marsh, G.G. (1972). Impaired visual-motor ability of children with
Duchenne muscular dystrophy. Perceptual and Motor Skills, 35,
504-506.
Matsuo, M. (1996). Duchenne/Becker muscular dystrophy: from
molecular diagnosis to gene therapy. Brain and Development, 18,
167-172.
Mehler, M.F. (2000). Brain dystrophin, neurogenetics and mental
retardation. Brain Research Brain Research Reviews, 32, 277-307.
Nobile, C., Marchi, J., Nigro, V., Roberts, R.G., & Danieli, G.A. (1997). Exon-intron organization of the human dystrophin gene.
Genomics, 45, 421-424.
O’Brien, K.F., & Kunkel, L.M. (2001). Dystrophin and muscular
dystrophy: past, present, and future. Molecular Genetics and
Metabolism, 74, 75-88.
Pillers, D.A. (1999). Dystrophin and the retina. Molecular Genetics
and Metabolism, 68, 304-309.
Pillers, D.A.H., Fitzgerald, K.M., Duncan, N.M., Rash, S.M., White, R.A., Dwinnell, S.J., …Weleber, R.G. (1999). Duchenne/ Becker muscular dystrophy: correlation of phenotype by
electroretinography with sites of dystrophin mutations. Human
Genetics, 105, 2-9.
Pillers, D.A.M., Bulman, D.E., Weleber, R.G., Sigesmund, D.A., Musarella, M.A., Powell, B.R., …Ray, P.N. (1993). Dystrophin expression in the human retina is required for normal function as deined by electroretinography. Nature Genetics, 4, 82-86. Schmitz, F., & Drenckhahn, D. (1997). Dystrophin in the retina.
Progress in Neurobiology, 53, 547-560.
Sigesmund, D.A., Weleber, R.G., Pillers, D.A.M., Westall, C.A., Panton, C.M., Powell, B.R., …Ray, P.N. (1994). Characterization of the ocular phenotype of Duchenne and Becker muscular
dystrophy. Ophthalmology, 101, 856-865.
Sitnik, R., Campiotto, S., Vainzof, M., Pavanello, R.C., Takata, R.I., Zatz, M., & Passos-Bueno, M.R. (1997). Novel point mutations in
the dystrophin gene. Human Mutation, 10, 217-222.
Ventura, D.F., Quiros, P., Carelli, V., Salomão, S.R., Gualtieri, M., Oliveira, A.G.F., ....Sadun, A.A. (2005a). Chromatic and luminance contrast sensitivities in asymptomatic carriers from a large Brazilian pedigree of 11778 Lebers hereditary optic neuropathy.
Investigative Ophtalmology and Visual Science, 46, 4809-4814.
Ventura, D.F., Simões, A.L.A C., Tomaz, S., Costa, M.F., Lago, M., Costa, M.T.V., .... Silveira, L.C.L. (2005b). Colour vision and contrast sensitivity losses of mercury intoxicated industry workers in
Brazil. Environmental Toxicology and Pharmacology, 19, 523-529.
Verbovaia, L.V., & Razin, S.V. (1997). Mapping of replication origins and termination sites in the Duchenne muscular dystrophy gene.
Genomics, 45, 24-30.
Wicksell, R.K., Kihlgren, M., Melin, L., & Eeg-Olofsson, O. (2004). Speciic cognitive deicits are common in children with
Duchenne muscular dystrophy. Developmental Medicine and Child
Neurology, 46, 154-159.
Xu, X., Ichida, J.M., Allison, J.D., Boyd, J.D., Bond, A.S., & Casagrande, V.A. (2001). A comparison of koniocellular, magnocellular and parvocellular receptive ield properties in the
lateral geniculate nucleus of the owl monkey (Aotus trivirgatus).
Journal of Physiology, 531, 203-218.
Yang, Y., Zhang, C., Sheng, W., Pan, S., Wu, D., & Jiang, F. (2001). [Correlation between electroretinographic indings, clinical phenotypic and genotypic analysis in Duchenne and Becker muscular
dystrophy]. Zhonghua Yi Xue Yi Chuan Xue Za Zhi, 18, 32-34.
Zatz, M. (2002). A biologia molecular contribuindo para a
compreensão e a prevenção das doenças hereditárias. Ciência &