Comparative analysis of tidepool fish species composition on
tropical coastal rocky reefs at State of Ceará, Brazil
Edna A. Cunha1,2, Roberto A. A. Carvalho1,2, Cassiano Monteiro-Neto3, Luiz Eduardo S. Moraes3
& Maria Elisabeth Araújo2
1. Departamento de Engenharia de Pesca, Universidade Federal do Ceará, Campus Universitário do Pici, Bloco 827, 60356-000 Fortaleza, CE, Brazil. ([email protected]) ([email protected])
2. Grupo de Ictiologia Marinha Tropical – IMAT, Departamento de Oceanografia, Universidade Federal de Pernambuco, Av. Arquitetura, s/n, 50740-550 Recife, PE, Brazil. ([email protected])
3. Departamento de Biologia Marinha, Universidade Federal Fluminense, Caixa Postal 100644, 24001-970 Niterói, RJ, Brazil. ([email protected])
ABSTRACT. This study compared tidepool fish assemblages within and among habitats at Iparana and Pecém beaches, State of Ceará, Northeast Brazil, using visual census techniques. A total of 8,914 fishes, representing 25 families and 43 species were recorded. The most abundant taxon was Sparisoma spp, followed by Haemulon parra (Desmarest, 1823), Acanthurus chirurgus (Bloch, 1787) and Abudefduf saxatilis (Linnaeus, 1758). Haemulidae was the most abundant family in number of individuals, followed by Scaridae, Acanthuridae and Pomacentridae. Within- and between- site differences in species assemblages probably reflected environmental discontinuities and more localized features, such as pool isolation episodes, or environmental complexity, both acting isolated or interactively. The locality of Iparana was probably subjected to a greater fishing pressure and tourism than Pecém, a potential cause for the observed lowest fish abundance and biodiversity. We conclude that tidepool ichthyofauna may be quite variable between and within reef sites. Thus, observations taken from or damages caused on one area may not be generalized to or mitigated by the protection of adjacent sites.
KEYWORDS. Visual census, fish assemblages, abundance, biodiversity.
RESUMO.Análise comparativa da composição das espécies de peixes em poças de maré em recifes costeiros no estado do Ceará, Brasil. Este estudo comparou assembléias de peixe em poças de maré dentro e entre hábitats nas praias de Iparana e Pecém, estado do Ceará, nordeste do Brasil, usando técnicas de censo visual. Um total de 8.914 peixes, representando 25 famílias e 43 espécies foi registrado. Sparisoma spp. formaram o taxon mais abundante, seguido por Haemulon parra (Desmarest, 1823), Acanthurus chirurgus
(Bloch, 1787) e Abudefduf saxatilis (Linnaeus, 1758). Haemulidae foi a família mais abundante em número de indivíduos, seguida por
Scaridae, Acanthuridae e Pomacentridae. Diferenças encontradas nas assembléias de espécies provavelmente refletiram descontinuidades ambientais e aspectos mais localizados, como a ocorrência de isolamento das poças, ou complexidade ambiental atuando de forma isolada ou interativamente. A localidade de Iparana provavelmente foi submetida a uma maior pressão de pesca e turismo que Pecém, uma causa potencial para a menor abundância e biodiversidade de peixes observada. Concluímos que a ictiofauna de poça de maré pode ser variável dentro dos recifes e entre localidades diferentes. Assim, observações tomadas ou os danos causados em uma dada área não podem ser generalizados ou mitigados para a proteção de locais adjacentes.
PALAVRAS-CHAVE. Censo visual, assembléias de peixe, abundância, biodiversidade.
Tropical reef fish communities are rich and complex, and comprise species of different ecological strategies, at several life history stages. Coastal intertidal reefs and their associated tidepools are important habitats, especially for young-of-the-year of both coastal and oceanic fish species, some of which of special economic interest (CADDY & SHARP, 1986; GRIFFITHSet al., 2003).
MORING (1986) studied the use of tidepools as breeding areas by many fish species, whereas UNDERWOOD & CHAPMAN (1996) observed that rock pools might provide refuges for many intertidal and subtidal invertebrates. In fact, ROSA et al. (1997) stressed the
importance of tidepools for both coastal and marine fish populations, as these habitats maybe part of the home ranges for some species.
Tidepools are often used by swimmers, artisanal fishers, and may be impacted by development in the coastal zone. In the state of Ceará, artisanal fishers and seaweed collectors harvest on coastal reefs and tidepools, and have reduced considerably the abundance of some taxon (Dárlio A. Teixeira, pers. comm.). Uncontrolled fish and live rock (reef rocks containing
sponges, corals, crabs, shrimps, algae and natural bacteria) collection for the aquarium trade have also negatively impacted fish communities of these habitats (WOOD & WELLS, 1988; MONTEIRO-NETO et al., 2003).
Finally, reefs and tidepools have been impacted at several scales due to coastal development, resulting in coastal erosion, habitat loss and reduction of biodiversity (CAMPOS et al., 2003). Therefore, reef fish studies are
essential for a precise evaluation of the damages caused by those activities and the elaboration of environmental management plans.
Few studies have addressed reef fishes in Northeast Brazil. Early studies on tidepool fishes were limited to species inventory (ARAÚJOet al., 2000). More
recently, research focused on the distribution, abundance and diversity of reef fish fauna (FERREIRAet al., 1995;
ROSA & MOURA, 1997; ROCHAet al., 1998; ROCHA & ROSA, 2001a and FEITOSAet al., 2002). ROSAet al. (1997) studied
Reef topography usually limits the array of sampling techniques to highly selective fishing strategies such as hook and line and spearfishing (FERREIRAet al., 1995).
Therefore, several complimentary techniques are needed to fully assess reef fish communities (ZAPATA, 1992). Alternatively, underwater visual census broadens the limits of reef fish community studies, allowing the simultaneous data collection on species composition and abundance, ecology and behavior (FERREIRAet al., 1995).
One pitfall of visual census may be the underestimation of cryptic species. ACKERMAN & BELLWOOD (2000) observed that a significant proportion of the total number and biomass of fishes on the reef were not accounted for by visual census. Nevertheless, non-destructive techniques should be recommended whenever reef ecosystem conservation is at stake, due to their little environmental interference and the possibility of fish observation in their natural habitat (ROSAet al., 1997).
The aim of this study was to investigate aspects of the tidepool fish assemblages structure to: (i) provide information on the composition of species found in tidepools of tropical coastal rock reefs at state of Ceará, Northeast Brazil; (ii) quantitatively document the patterns of variation in fish assemblages’ structure within and between reef localities; (iii) discuss which environmental variables may be important in influencing the structure of tidepool fish assemblages.
MATERIALS AND METHODS
Underwater censuses were performed in four tidepools located along intertidal reefs at the beaches of Iparana (3o41’21”S, 38o36’36”W) and Pecém (3o32’40”S,
38o48’52”W), situated nearly 40 km apart from each other
in the coast of State of Ceará, NE Brazil (Fig. 1). Sandstone, Calcium Carbonate and Iron Oxide reefs extended from the beach face to nearly two hundred meters seaward, and were exposed at spring low tides (MORAIS, 1968).
Tidepools selected for this study were characterized by a sand-rubble bottom with sparsely distributed small boulders, and walls partially covered with macroalgae. The pools became isolated from the sea at 0.3 m low tides.
Pools 1 and 2 were located at Iparana, and 3 and 4 at Pecém reefs (Fig. 1). Each pool was visually examined for the percent cover of the substrate (sand-rubble, bare rock, rock covered with algae). The structural complexity was assessed based on frequency of occurrence of each of the three dimensions (presence of pebbles, crevices and holes) and put into one of the categories (high, medium, low). The surface area (A) of each tidepool was estimated by adding up the triangular areas to match the approximate surface area of the tidepool. Average depth (D) was estimated from three measurements taken at random locations along a longitudinal transect in order to estimate the volume (V = A x D).
Visual census methodology was adapted from CHRISTENSEN & WINTERBOTTOM (1981) in respect to observation time, and consisted of an intensive species search, by snorkeling around the internal rim of the tidepool. Each full search lasted less than 25 minutes to avoid repetitive counts. Species were identified and counted by trained divers, and data recorded on PVC boards. Visual censuses were conducted monthly during daytime, at tides lower than or equal 0.3 m (pools became isolated). A total of 96 censuses were conducted from June 1998 to June 2000. When species determination was uncertain in the field, specimens were captured for laboratory identification. These specimens were not included in the statistical analysis. Taxonomic identification was based on BURGESS et al. (1990),
CERVIGÓN (1991, 1993, 1994, 1996), FIGUEIREDO & MENEZES (1978, 1980, 2000), HUMANN (1995), MENEZES & FIGUEIREDO (1980, 1985), RANDALL (1996) and ROBINS (1986). The revisions of Anisotremus moricandi (Ranzani, 1842), Halichoeres brasiliensis (Bloch, 1791) and Halichoeres penrosei Starcks, 1913 were based on ACERO & GARZÓN (1982), ROCHA & ROSA (2001b) and ROCHA (2004) respectively, and were aided by specialists and visits to University and Museum Collections. Sparisoma spp. (S. axillare (Steindachner, 1878) or S. frondosum (Agassiz,
1831), following MOURAet al., 2001)) were left at the genus
level due to the subtle visual identification of small individuals in waters of low visibility. The collected material was identified, photographed, preserved and deposited at the Collection of Aquatic Biology, Department of Engenharia de Pesca, Universidade Federal do Ceará.
Occurrence and abundance patterns and species associations were studied through cluster analysis and PCA ordination. Abundance data was distributed on a species (rows) by sample (columns) data matrix. Species representing less than or equal to 10% of the hypothetical abundance of 44 individuals (one individual per sample) were discarded to reduce bias and contagion as other authors have suggested (BOESCH, 1977; MONTEIRO-NETO
et al., 2003). Thirty-two species were included in the
analysis.
The Hellinger’s Distance was used as a similarity measure for both cluster and ordination analyses. This distance reduces the effects of null abundances inherent of biological surveys and better resolves the proportional similarities between less common species and abundant ones (LEGENDRE & GALLAGHER, 2001; LEGENDRE & LEGENDRE, 1998). The distance was calculated by
Fig. 1. Map of Brazil within South America, the State of Ceará within Brazil , and both studied localities within the coastal zone of the state, showing their distance relation between each other and among the state Capital Fortaleza.
Pecém
FORTALEZA
0 5 10 15 20 25
Nautical Miles
N
Iparana Ceará
applying the Euclidean Distance to transformed abundance data, following LEGENDRE & GALLAGHER (2001), for both Q-mode and R-mode analysis. A Ward clustering strategy was used to form species and sample groups (MILLIGAN & COOPER, 1987). Analyses were conducted on Statistica for Windows (v.5.5) and Fitopac (developed by George Shepperd, Departamento de Botânica, UNICAMP - Brazil).
Differences between species and sample groups defined in cluster analysis were statistically tested using a Monte Carlo permutation model. The Hellinger’s distance between all group centroids was calculated using the objects (species or samples) within group mean abundances, and set as benchmarks. Ten thousand permutations on the original abundance values were performed, and the proportion of null centroid distances (p) higher than or equal to the correspondent benchmarks was calculated. Groups were considered significantly different from each other if p ≤ 0.05. This test was performed on Excel’s add in Resampling (Resampling Stats 1999).
To facilitate cluster interpretation, Q- and R-mode classifications were related to each other using nodal analysis, which determines species-collections coincidences (BOESCH, 1977). Nodal analysis related dendrograms to each other, by calculating the frequency of occurrence and transformed average abundance of species within sample groups, providing a near tridimensional space to interpret species-habitat relationships (ROSSI-WONGTCHOWSKI & PAES, 1993).
Indicator Values (IndVal) were calculated for all 32 species, in order to identify indicator species for typologies of ecological samples obtained by Q-mode classification. Species presenting significant IndVal lower than or equal to 0.5 (p≤0.05) were considered as indicators of the sample groups. Calculations used sample groups derived from cluster analysis and followed DUFRENE & LEGENDRE (1997). All values were tested with 10,000 Monte Carlo permutations. IndVal calculations and statistical tests were performed on PCOrd for Windows, version 3.0 (MCCUNNE & MEFFORD, 1997).
The transformed data matrix was also submitted to Principal Component Analysis where both sample and species gradients were analyzed along the resulting Canonical Axes. Analyses were carried on CANOCO for Windows v.4.0 (TER BRAAK & SMILAUER, 1998).
Shannon-Wiener (H) and Simpson (D) diversity (SIMPSON, 1949) were compared among classification groups and tidepools using the averaged species abundances within classification groups or pools. Renyi´s graphic ordination method was used to check whether groups or pools were comparable (RENYI, 1961). If the resulting diversity patterns are parallel to each other, species diversity may be compared, whereas when lines cross each other, no comparisons are possible. Differences among average diversity were statistically tested with bootstrapping following the model proposed by SOLOW (1993). For all procedures the Species Diversity and Richness v.2.3 software was used (Henderson and Seaby, Pisces Conservation, ltd., 1998).
RESULTS
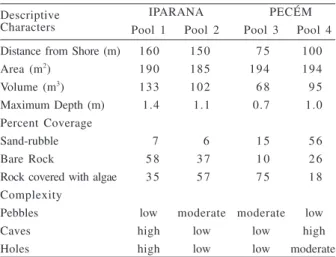
The physical descriptors of each of the examined tidepools are presented in table I. All pools had nearly the same area, ranging between 185 to 194 m2, but pool
volume differed considerably, especially between pool 1 (deepest) and 3 (shallowest). With respect to substrate cover, Iparana pools tended to present a greater proportion of bare rock and rock covered with algae, whereas Pecém pools had a greater proportion of rock covered with algae (pool 3) and sand (pool 4). Pools 1 and 4 apparently showed a greater habitat complexity represented by a greater frequency of occurrence of crevices and holes as compared to the other pools examined (Tab. I).
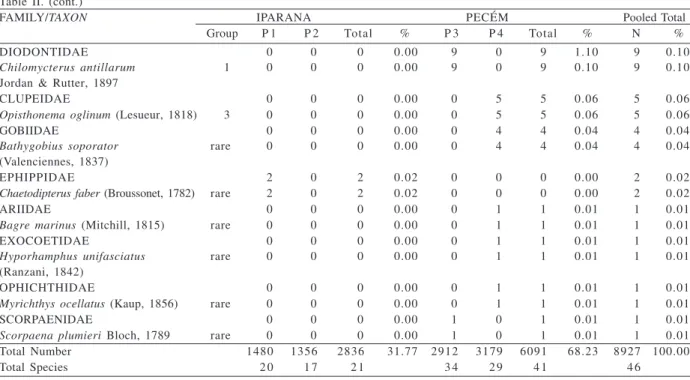
A total of 8,914 fishes, from 25 families, 32 genera and 43 species, were recorded through visual censuses.
Sparisoma spp. (S. axillare (Steindachner, 1878) or S. frondosum (Agassiz, 1831), following MOURAet al., 2001)
was the most abundant taxon, followed by Haemulon parra, Acanthurus chirurgus and Abudefduf saxatilis.
Together, they comprised 74.53% of the total fish recorded. In terms of number of individuals, Haemulidae was the most abundant family, comprising 34% of the total abundance followed by Scaridae (26%), Acanthuridae (16%) and Pomacentridae (10%). Haemulidae was also the most speciose family with 7 species, followed by Lutjanidae (5 species) (Tab. II).
Iparana pools 1 and 2 showed lowest fish abundance (1,480 and 1,356 respectively) as compared to Pecém pools 3 and 4 (2,912 and 3,179 fishes recorded respectively). On the average, fish densities were three times greater at Pecém than at Iparana. Pecém pools also attained the highest species richness with 34 and 29 species, respectively (Tab. II).
Q-mode cluster analysis identified two major sample groups showing significant locality (Pecém vs. Iparana)
related differences at similarities lower than 1.5. For exploratory purposes, these groups were subdivided into two groups each, as shown in the nodal diagram (Fig. 2). Groups A and B were formed by samples from Pecém Pools 3 and 4, respectively. Group C included nearly all Iparana samples, whereas group D was composed by
Table I. Descriptive physical characteristics of tidepools at Iparana and Pecém beaches, State of Ceará, Brazil, from June 1998 to June 2000.
Descriptive IPARANA PECÉM
Characters Pool 1 Pool 2 Pool 3 Pool 4
Distance from Shore (m) 160 150 7 5 100
Area (m2) 190 185 194 194
Volume (m3) 133 102 6 8 9 5
Maximum Depth (m) 1.4 1.1 0.7 1.0
Percent Coverage
Sand-rubble 7 6 1 5 5 6
Bare Rock 5 8 3 7 1 0 2 6
Rock covered with algae 3 5 5 7 7 5 1 8 Complexity
Pebbles low moderate moderate low
Caves high low low high
samples from June, August and September in Pool 3 and June in Pool 4, showing less evident temporal patterns (Fig. 2).
Species Groups (R-mode cluster analysis) were not statistically different from each other (Tab. III). However, distinct dominance could be detected among the surveyed pools (Fig. 2). For descriptive purposes we refer to the four species Groups discriminated in table II and figure 2, in spite of their apparent lack of ecological significance.
Groups 1 and 3 gathered species that were found almost exclusively in Pecém pools, with the exception of
Acanthurus coeruleus Bloch & Schneider, 1801 and Mugil curema Valenciennes, 1836 from group 3, and Haemulon plumierii (Lacepède, 1801) and Sphoeroides testudineus
(Linnaeus, 1758), from Group 1, which occurred only occasionally at Iparana. The occurrence of species from group 3 was sparse among both sampling sites.
Acanthurus coeruleus Bloch & Schneider, 1801, Halichoeres brasiliensis, Haemulon plumierii, Haemulon steindachneri (Jordan & Gilbert, 1882), Holocentrus adscencionis (Osbeck, 1765), Eucinostomus lefroyi (Goode, 1874), Anisotremus surinamensis, Sphoeroides testudinus and Serranus flaviventris (Cuvier,
1829), from Group 1, were recorded in both pools in Pecém (groups A and B).
Group 2, composed by Eucinostomus spp.,
Engraulidae, Lutjanus jocu (Bloch & Schneider, 1801) and Gymnothorax vicinus (Castelnau, 1855) was observed
mainly at Iparana Pools, with G. vicinus and Eucinostomus
spp. being sporadically found at Pecém. The presence of these species at Iparana was more pronounced in June, August and September (samples from Group D).
Species clustered at Group 4 could be divided in central (widely distributed) and periferic (with a more restricted distribution) components (sensu HANSKI, 1982).
Abudefduf saxatilis, Sparisoma spp., Lutjanus apodus
(Walbaum, 1792), Haemulon parra and Acanthurus chirurgus were frequently recorded on both localities,
constituting a sub-group of ubiquitous species.
Pomacanthus paru (Bloch, 1787) and Labrisomus nuchipinnis (Quoy & Gaimard, 1824) were also found in
all pools at lower abundances, whereas Anisotremus
species, Pareques acuminatus (Bloch & Schneider, 1801), Acanthurus coeruleus and Haemulon steindachneri
occurred almost exclusively at Pecém (Fig. 2).
Although intra-site differences regarding species occurrence were not significant, some discrepancies could
Fig. 2. Nodal diagram showing species and sample groups and relative mean abundance and frequency of occurrence of species per sample groups at Iparana and Pecém beaches, State of Ceará, Brazil, from June 1998 to June 2000.
0,00 0,20 0,40 0,60 0,80 1,00 ST EF U S L UT ANA O RT RUB SER F L A SPH T ES CHI ANT EU C L EF HAE P L U ANI S UR GY M V IC EU C s p . LU TJ OC E NG RAU CHAO CE MU G C U R HAE S T E CHL CHR HAL BRA OP IOGL HO L ADS ACACO E L
ABNUC PARAC
PO MPA R ANI M O R A N IV IR ACACHI SPA s p p . LU TA P O HAE P AR ABUS AX 0,00 0,20 0,40 0,60 0,80 1,00 ST EF U S L UT ANA O RT RUB SER F L A SPH T ES CHI ANT EU C L EF HAE P L U ANI S UR GY M V IC EU C s p . LU TJ OC E NG RAU CHAO CE MU G C U R HAE S T E CHL CHR HAL BRA OP IOGL HO L ADS ACACO E L
ABNUC PARAC
PO MPA R ANI M O R A N IV IR ACACHI SPA s p p . LU TA P O HAE P AR ABUS AX
Relative Mean Abundance/Group Frequency of Occurence/Group
2 3 4
Table II. List of family/taxon and their respective codes and numerical abundance per tidepool, location and pooled total numerical (N)
and percent (%) abundance. Bottom shows total abundance and total number of species at Iparana and Pecém beaches, State of Ceará, Brazil, from June 1998 to June 2000.
FAMILY/TAXON IPARANA PECÉM Pooled Total0
Group P 1 P 2 Total % P 3 P 4 Total % N %
HAEMULIDAE 334 349 683 7.65 1266 1091 2357 26.40 3040 34.06
Haemulon parra (Desmarest, 1823) 4 323 327 650 7.28 634 804 1438 16.11 2088 23.39 Haemulon plumierii (Lacepède, 1801) 1 1 1 1 1 2 0.13 333 3 2 365 4.09 377 4.22
Anisotremus virginicus (Linnaeus, 1758) 4 9 9 1 8 0.20 6 8 102 170 1.90 188 2.11
Anisotremus moricandi (Ranzani, 1842) 4 1 2 3 0.03 5 7 7 0 127 1.42 130 1.46
Haemulon steindachneri 3 0 0 0 0.00 3 6 7 0 106 1.19 106 1.19
(Jordan & Gilbert, 1882)
Anisotremus surinamensis (Bloch, 1791) 1 0 0 0 0.00 7 8 1 3 9 1 1.02 9 1 1.02
Orthopristis ruber (Cuvier, 1830) 1 0 0 0 0.00 6 0 0 6 0 0.67 6 0 0.67
SCARIDAE 531 498 1029 11.53 558 723 1281 14.35 2310 25.88
Sparisoma spp. 4 531 498 1029 11.53 558 723 1281 14.35 2310 25.88
ACANTHURIDAE 123 8 3 206 2.31 523 664 1187 13.30 1393 15.60
Acanthurus chirurgus (Bloch, 1787) 4 121 8 2 203 2.27 519 642 1161 13.01 1364 15.28
Acanthurus coeruleus 3 2 1 3 0.03 4 2 2 2 6 0.29 2 9 0.32
Bloch & Schneider, 1801
POMACENTRIDAE 127 118 245 2.74 225 431 656 7.35 901 10.09
Abudefduf saxatilis (Linnaeus, 1758) 4 126 118 244 2.73 216 431 647 7.25 891 9.98
Stegastes fuscus (Cuvier, 1830) 1 0 0 0 0.00 8 0 8 0.09 8 0.09
Stegastes variabilis (Castelnau, 1855) 1 0 1 0.01 1 0 1 0.01 2 0.02
LUTJANIDAE 109 129 238 2.67 107 127 234 2.62 472 5.28
Lutjanus apodus (Walbaum, 1792) 4 9 3 116 209 2.34 8 9 127 216 2.42 425 4.76
Lutjanus jocu (Bloch & Schneider, 1801) 2 1 6 1 3 2 9 0.32 0 0 0 0.00 2 9 0.32
Lutjanus analis (Cuvier, 1828) 1 0 0 0 0.00 1 5 0 1 5 0.17 1 5 0.17
Lutjanus griseus (Linnaeus, 1758) 0 0 0 0.00 2 0 2 0.02 2 0.02
Ocyurus chrysurus (Bloch, 1791) 0 0 0 0.00 1 0 1 0.01 1 0.01
GERREIDAE 206 155 361 4.04 109 3 3 142 1.59 503 5.63
Eucinostomus spp. 206 155 361 4.04 1 0 1 0.01 362 4.05
Eucinostomus lefroyi (Goode, 1874) 1 0 0 0 0.00 108 3 3 141 1.58 141 1.58
POMACANTHIDAE 1 2 4 1 6 0.18 3 1 2 4 5 5 0.62 7 1 0.79
Pomacanthus paru (Bloch, 1787) 4 1 2 4 1 6 0.18 3 1 2 4 5 5 0.62 7 1 0.79
LABRISOMIDAE 5 4 9 0.10 7 2 0 2 7 0.30 3 6 0.40
Labrisomus nuchipinnis 4 5 4 9 0.10 7 2 0 2 7 0.30 3 6 0.40
(Quoy & Gaimard, 1824)
ENGRAULIDAE 2 2 3 2 2 5 0.28 0 0 0 0.00 2 5 0.28
SCIANIDAE 0 0 0 0.00 9 1 6 2 5 0.28 2 5 0.28
Pareques accuminatus 4 0 0 0 0.00 9 1 6 2 5 0.28 2 5 0.28
(Bloch & Schneider, 1801)
MUGILIDAE 0 1 1 1 1 0.12 1 0 0 1 0 0.11 2 1 0.23
Mugil curema Valenciennes, 1836 3 0 1 1 1 1 0.12 1 0 0 1 0 0.11 2 1 0.23
SERRANIDAE 2 0 2 0.02 2 0 2 2 2 0.25 2 4 0.26
Serranus flaviventris (Cuvier, 1829) 1 0 0 0 0.00 1 9 1 2 0 0.22 2 0 0.22
Mycteroperca bonaci (Poey, 1860) 0 0 0 0.00 1 1 2 0.02 2 0.02
Epinephelus adscensionis (Osbeck, 1765) 2 0 2 0.02 0 0 0 0.00 2 0.02
TETRAODONTIDAE 1 1 2 0.02 1 4 2 1 6 0.18 1 8 0.20
Sphoeroides testudineus (Linnaeus, 1758) 1 1 1 2 0.02 1 2 2 1 4 0.16 1 6 0.18
Sphoeroides tyleri Shipp, 1972 0 0 0 0.00 2 0 2 0.02 2 0.02
CARANGIDAE 0 0 0 0.00 0 1 4 1 4 0.16 1 4 0.16
Chloroscombrus crysurus (Linnaeus, 1766) 3 0 0 0 0.00 0 1 4 1 4 0.16 1 4 0.16
CHAETODONTIDAE 0 0 0 0.00 1 3 1 1 4 0.16 1 4 0.16
Chaetodon ocellatus Bloch, 1787 2 0 0 0 0.00 9 0 9 0.10 9 0.10
Chaetodon striatus Linnaeus, 1758 0 0 0 0.00 4 1 5 0.06 5 0.06
HOLOCENTRIDAE 0 0 0 0.00 7 6 1 3 0.15 1 3 0.15
Holocentrus adscensionis (Osbeck, 1765) 3 0 0 0 0.00 7 6 1 3 0.15 1 3 0.15
LABRIDAE 0 0 0 0.00 2 1 0 1 2 0.13 1 2 0.13
Halichoeres brasiliensis (Bloch, 1791) 3 0 0 0 0.00 2 9 1 1 0.12 1 1 0.12
Halichoeres penrosei Starks, 1913 0 0 0 0.00 0 1 1 0.01 1 0.01
MURAENIDAE 5 2 7 0.08 1 3 4 0.04 1 1 0.12
Gymnothorax vicinus (Castelnau, 1855) 2 4 2 6 0.07 1 3 4 0.04 1 0 0.11
be observed between Pecém Pools (3 and 4), or sample Groups B and A, respectively. The pattern of species composition in both pools was characterized by the occurrence of ubiquitous and accessory species from Group 4, and by exclusive species, recorded only at this site (Group 1). Differences between both pools were restrained to the lower number of species and mean abundances of Group 1 recorded on Pool 4 (Eucinostomus lefroyi, Anisotremus surinamensis (Bloch, 1791), Haemulon plumierii, Sphoeroides testudineus and Serranus flaviventris), as well as by higher abundances of
the accessory species from Group 4, when compared to Pool 3. Nevertheless, despite the low abundances and erratic occurrences, some species from Group 3 were exclusive from Pools 3 (Mugil curema and Chaetodon ocellatus Bloch,
1787) and 4 (Chloroschombrus chrysurus Linnaeus, 1766
and Opistonema oglinum (Lesueur, 1818)).
Most indicator species were related to Pecém groups A (e.g., Abudefduf saxatilis; Anisotremus virginicus
(Linnaeus, 1758); Anisotremus moricandi; Labrisomus nuchipinnis;Acanthurus coeruleus) and B (e.g., Haemulon plumierii; Eucinostomus lefroyi; Anisotremus surinamensis; Chilomycterus antillarum Jordan and Rutter,
1897; Serranus flaviventris). Indicator species at Iparana
groups were Lutjanus jocu, Eucinostomus spp. and the
unindentified Engraulidae (Tab. IV).
The distribution of rare species, which were not included in the previous analyses, followed a pattern similar to the observed in the nodal diagram (Fig. 2). Most of the rare species (Bagre marinus (Mitchill, 1815); Bathygobius soporator (Valenciennes, 1837); Chaetodon striatus Linnaeus, 1758; Halichoeres penrosei; Hyporhampus unifasciatus (Ranzani, 1842); Lutjanus griseus (Linnaeus, 1758); Micteroperca bonaci (Poey, 1860); Mirichthys ocellatus Bloch, 1787; Ocyurus crysurus
(Linnaeus, 1766); Scorpaena plumieri Bloch, 1789; Sphoeroides tyleri Shipp, 1972) were found exclusively at
Pecém pools, whereas only three (Chaetodipterus faber
(Broussonet, 1782); Epinephelus adscensionis (Osbeck,
1765) and Gymothorax funebris Ranzani, 1840) were
exclusive to Iparana. Stegastes variabilis (Castelnau, 1855)
was observed at both localities (Tab. II).
Principal Component Analysis explained approximately 57% of the total variance among samples and species on the first two axes. The analysis revealed gradients similar to the ones found on previous analyses in this study. The first canonical axis explained 47.0% of the total variance and evidenced locality differences, with positive scores for sample groups C and D (Iparana) and negative scores for groups A and B (Pecém).
The distribution of species groups in the canonical space evidenced the main patterns of fish assemblage segregation among sampling localities. Species Group 2 showed positive loadings on the first axis, and was mostly representative of Iparana pools, with highest positive loadings attained by Eucinostomus spp., Engraulidae, L. apodus, G. vicinus and L. jocu. Group 3 also attained positive
loadings, with two exceptions (Haemulon steindachneri
and Acanthurus coeruleus), in spite of their slightly higher
abundance in Pecém pools (Fig. 3). Groups 1 and 4 did not segregate in the first canonical axis, despite of the small negative trend observed in the loadings of Group 1.
The second canonical axis explained 10.5% of the variance and reflected mainly within locality differences with Pecém pools 3 and 4 (sample groups B and A)
Table II. (cont.)
FAMILY/TAXON IPARANA PECÉM Pooled Total0
Group P 1 P 2 Total % P 3 P 4 Total % N %
DIODONTIDAE 0 0 0 0.00 9 0 9 1.10 9 0.10
Chilomycterus antillarum 1 0 0 0 0.00 9 0 9 0.10 9 0.10
Jordan & Rutter, 1897
CLUPEIDAE 0 0 0 0.00 0 5 5 0.06 5 0.06
Opisthonema oglinum (Lesueur, 1818) 3 0 0 0 0.00 0 5 5 0.06 5 0.06
GOBIIDAE 0 0 0 0.00 0 4 4 0.04 4 0.04
Bathygobius soporator rare 0 0 0 0.00 0 4 4 0.04 4 0.04
(Valenciennes, 1837)
EPHIPPIDAE 2 0 2 0.02 0 0 0 0.00 2 0.02
Chaetodipterus faber (Broussonet, 1782) rare 2 0 2 0.02 0 0 0 0.00 2 0.02
ARIIDAE 0 0 0 0.00 0 1 1 0.01 1 0.01
Bagre marinus (Mitchill, 1815) rare 0 0 0 0.00 0 1 1 0.01 1 0.01
EXOCOETIDAE 0 0 0 0.00 0 1 1 0.01 1 0.01
Hyporhamphus unifasciatus rare 0 0 0 0.00 0 1 1 0.01 1 0.01
(Ranzani, 1842)
OPHICHTHIDAE 0 0 0 0.00 0 1 1 0.01 1 0.01
Myrichthys ocellatus (Kaup, 1856) rare 0 0 0 0.00 0 1 1 0.01 1 0.01
SCORPAENIDAE 0 0 0 0.00 1 0 1 0.01 1 0.01
Scorpaena plumieri Bloch, 1789 rare 0 0 0 0.00 1 0 1 0.01 1 0.01
Total Number 1480 1356 2836 31.77 2912 3179 6091 68.23 8927 100.00
Total Species 2 0 1 7 2 1 3 4 2 9 4 1 4 6
Table III. Results of Monte Carlo multiple comparisons between sample groups A-D (top) and species groups 1-4 (bottom) at Iparana and Pecém beaches, State of Ceará, Brazil, from June 1998 to June 2000 (**, highly significant; *, significant; ns, non significant; NC, non-comparable).
A B C D
1 NC 0.000 ** 0.000 ** A
2 0.697 ns 0.000 ** 0.000 ** B
3 0.046 * 0.027 ** 0.107 ns C
4 0.041 * 0.333 ns 0.163 ns D
showing positive and negative scores, respectively (Fig. 3). Differences between pools at Iparana were less evident, and resulted from abundance peaks of species with time restricted occurrences (e.g. Eucinostomus spp.). Such peaks
accounted for the higher scores of sample group D, generating an apparent segregation, due to short scale temporal changes, probably related to life history aspects of these estuarine forms. Species that were exclusive from, or presented higher abundances, on Pool 3 (A. surinamensis, Ortopristes rubber (Cuvier, 1830), S. flaviventris, Chilomycterus antillarum) attained positive loadings on
the second axis, while negative values were observed for the accessory members of Group 4. Almost all species from group 2 presented positive loadings on the second axis as well, with the exception of Gymnothorax vicinus, which
occurred on all surveyed pools.
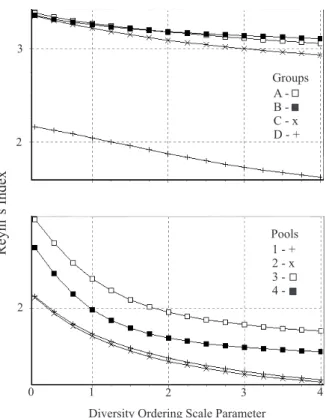
In terms of species diversity, bootstrap analysis indicated that both Simpson and Shannon Wiener indices were significantly smaller for group D, when compared to all other sample groups (Tab. Va). All diversity indices for Groups A, B and C were not significantly different (Fig. 4a), with an exception for Groups A and B, which were not inter-comparable. Iparana tidepools 1 and 2 showed very similar Renyi´s ordination patterns, whereas Pecém pools 3 and 4 were displayed apart (Fig. 4b). Bootstrap analysis showed that both Simpson and Shannon Wiener diversity were not significantly different between pools 1 and 2, but both differed from pool 3, and they all differed from pool 4 (Tab. Vb). Pools 1 and 2 showed the lowest species diversity, whereas pool 3 the highest, and pool 4 intermediate diversity values.
Fig. 3. Result of PCA analysis showing the distribution of tidepool samples (symbols) and species (anagrams and arrows) within the first two canonical axes at Iparana and Pecém beaches, State of Ceará, Brazil, from June 1998 to June 2000.
Fig. 4. Renyi’s diversity ordination comparing different cluster groups (top) and tidepools (bottom) at Iparana and Pecém beaches, State of Ceará, Brazil, from June 1998 to June 2000.
Groups A - + B - x C D -2
3
Pools 1 - + 2 - x 3 4
-Diversity Ordering Scale Parameter
0 1 2 3 4
2
Groups A B -C - x D - +
Reyni´s
Index
-1.0
1.0
-1.0
1.0
4.ABUSAX
4.ACACHI 3.ACACOE
4.ANIMOR
1.ANISUR 4.ANIVIR
1.CHIANT 3.CHLCHR
2.CHAOCE 2.ENGRAU
4.PARAC
2.EUCsp.
2.GYMVIC
3.HALBRA
4.HAEPAR
1.HAEPLU 3.HAESTE
3.HOLADS 4.LABNUC
1.LUTANA 4.LUTAPO
2.LUTJOC
3.MUGCUR 3.OPIOGL
1.ORTRUB 4.POMPAR
1.SERFLA 4.SPAspp.
1.SPHTES 1.STEFUS
1.EUCLEF
P101 P103
P104
P106
P107 P108
P109 P110 P111
P112
P201 P203
P204
P206
P209
P210
P212
P301
P302 P303
P304
P305 P306
P308
P309
P310
P311
P312 P401
P402 P403 P404
P405 P406
P408 P409
P410
P411 P412
SAMPLE
GROUP A
GROUP B
GROUP C
GROUP D
Axis I - 30.7%
Axis
II
DISCUSSION
Our work showed that the taxonomic composition of fish species at Pecém and Iparana was consistent with several studies on tidepool fish fauna in the brazilian coast (FERREIRAet al., 1995; ROSA & MOURA, 1997; ROCHAet al.,
1998; FERREIRA & CAVA, 2001), but differed considerably from ROSAet al. (1997) and BARREIROSet al. (2004).
Compared to studies conducted elsewhere in the world, the species composition also differed significantly. The appropriate literature indicates that intertidal fish communities tend to be dominated by one or a few species from the families Clinidae (BECKLEY, 1985; BENNETT, 1987; PROCHAZKA, 1996), Tripterygiidae and Gobiesocidae (WILLIS & ROBERTS, 1996), Cottidae (YOSHIYAMA, 1981; GROSSMAN, 1982; MORING, 1986, 1990), and Blenniidae and Gobiidae (GIBSON, 1968; STEPIEN, 1990; VARAS & OJEDA, 1990).
Differences may be attributed not only to species geographical distribution and faunal affinities, but also to processes related to pool size (area and/or volume), height of the pool on the shore, wave action (GIBSON, 1982; GROSSMAN, 1982; PROCHAZKA & GRIFFITHS, 1992;
Table IV. Indicator species values (INDVAL) for each taxonomic group within sample groups, and averages (Avg) among groups with respective probaility values (P; **, highly significant; *, significant; ns, non significant) Highlited cells show highest INDVAL values for each taxonomic group at Iparana and Pecém beaches, State of Ceará, Brazil, from June 1998 to June 2000.
SPECIES SAMPLE GROUP
ANAGRAM A B C D p
Eucinostomus spp. EUCSPP 0 0 6 0 4 0 0.000 * *
Anisotremus moricandi (Ranzani, 1842) ANIMOR 5 4 4 4 0 0 0.003 * * Abudefduf saxatilis (Linnaeus, 1758) ABUSAX 5 2 2 6 3 1 7 0.000 * *
Haemulon parra (Lacepède, 1801) HAEPAR 4 3 3 4 1 2 1 0.000 * *
Lutjanus apodus (Walbaum, 1792) LUTAPO 2 9 2 0 2 7 2 3 0.806 ns
Haemulon plumierii (Lacepède, 1801) HAEPLU 8 8 9 0 0 0.000 * *
Anisotremus virginicus (Linnaeus, 1758) ANIVIR 5 6 3 8 0 3 0.000 * *
Acanthurus chirurgus (Bloch, 1787) ACACHI 5 0 4 0 0 7 0.003 * *
Sparisoma spp. SPASPP 3 4 2 7 9 2 7 0.018 *
Eucinostomus lefroyi (Goode, 1874) ULAFRO 1 7 7 7 0 0 0.000 * *
Anisotremus surinamensis (Bloch, 1791) ANISUR 5 7 8 0 0 0.000 * *
Pomacanthus paru (Bloch, 1787) POMPAR 2 8 4 1 4 5 0.044 *
Serranus flaviventris (Cuvier, 1829) SERFLA 0 6 9 0 0 0.000 * *
Pareques acuminatus (Bloch & Schneider, 1801) EQUACC 5 3 1 6 0 0 0.006 * *
Labrisomus nuchipinnis (Quoy & Gaimard, 1824) LABNUC 4 7 1 2 2 5 0.018 *
Chilomycterus antillarum Jordan & Rutter, 1897 CHIANT 0 6 4 0 0 0.000 * *
Acanthurus coeruleus Bloch & Schneider, 1801 ACACOE 5 8 4 0 1 0.003 * *
Lutjanus analis (Cuvier, 1828) LUTANA 0 5 5 0 0 0.002 * *
Stegastes fuscus (Cuvier, 1830) STEFUS 0 5 5 0 0 0.006 * *
Spheroides testudineus (Linnaeus, 1758) SPHTES 2 5 0 0 1 0.003 * *
Halichoeres brasiliensis (Bloch, 1791) HALBRA 4 6 3 0 0 0.005 * * Lutjanus jocu (Bloch & Schneider, 1801) LUTJOC 0 0 4 4 3 0.010 * * Haemulon steindachneri (Jordan & Gilbert, 1882) HAESTE 2 4 1 5 0 0 0.224 ns
Orthopristis ruber (Cuvier, 1830) ORTRUB 0 3 6 0 0 0.023 *
Engraulidae ENGRAU 0 0 2 9 7 0.053 ns
Holocentrus adscensionis (Osbeck, 1765) HOLASC 1 7 1 4 0 0 0.241 ns
Gymnothorax vicinus (Castelnau, 1855) GYMVIC 7 1 7 7 0.940 ns
Mugil curema Valenciennes, 1836 MUGCUR 0 1 6 0 4 0.212 ns
Chloroscombrus crysurus (Linneus, 1766) CHLCHR 9 0 0 0 0.628 ns
Chaetodon ocellatus Bloch, 1787 CHAOCE 0 9 0 0 0.574 ns
Opistonema oglinum (Lesueur, 1818) OPIOGL 9 0 0 0 0.599 ns
Table V. Bootstrap analysis comparing Shannon-Wiener and Simpson diversity among sample groups (a) and among tidepools (b). Top values are average Shannon-Wiener and Simpson D diversity at Iparana and Pecém beaches, State of Ceará, Brazil, from June 1998 to June 2000 (** - highly significant; * - significant; ns - non significant).
V (a) Among Groups A B C D
Shannon 3.27 3.256 3.217 2.045
Simpson D 27.562 28.091 25.769 11.375
A 0.438 ns 0.280 ns 0.037 *
B 0.407 ns 0.318 ns 0.029 *
C 0.774 ns 0.823 ns 0.048 *
D 0.967 * 0.984 * 0.963 *
Iparana Pecém V (b) Among Pools Pool 1 Pool 2 Pool 3 Pool 4
Shannon 1.744 1.7167 2.2917 1.9848
Simpson D 4.618 4.481 7.278 5.577
Pool 1 0.417 ns 1.000 ** 0.955 *
Pool 2 0.591 ns 1.000 ** 0.966 *
Pool 3 0.000 ** 0.000 ** 0.001 **
MAHON & MAHON, 1994; UNDERWOOD & CHAPMAN, 1996; SILBERSCHNEIDER & BOOTH, 2001), and sampling methodology (GIBSON, 1999). The works of ROSAet al.
(1997) and BARREIROSet al. (2004), were conducted with
anaesthetics or ichthyocides on small sized rock pools (1.44-20.5 m2, 13-49 cm deep), often in the high intertidal.
Such methods may be more reliable on small areas since they kill all the fish and provide information on cryptic species such as representatives of Bleniidae, Gobiidae, Labrisomidae and Pomacentridae. However, larger fish may not stay in small high intertidal pools due to dramatic variation in environmental conditions during the day (GRIFFITHSet al., 2003).
The prevalence of coastal reef associated families such as Haemulidae, Sparidae and Acanthuridae indicated that a substantial amount of the fish species pool from Ceará’s tropical coast was incorporated into the tidepool fish assemblages (LIMA, 1969; LIMA & OLIVEIRA, 1978; ARAÚJOet al., 2000), as many opportunist or secondary
resident species (GRIFFITHS, 2003a) moved into the pools at high tide and became trapped at low tide (GIBSON & YOSHIYAMA, 1999). For instance, HORNet al. (1999) pointed
out that nearly all coastal fish species may, in one time or another during their life cycle, use intertidal habitats for different purposes, including the search for food and shelter from predators.
Monte Carlo permutation model, cluster and nodal analysis showed significant differences between sites (Iparana x Pecém), and suggested some degree of intra-site heterogeneity, especially at Pecém pools (although the differences were non-significant). This may reflect both larger environmental discontinuities and more localized features, such as pool isolation episodes (GIBSON & YOSHIYAMA, 1999), or environmental complexity (BENNET & GRIFFITHS, 1984; PROCHAZKA & GRIFFITHS, 1992) provided by substrate type and algae cover, both acting isolated or interactively. For instance, the relative importance of estuarine related species (Eucinostomus spp. and
Engraulidae) for community composition was stronger for Iparana pools, which are located near the mouth of the Ceará River estuary, whereas tropical reef species, such as Stegastes fuscus (Cuvier, 1830), Serranus flaviventris, Chaetodon ocellatus, C. striatus, Myrichthys ocellatus,
were found exclusively at Pecém. The environmental gradient provided by freshwater discharge, and subsequent changes in seawater chemistry and turbidity, could not only directly influence the environmental conditions at the pool areas, but also have a localized effect over the species source-pool, from which the tidepool community would draw its components (FUJI, 1988; METAXAS & SCHEIBLING, 1993; DAVIS, 2000).
These results were further supported by PCA with the segregation of Iparana and Pecém along the first component, and Pecém pools 3 and 4 on the second. Iparana related groups 1 and 2 (not significantly different) had no Indicator species but the estuarine Eucinostomus
spp. This further supported the hypothesis of a greater contribution from the Ceará river estuary to the fish composition of tidepool assemblages at the neighboring Iparana reef. However, Eucinostomuslefroyi was also an
important component at Pecém and Bagre marinus,
another estuarine related species,was found exclusively
at that site. Mugil curema also occurred sporadically at
both sites. Therefore, estuarine forms would thus be an important component of tidepools at both surveyed areas, but taxon might vary according to species turnover
and local sporadic availability of some species.
On the other hand, the non-significant intra-site differences suggest that the fish access to the pools may be, to some extent, also relayed on a stochastic process (GIBSON & YOSHIYAMA, 1999). Factors such as algae or benthic cover and reef complexity may be more important for cryptic and site-attached species (BENNET & GRIFFITHS, 1984; PROCHAZKA & GRIFFITHS, 1992; SILBERSCHNEIDER & BOOTH, 2001; GRIFFITHS, 2003b), a portion of the fish community that was not properly assessed by the methodology employed here (ENGLISHet al., 1994; GIBSON, 1999). Furthermore, the high proportion of transient species recorded reinforces the idea that there are few, if none, habitat choices during the fish arrival into the pools at high tides. Site-attached fish may stay longer if the habitat conditions, or environmental complexity, are suitable for colonization, and could provide the non-detected intra-site differences. The overall environmental complexity, evaluated based on substrate complexity and algae cover, differed among the surveyed pools. However, despite the significant inter-site differences in species diversity, pools at both localities presented high substrate complexity (Iparana pool 1) and algae coverage (Pecém pool 3 and Iparana pool 2). This reinforces the idea that a proper assessment of the whole fish community should be made with more than one sampling method, in order to determine the true importance of cryptic forms to local diversity and community structure.
The flooding of tidepools during high tides, which provides the access to fish to this ecosystem, is dependent upon factors such as tidal amplitude, local reef topography and distance from shore line (METAXAS & SCHEIBLING, 1993; MAHON & MAHON, 1994; DAVIS, 2000). Our results showed that higher diversity and abundance was attained at Pecém, where pools were shallower and closer to shore. These results contrasted with the findings of GIBSON (1982), PROCHAZKA & GRIFFITHS (1992) and MAHON & MAHON (1994) who suggested that larger pools in the low intertidal might be richer and have a higher proportion of transient species than small high intertidal pools (GIBSON & YOSHIYAMA, 1999). UNDERWOOD & CHAPMAN (1996) observed that pool location in relation to tidal movement rather than pool size may be more important for determining community structure and biodiversity. GRIFFITHSet al. (2003) observed that the vertical
elevation of rockpools in the intertidal zone influenced the fish assemblage structure of individual rockpools.
Seasonal trends were not detected in our results. This was expected since seasonal environmental changes in tropical areas are more subtle than in temperate waters. BARREIROSet al. (2004) found consistent seasonal trends
studies should address this aspect and further relate patterns with local environmental seasonality.
Abundance estimates through visual census may be biased due to lower counts of cryptic species (ENGLISH
et al., 1994; GIBSON, 1999). Nevertheless, the use of anaesthetics or ichthyocides may not be appropriate in larger pools due the high volume and cost of solution required to treat the pool, and the possible impacts on adjacent areas due to dispersion of the compounds. In such cases, visual census with snorkeling may be a more appropriate method. MORING (1993) and GIBSON & YOSHIYAMA (1999) observed that visual census surveys provided a reliable account of the fish community on tidepools, comprised mostly of young partial residents using these habitats as nurseries. Furthermore, the use of visual census may be very appropriate on easily accessible and highly impacted areas. These are non destructive, low cost, easy to conduct methods that may be replicated several times, at different locations for comparisons, providing an advantage for monitoring areas in which tourism and fisheries have already reduced fish populations (CHRISTENSEN & WINTERBOTTOM, 1981; ENGLISHet al., 1994; FERREIRAet al., 1995; WILLIS, 2001). Although we could not relate these disparities to any of the previously mentioned factors, we believe that human impact could also be an important component determining the variability of fish assemblages in these localities. Intertidal fishes occupy a variety of microhabitats within the reef structure including tidepool waters, patches of seaweed and rock crevices (HORNet al., 1999). As much as reefs are susceptible to human
access, intertidal fishes are quite vulnerable to overexploitation and habitat degradation due to pollution and people trampling over the reefs (BRYANTet al., 1998;
HORNet al., 1999). On weekdays, artisanal fishers and
fish collectors visit the reefs harvesting species from tidepools. We estimated an average of 25 people on the reefs on our monthly visits, either fishing or collecting bait, ornamental fishes or live rock. On weekends, at low tide, tourists and bathers use tidepools for swimming and snorkeling, doubling the number of people on the reef (personal observations). On the other hand, human influence was lower at the locality of Pecém, at the time of our study. We found average daily frequencies of five people visiting the reefs during our study and, other than fishers and occasional swimmers, no other form of exploitation was recorded. The lowest diversity at Iparana tidepools may be a response to the continuous exploitation of intertidal fishes and the reef fauna there. In fact, SYMS & JONES (2000) found that persistent habitat disturbance may cause irreversible changes in fish communities, leading to the extinction of marine populations, including fishes (DULVYet al., 2003). Also,
GOMES et al. (1995) stated that any changes in the
community structure might first be detected through the patterns of abundance of the rare and “satellite” species (sensu HANSKI, 1982). In this survey, both sites shared the same ubiquitous (Group 1), or better adapted species, which comprised the core of Iparana tidepools fish community. The lack of many species found at Pecém pools might be a reflection of a medium to long term impoverishment process, related not only to direct human
impacts over the reef area, but also to indirect effects on the Ceará River, and the consequent loss of water quality at nearby coastal areas.
Another example of human impact on tidepool fish communities was the construction of an offshore port facility at Pecém, which started in 1996. The abrupt changes in the coastline altered the local dynamics of sediment transport, which resulted in beach accretion and sand deposition over the reefs, totally filling the tidepools in 2002. Reefs were not exposed since then (personal observation). Our results also showed that it also contributed to a subtle loss of a quasi pristine
environment, as well as a moderately diverse fish community. Some consequences of these changes are predictable up to a point. As fewer habitats are available to tidepool fishes, we suggest that fish biodiversity may be reduced within certain limits. However, we may not predict, at this stage, what will be the consequences for the recruitment of certain species, or the maintenance of local populations of fishes. Since tidepool ichthyofauna may vary between and within reef sites, conclusions taken from one area may not be generalized to other adjacent sites, and damages caused to one area may not necessarily be mitigated by the maintenance and protection of another area.
Acknowledgements. We thank Mara C. Notthingham
and other components of the IMAT research group for their help and assistance. Research was partly funded by the Fundação Cearense de Apoio à Pesquisa (FUNCAP), and C. Monteiro-Neto held a Research fellowship from Conselho Nacional de Desenvolvimento Científico e Tecnológico - CNPq. Ricardo Rosa reviewed the manuscript providing helpful insights.
REFERENCES
ACERO, A. P. & GARZÓN, J. F. 1982. Rediscovery of Anisotremus moricandi (Peciformes: Haemulidae), including a redescription of the species and comments on its ecology and distribution.
Copeia 3:613-618.
ACKERMAN, J. L. & BELLWOOD, D. R. 2000. Reef fish assemblages: a
re-evaluation using enclosed rotenone stations. Marine Ecology Progress Series 206:227-237.
ARAÚJO, M. E.; CUNHA, F. E. A.; CARVALHO, R. A. L.; FREITAS, J. E.
P.; NOTTINGHAM, M. C. & BARROS, B. M. N. 2000. Ictiofauna
Marinha do estado do Ceará, Brasil: II. Elasmobranchii e Actinopterygii de arrecifes de arenito da região entremarés.
Arquivos de Ciências do Mar 33:133-138.
BARREIROS, J. P.; BERTONCINI, A.; MACHADO, L.; HOSTIN-SILVA, M. &
SANTOS, R. S. 2004. Diversity and seasonal changes in the
ichthyofauna of rocky tidal pools from Praia Vermelha and São Roque, Santa Catarina. Brazilian Archives of Biology and Technology 47(2):291-299.
BECKLEY, L. E. 1985. The fish community of East Cape tidal
pools and an assessment of the nursey function of this habitat.
South African Journal of Zoology 20:21-27.
BENNETT, B. A. 1987. The rock-pool fish community of Koople
Alleen and an assessment of the importance of Cape rock-pools as nurseries for juvenile fish. South African Journal of Zoology 22:25-32.
BENNETT, B. A. & GRIFFITHS, C. L. 1984. Factors affecting the
distribution, abundance and diversity of rock-pool fishes on the Cape Peninsula, South Africa. South African Journal of Zoology 19(2):97-104.
BOESCH, D. F. 1977. Application of numerical classification in ecological investigations of water pollution. Oregon, Corvallis Environmental Research Laboratory. 114p. BRYANT, D.; BURKE, L.; MCMANUS, J. & SPALDING, M. 1998. Reefs
Coral Reefs. Washington, World Resources Institute. 56p. BURGESS, W. E.; AXELROD, H. R. & HUNZIKER, R. E. 1990. Atlas of Marine Aquarium Fishes. 2ed. Neptune city-NJ/USA, TFH Publications Inc. 768p.
CADDY, J. F. & SHARP, G. D. 1986. An ecological framework for marine fishery investigations. FAO Fisheries Technical Paper 283. Rome, Food and Agriculture Organization of the United Nations. 152p.
CAMPOS, A. A.; MONTEIRO, A. Q. & MONTEIRO-NETO, C. 2003. A Zona Costeira do Ceará: Diagnóstico para a Gestão Integrada. Fortaleza, AQUASIS. 293p.
CERVIGÓN, F. 1991. Los peces marinos de Venezuela. 2ª ed. Caracas, Fundación Cientifica Los Roques. v.1. 425p. ___. 1993. Los peces marinos de Venezuela. 2ed. Caracas,
Fundación Cientifica Los Roques. v.2, 497p.
___. 1994. Los peces marinos de Venezuela. 2ed. Caracas, Ed. Ex-Libris. v.3. 295p.
___. 1996. Los peces marinos de Venezuela. 2ed. Caracas, Ed. Ex-Libris. v.4. 255p.
CHRISTENSEN, M. S. & WINTERBOTTOM, R. A. 1981. Correction factor
for, and its application, visual censuses of littoral fish. South African Journal of Zoology 16:73-79.
DAVIS, J. L. D. 2000. Spatial and seasonal patterns of habitat
partitioning in a guild of southern California tidepool fishes.
Marine Ecology Progress Series 196:253-268.
DUFRENE, M. & LEGENDRE, P. 1997. Species assemblages and indicator
species: the need for a flexible asymmetrical approach.
Ecological Monographs 67(3):345-366.
DULVY, N. K.; SADOVY, Y. & REYNOLDS, J. D. 2003. Extinction
vulnerability in marine populations. Fishes and Fisheries 4:25-64.
ENGLISH, S.; WILKINSON, C. & BAKER, V. 1994. Survey manual for tropical marine resources. ASEAN-Australia Marine Science project: living coastal resources. Townsville, Australian Institute of Marine Science. 368p.
FEITOSA, C. V.; SAMPAIO, D. A. P. & ARAÚJO, M. E. 2002. Ictiofauna
recifal dos Parrachos de Maracajaú (RN) na área dos flutuantes: Inventário e estrutura da comunidade. Arquivos de Ciências do Mar 35:39-50.
FERREIRA, B. P.; MAIDA, M. & SOUZA, A. E. T. 1995. Levantamento
inicial das comunidades de peixes recifais da região de Tamandaré – PE. Boletim Técnico Científico CEPENE 3(1):211-230.
FERREIRA, B. P. & CAVA, F. 2001. Ictiofauna marinha da APA
Costa dos Corais: Lista de espécies através de levantamento da pesca e observações subaquáticas. Boletim Técnico Científico CEPENE 9(1):167-180.
FIGUEIREDO, J. L. & MENEZES, N. A. 1978. Manual de peixes marinhos do sudeste do Brasil. II. Telesostei (1). São Paulo, Museu de Zoologia USP. 110p.
___. 1980. Manual de peixes marinhos do sudeste do Brasil. III. Teleostei (2). São Paulo, Museu de Zoologia USP. 90p.
___. 2000. Manual de peixes marinhos do sudeste do Brasil.VI. Teleostei (5). São Paulo, Museu de Zoologia USP. 116p.
FUJI, A. 1988. Measuring wave force on a rocky intertidal shore. Bulletin Faculty Fish Hokkaido University 39(4):257-264. GIBSON, R. N. 1968. The agonistic behaviour of juvenile Blennius
pholis L. (Teleostei). Behaviour 30:192-217.
___. 1982. Recent studies on the Biology of Intertidal Fishes.
Oceanography and Marine Biology: An Annual Review 20:363-414.
___. 1999. Methods for Studying Intertidal Fishes. In: HORN, M.
H.; MARTIN, K. L. M. & CHOTKOWSKI, M. A. eds. Intertidal Fishes: Life in two worlds. Academic. p.7-25.
GIBSON, R. N. & YOSHIYAMA, R. M. 1999. Intertidal fish communities. In: HORN, M. H.; MARTIN, K. L. M. & CHOTKOWSKI, M. A. eds. Intertidal Fishes: Life in two worlds. Academic. p.264-296.
GOMES, M. C.; HAEDRICH, R. L. & VILLAGAREIA, M. G. 1995. Spatial
and temporal changes in the groundfish assemblages on the north-east Newfoundland/Labrador Shelf, north-west Atlantic, 1978-1991. Fish Oceanography 4:85-101.
GRIFFITHS, S. P. 2003a. Rockpool ichthyofaunas of temperate
Australia: Species composition, residence, residency and
biogeographic patterns. Estuarine, Coastal and Shelf Science 58:173-186.
___. 2003b. Spatial and temporal dynamics of temperate Australian rockpool ichthyofaunas. Marine and Freshwater Research 54:163-176.
GRIFFITHS, S. P.; WEST, R. J. & DAVIS, A. R. 2003. Effects of
intertidal elevation on the rockpool ichthyofaunas of temperate Australia. Environmental Biology of Fishes 68:197-204.
GROSSMAN, G. D. 1982. Dynamics and organization of a rocky
intertidal fish assemblage: the persitance and resilience of taxocene structure. The American Naturalist 119 :611-637.
HANSKI, I. 1982. Dynamics of regional distribution: the core and
satellite hypothesis. Oikos 38(2):210-221.
HORN, M. H.; MARTIN, K. L. M. & CHOTKOWSKI, M. A. 1999.
Introduction. In: HORN, M. H.; MARTIN, K. L. M. & CHOTKOWSKI,
M. A. eds. Intertidal Fishes: Life in two worlds. Academic. p.1-6.
HUMANN, P. 1995. Reef Fish Identification Florida Caribbean, Bahamas. New World Publications. 396p.
LEGENDRE, P. & GALLAGHER, E. 2001. Ecologically Meaningful
Transformations for Ordination Biplots of Species Data.
Oecologia 129:271-280.
LEGENDRE, P. & LEGENDRE, L. 1998. Numerical ecology. 2ed. Amsterdam, Elsevier Science. 853p.
LIMA, H. H. 1969. Primeira contribuição ao conhecimento dos
nomes vulgares de peixes marinhos do Nordeste brasileiro.
Boletim de Ciências do Mar 21:1-20.
LIMA, H. H. & OLIVEIRA, A. M. E. 1978. Segunda contribuição ao
conhecimento dos nomes vulgares de peixes marinhos do Nordeste brasileiro. Boletim de Ciências do Mar 29:1-26. MAHON, R. & MAHON, S. D. 1994. Structure and resilience of a
tidepool fish assemblages at Barbados. Environmental Biology of Fishes 41:171-190.
MCCUNE, B. & MEFFORD, M. J. 1997. Multivariate analyses of ecological data. Version 3.0. Oregon, MJM Software. MENEZES, N. A. & FIGUEIREDO, J. L. 1980. Manual de peixes
marinhos do sudeste do Brasil. IV. Teleosei (3). São Paulo, Museu de Zoologia USP. 90p.
___. 1985. Manual de peixes marinhos do sudeste do Brasil. V. Teleostei (4). São Paulo, Museu de Zoologia USP. 90p. METAXAS, A. & SCHEIBLING R. E. 1993. Community structure and
organization of tidepools. Marine Ecology Progress Series 98:187-198.
MILLIGAN, G. W. & COOPER, M. 1987. Methodology review:
clustering methods. Applied Psychological Measurement 11(4):329-354.
MONTEIRO-NETO, C.; CUNHA, F. E. A.; NOTTINGHAM, M. C.; ARAÚJO, M.
E.; ROSA, I. L. & BARROS, G. L. 2003. Analysis of the marine
ornamental fish trade at Ceará State, Northeast Brazil.
Biodiversity and Conservation 12:1287-1295.
MORAIS, J. O. 1968. Contribuição ao estudo dos “Beach-Rocks” do
Nordeste do Brasil. Trabalhos Oceanográficos 9(11):79-94. MORING, J. R. 1986. Seasonal presence of tidepool fish species in
a rocky intertidal zone of northern California, USA.
Hydrobiologia 134:21-27.
___. 1990. Seasonal absence of fishes in tidepools of a boreal environment (Maine, USA). Hidrobiologia 194:163-168. ___. 1993. Check list of the tidepool Fishes of Maine. Maine
Naturalist 1(3):155-160.
MOURA, R. L.; FIGUEIREDO, J. L. & SAZIMA, I. 2001. A new parrotfish
(Scaridae) from Brazil, and revalidation of Sparisoma amplum
(Ranzani, 1842), Sparisoma frondosum (Agassiz, 1831),
Sparisoma axillare (Steindachner, 1878) and Scarus trispinosus Valencienes, 1840. Bulletin of Marine Science 68:505-524.
PROCHAZKA, K. 1996. Seasonal patterns in a temperate intertidal
fish community on the west coast of South Africa.
Environmental Biology of Fishes 45:133-140.
PROCHAZKA, K. & GRIFFITHS, C. L. 1992. The intertidal fish fauna
of the west coast of South Africa species, community and biogeographic patterns. South African Journal of Zoology 27(3):115-120.
RENYI, A. 1961. On measures of entropy and information. Proceedings of the 4th Berkeley Symposium on Mathematical Statistics and Probability 1:547-561. ROBINS, R.; RAY, G. C. & DOUGLAS, J. 1986. A field guide to
Atlantic Coast Fishes of North America. Boston, Houghton Mifflin Company. 354p.
ROCHA, L. A. 2004. Mitochondrial DNA and color pattern
variation in three western Atlantic Halichoeres (Labridae), with the revalidation of two species. Copeia 2004 (4):770-782.
ROCHA, L. A. & ROSA, I. L. 2001a. Baseline assessment of reef fish
assemblages of Parcel Manuel Luiz Marine State Park, Maranhão, north-east Brazil. Journal of Fish Biology 58:985-998.
ROCHA, L. A. & ROSA, R. S. 2001b. Halichoeres brasiliensis
(Bloch, 1791), a valid wrasse species (Teleostei: Labridae) from Brazil, with notes on the Caribbean species Halichoeres radiatus (Linnaeus, 1758). Aqua Journal of Ichthyology 4(4):161-166.
ROCHA, L. A.; ROSA, I. L. & ROSA, R. S. 1998. Peixes recifais da
costa da Paraíba, Brasil. Revista Brasileira de Zoologia 15(2):553-566.
ROSA, R. S. & MOURA, R. L. 1997. Visual assessment of reef fish
community structure in the Atol das Rocas Biological Reserve, off Northeastern Brazil. Proceedings of the 8th International Coral Reef Symposium 1:983-986. ROSA, R. S.; ROSA, I. L. & ROCHA, L. A. 1997. Diversidade da
ictiofauna de poças de maré da praia do cabo branco, João Pessoa, Paraíba, Brasil. Revista Brasileira de Zoologia 14(1):201-212.
ROSSI-WONGTCHOWSKI, C. L. D. B. & PAES, E. T. 1993. Padrões
espaciais e temporais da comunidade de peixes demersais do litoral norte do Estado de São Paulo – Ubatuba, Brasil.
Boletim do Instituto Oceanográfico 10:169-188. SILBERSCHNEIDER, V. & BOOTH, D. J. 2001. Resource use by
Enneapterygius rufopileus and other rockpool fishes.
Environmental Biology of Fishes 61:195-204.
SIMPSON, E. H. 1949. Measurement of Diversity. Nature 163:688. SOLOW, A. R. 1993. A Simple Test for Change in Community
Structure. Journal Animal Ecology 62:191-193.
STEPIEN, C. A. 1990. Population structure, diets and biogeographic
relationship of a rocky intertidal fish assemblage in central Chile: high levels of herbivory in a temperate system.
Bulletin of Marine Science 47:598-612.
SYMS, C. & JONES, G. P. 2000. Disturbance, habitat structure, and
dynamics of a coral-reef fish community. Ecology 81(10):2714-2729.
TER BRAAK, C. & SMILAUER, P. 1998. CANOCO Reference Manual and User’s Guide to Canoco for Windows: Software for Canonical Community Ordination. Version 4.0. Ithaca, NY, Microcomputer Power. 352p.
UNDERWOOD, A. J. & CHAPMAN, M. G. 1996. Scales of spatial
patterns of distribution of intertidal invertebrates. Oecologia 107(2):212-224.
VARAS, E. & OJEDA, F. P. 1990. Intertidal fish assemblage of the
central Chilean coast: diversity, abundance and trophic patterns. Revista de Biología Marina 25:59-70.
WILLIS, T. J. 2001. Visual census methods underestimate density
and diversity of cryptic reef fishes. Journal of Fish Biology 59:1408-1411.
WILLIS, T. J. & ROBERTS, C. D. 1996. Recolonization and recruitment
of fishes to intertidal rockpools at Wellington, New Zeland.
Environmental Biology of Fishes 47:329-343.
WOOD, E. M. & WELLS, S. M. 1988. The Marine Curio Trade: Conservation Issues. Ross-on-Wye, UK, Marine Conservation Society. 120p.
YOSHIYAMA, R. M. 1981. Distribution and abundance patterns of
rocky intertidal fishes in central California. Environmental Biology of Fishes 6:315-332.
ZAPATA, F. 1992. El estado del conocimiento sobre la biologia de
peces de arrecifes coralinos del Pacifico colombiano y recomendaciones para su estudio. Boletín Ecotropica 1:67-74.