ABSTRACT: Botanical composition affects the nutritive value and nutrient degradation kinetics of pastures. However, there is little information about pastures composed of various species. The present study was conducted to evaluate in situ degradation kinetics of dry matter (DM), crude protein (CP) and neutral detergent fi ber (NDF) of a naturalized non fertilized pasture (NNF), naturalized fertilized pasture (NF), sown pasture with Lolium perenne L. and Trifolium repens L. (RGWC), and sown pasture with Bromus valdivianus Phil., Dactylis glomerata L., Holcus lanatus L., L. perenne and T. repens (MIXED); at three dates of harvest (early-spring, mid-spring and autumn). Duplicate bags were incubated in the rumen of three cannulated cows for 2, 4, 8, 12, 24 or 48 h. Zero-hour bags were washed with water. Ruminal degradation was evaluated accord-ing to exponential models with or without lag phase. Pasture chemical composition showed on average low DM, high CP and digestible organic matter (DOMD). Degradation parameters of DM, CP and NDF exhibited strong pasture type*date of harvest interactions. In general, high potential degradability and fractional degradation rates of DM, CP and NDF were observed. Nutrient sup-ply was generally higher for RGWC and NF, especially compared with NNF during autumn. Natu-ralized fertilized pastures supply similar amounts of nutrients to grazing cattle as sown pastures. However, it is necessary to consider other variables that determine the productive performance such as DM intake and rumen fermentation products.
Introduction
In humid-temperate regions, perennial ryegrass (Lolium perenne L.) pastures are the main source of nu-trients for dairy cattle; however alternatives that might improve farm sustainability have been evaluated (Nie et al., 2004). Naturalized fertilized pastures may be suitable for cattle production systems as they have similar herb-age mass yield and nutrient content as sown pastures; and lower production costs (Balocchi et al., 2010). Nutri-ent contNutri-ent does not assure certain animal performance levels, as productive responses depend on the quantity of nutrients available to the animal, which in turn is de-termined by fermentation processes (Hackmann et al., 2010). Therefore, alternative evaluations such as nutri-ent ruminal digestibility (Dulphy et al., 1999) are neces-sary to establish the feasibility of naturalized pastures as a forage source for grazing dairy systems.
Ruminal degradability of pastures is affected by the fertilization, season of the year, grazing manage-ment, botanical composition, stage of maturity, and method of conservation (Aufrere et al., 2003; Kasuya et al., 2008). In addition, forage species-stage of maturity interactions may also occur. Stages of maturity may vary among grass species at a given date of harvest and dif-ferences in digestibility occur due to the variable age of leaves or tillers, the timing of ear emergence and stem elongation (Bruinenberg et al., 2002). From this point of view, naturalized pastures are a unique combination of species, whose nutritive value should be determined.
The ruminal in situ incubation technique is consid-ered to be a reference method to estimate degradation parameters, such as soluble, insoluble but degradable and undegradable fractions, potential and effective
de-gradability, when adjusted to suitable nonlinear models (Ørskov and McDonald, 1979). These parameters are used by feeding evaluation models to estimate the nu-tritive value, nutrient supply and animal performance (Hackmann et al., 2010). For example, high rates of deg-radation have been implied to result in high voluntary intake and thus higher performance (Sun et al., 2012).
To our knowledge, there is little information about the degradation kinetics of permanent pastures with dif-ferent botanical composition at a vegetative stage of ma-turity. So, the aim of this study was to assess the rumen degradation dynamics of dry matter, crude protein and neutral detergent fi ber of four permanent pastures with different botanical composition, at three different dates of harvest in southern Chile.
Materials and Methods
Grass herbage samples
All herbage samples were obtained in Valdivia, Chile (39º47’ S, 73º13’ W). The four evaluated pastures comprised a naturalized non fertilized pasture (NNF), naturalized fertilized pasture (NF), a sown pasture with L. perenne and Trifolium repens (RGWC), and a sown pas-ture with Bromus valdivianus Phil., D. glomerata, Holcus lanatus L., L. perenne and T. repens (MIXED), which was sown aiming to represent a naturalized pasture in good condition (according to Grime, 1989), and a similar pro-portion between grass species (17.5 %) and 30 % of T. repens. The layout of the pastures was organized in a ran-domized block design with three replicates (paddocks with an area of 400 m2). Each treatment was grazed by dairy cows, once it had reached an average pre-grazing herbage mass of 2,400 – 2,600 kg DM ha−1, estimated by
Received February 27, 2013 Accepted May 10, 2013
Universidad Austral de Chile/Faculty of Agricultural Sciences, Independencia 641 – PO Box 567 – Valdivia – Chile (Graduate School).
*Corresponding author <[email protected]>
Edited by: Concepta Margaret McManus Pimentel
In situ
rumen degradation kinetics as affected by type of pasture and date of harvest
a Rising Plate Meter (Filip’s Folding Plate Pasture Meter, Jenquip, Feilding, New Zealand). Cows left the paddocks with an average herbage mass of 1,400 – 1,600 kg DM ha−1.
Treatments were comprised of the four pastures during three dates of harvest (DH1: early-spring [5 Oct 2009], DH2: mid spring [5 Nov 2009] and DH3: autumn [5 Apr 2010]). Fertilizers were applied to meet the re-quirements of a pasture with a potential production of 12 t DM ha−1 (i.e. 150 kg N ha−1; 50 kg P
2O5 ha −1; 120
kg K2O ha−1; 115 kg MgO ha−1; 1,000 kg CaCO 3 ha
−1).
Five applications of 30 kg N ha−1 were done in Aug, Oct and Nov 2009, and Mar and Apr 2010. The other nutrients were applied once a year in Apr 2009. All for-age samples were harvested at the same time of the day (10h00) from each paddock, the day before a grazing event; cutting at fi ve cm above ground level with shear-ing scissors in ten different places in the paddock, at random. One pooled sample (ca. 250 g) was obtained for each paddock (fi eld replicate) to determine botanical composition and nutrient content. The remaining mate-rial was freeze-dried and then ground to 5 mm using a Wiley mill.
In situ incubations
Three dry cows (635.5 ± 35.6 kg live weight) fi t-ted with a ruminal cannula (4" Pliable Rumen Cannula w/ Stopper and U Bolt, ANKOM technologies, NY, USA) were employed for the rumen degradability study. Cows grazed on a grass (main species: Agrostis capillaris, B. valdivianus, D. glomerata, and L. perenne) pasture (187 g kg−1 DM; 164 g CP kg−1 DM; 511 g NDF kg−1 DM) while incubations were performed. A new allocation was of-fered daily with a herbage allowance of 7 kg DM for each cow. An apparent intake of 5 kg DM day−1 was es-timated as the difference between pre- and post-grazing pasture herbage masses and the area grazed. One day prior to the incubation, the rumen pH of cannulated cows was measured every two hours to assure optimal conditions for microbial growth; this resulted in an aver-age pH level of 6.29 ± 0.16.
Samples of approximately 4 g DM were placed in dacron bags (10 × 20 cm; pore size of 40 – 60 µm) and sealed. Dacron bags (n: 144) were incubated in the ru-men for 2, 4, 8, 12, 24 and 48 h using a “gradual in/ all out” sequence, with duplicate bags at each time for each forage sample. All bags were placed within three polyester laundry bags (30 × 40 cm) to ensure similar location within the rumen and to facilitate location for removal (Vanzant et al., 1996). After removal from the rumen, dacron bags containing forage residues were washed under running cold water until no further color appeared, frozen at -20 ºC for 24 h to stop fermenta-tive activity and rinsed in a domestic washing machine with cold tap water for 30 minutes. The 0 h bags (n = 6 for each treatment) were not placed in the rumen and the solubility was determined by soaking them in warm water (40 ºC) for 20 minutes. Residues were dried at 60
ºC for 48 h, individually weighed and duplicates were pooled by incubation time to analyze their CP and NDF content. From these data, nutrient disappearance was calculated.
Digestion kinetics
Digestion curves for each data set were used to evaluate in situ degradation kinetics of pasture treat-ments in the rumen. Data were fi tted into exponential models with (McDonald, 1981) and without (Ørskov and McDonald, 1979) lag time. The model with highest cor-relation coeffi cient was selected for each nutrient. Thus, the disappearance of DM and CP were determined using the non-linear model described by Ørskov and McDon-ald (1979) to determine the constants and potential deg-radation (PD) according to the exponential model:
PD = A + B(1 – e–kt)
where: A is the soluble fraction (g kg–1; fraction washed out at t = 0; this value resulted from the incubation of 0 h bags and fi xed into the model); B is the insoluble de-gradable fraction (g kg–1), k is the fractional degradation rate (h−1) and t is the time (h).
The effective degradability (ED; g kg–1) was cal-culated from the afore mentioned parameters assuming fractional passage rates (kp) of 2, 5 and 8 % h−1:
ED = A + B(k/(k + kp))
The passage rates are based on NRC (2001), which recommends those values for low, medium and high-producing dairy cows, respectively.
The disappearance of NDF was determined using the non-linear model with a lag phase described by Mc-Donald (1981):
PD = A, for t < L
PD = A + B(1-e-k(t-L))
where: PD (g kg–1) is the degraded NDF at time t, A the intercept with the Y-axis; B (g kg–1) the insoluble but potentially degradable NDF fraction, k (h−1) the frac-tional degradation rate constant, t the incubation time (h) and L is the lag phase (h). In the parameterization of the model we assumed NDF to be insoluble in water, the A-fraction represented feed particle losses, and the fractional degradation rate was similar in the lost and remaining particles. The effective degradability in the rumen (ED; g kg–1) was calculated through the equation of McDonald (1981):
ED = A + B[k/(k+kp)]e-kpL
where: Yijk is an observation of the dependent variable; µ is the population mean for the variable; i is the random effect of the fi eld replicate; j is the effect of type of pas-ture; k is the effect of date of harvest; jk is the effect of the interaction between type of pasture and date of harvest; and ijk is the random error associated with the observation ijk.
Values with p 0.05 were considered as signifi cant. Means were compared using the least squares mean lin-ear hypothesis test.
Results and Discussion
Botanical and chemical composition
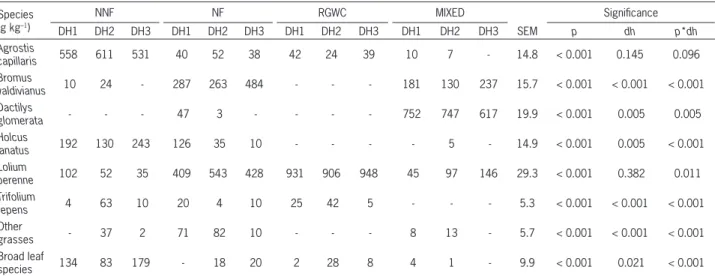
The naturalized non fertilized pasture was com-posed mainly of browntop (Agrostis capillaris L.), york-shire fog (Holcus lanatus) and broad leaf species (BLS), with similar proportions among dates of harvest. The main species of the naturalized fertilized pasture were perennial ryegrass (L. perenne) and bromegrass (B. val-divianus). The improvement in soil nutrient content has shown to favor valuable grasses at the expense of forbs and less desirable grasses such as browntop (Butkuviene and Butkute, 2008). The perennial ryegrass and white clover mixture had over 900 g kg–1 of ryegrass; whereas orchard grass (D. glomerata) followed by bromegrass dominated the MIXED pasture (Table 1).
Pastures had on average low DM (174 g kg−1), high CP (216 g CP kg−1 DM) and DOMD (> 700 g kg−1; Table 2), which is characteristic of vegetative high qual-ity pastures of temperate regions (Kolver and Muller, 1998). Pastures DM content was affected by the inter-action between type of pasture and date of harvest (p < 0.01). Surprisingly, NNF and RGWC harvested dur-ing early sprdur-ing showed higher DM content than when Model parameters were estimated with the
non-linear procedure of Graphpad Prism v5.0. Separate curves were estimated for each replicate.
Botanical and Chemical Analyses
Botanical composition of the pastures was deter-mined by separating each species from fresh pasture samples by hand, then dried at 60 ºC for 48 h and weighed to estimate the proportion of each species in relation to the total dry mass.
Forages and bag residues were dried at 60 ºC for 48 h in a forced-air oven and ground in a Wiley mill through a 1mm sieve. Analytical dry matter content was determined by weighing before and after drying at 105 ºC for 12 h (AOAC, 1996). Analytical fractions for each pas-ture sample comprised crude protein (CP; AOAC, 1996; method 978.10), neutral detergent fi ber (NDF; Van Soest et al., 1991), acid detergent fi ber (ADF; AOAC, 1996), digestible organic matter in the dry matter (DOMD) by two-stage in vitro digestibility (Tilley and Terry, 1963), water-soluble carbohydrates (WSC; MAFF, 1985) and soluble protein contents (SP; Licitra et al., 1996).
Statistical Analyses
Prior to ANOVA, assumptions of normality and homogeneity of variance of the data were checked. Bo-tanical and chemical composition, fi tted NLIN degrada-tion parameters and ED were analyzed as a randomized complete block design with a 4 × 3 factorial arrange-ment, with four pastures and three dates of harvest as main factors and the random effect of fi eld replicate as a block; using the MIXED procedure of SAS (SAS Institute, 2006). The model used for the analysis was:
Yijk = µ + i + j + k + jk + ijk
Table 1 – Mean botanical composition of pastures.
Species (g kg–1)
NNF NF RGWC MIXED Signifi cance
DH1 DH2 DH3 DH1 DH2 DH3 DH1 DH2 DH3 DH1 DH2 DH3 SEM p dh p*dh
Agrostis
capillaris 558 611 531 40 52 38 42 24 39 10 7 - 14.8 < 0.001 0.145 0.096
Bromus
valdivianus 10 24 - 287 263 484 - - - 181 130 237 15.7 < 0.001 < 0.001 < 0.001 Dactilys
glomerata - - - 47 3 - - - - 752 747 617 19.9 < 0.001 0.005 0.005
Holcus
lanatus 192 130 243 126 35 10 - - - - 5 - 14.9 < 0.001 0.005 < 0.001
Lolium
perenne 102 52 35 409 543 428 931 906 948 45 97 146 29.3 < 0.001 0.382 0.011
Trifolium
repens 4 63 10 20 4 10 25 42 5 - - - 5.3 < 0.001 < 0.001 < 0.001
Other
grasses - 37 2 71 82 10 - - - 8 13 - 5.7 < 0.001 < 0.001 < 0.001 Broad leaf
species 134 83 179 - 18 20 2 28 8 4 1 - 9.9 < 0.001 0.021 < 0.001
collected during late spring and autumn. It is believed that the DM content of samples harvested in late spring and autumn might have been affected by a previous rainfall event that altered DM content (increasing the fresh weight), without modifying cell nutrient content; which is refl ected on the ADF content that increased for late spring and autumn. Nitrogen fertilized pastures (NF, RGWC and MIXED) showed higher CP levels (p < 0.001; > 200 g CP kg−1 DM) than NNF (< 180 g CP kg−1 DM), which is in accordance with the positive relation-ship between N fertilization and CP in pastures (Astigar-raga et al., 2002).
Within fertilized treatments, NF had higher levels of CP than RGWC and MIXED for DH1 and DH2, and lower CP content than RGWC and MIXED for DH3. In general terms, WSC content was below 120 g kg−1 DM and the lowest levels were observed for MIXED (p < 0.001), which may be explained by the high propor-tion of orchard grass in this pasture, a species which is characterized by its low WSC content (Fulkerson et al., 2007; Turner et al., 2007). NDF content ranged between 343 and 518 g kg−1 DM, with highest levels observed for mid-spring pastures. This may be due to higher cell wall and lignin contents in forage plants as the growing
season progressed (Aufrere et al., 2003; Kasuya et al., 2008). However, the interaction between type of pas-ture and date of harvest (p < 0.01) indicates that the NDF content decreased from late spring to autumn for NNF, NF and RGWC, whereas it remained similar for MIXED.
Acid detergent fi ber was only affected by the date of harvest (p < 0.001), with higher levels for late spring and autumn than for early spring, which is in accordance with the increase in cell wall content as plants become reproductive (Chaves et al., 2006b).
Dry Matter degradation kinetics
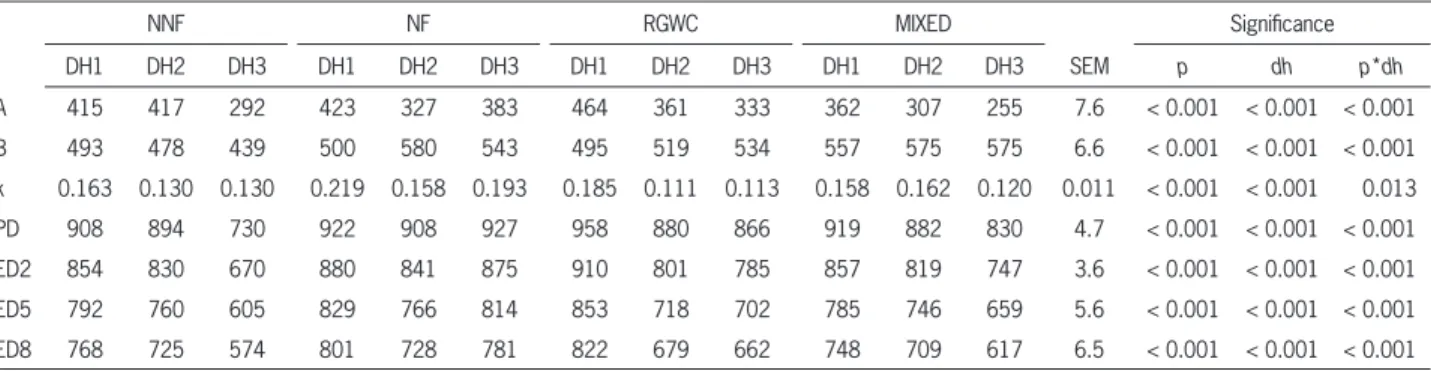
The PD, ‘A’ and ‘B’ fractions, ‘k’ coeffi cient, ED2, ED5 and ED8 exhibited strong ‘pasture’*‘date of har-vest’ interactions (p 0.05; Table 3), which was also re-ported by Dohme et al. (2007). The PD for the RGWC-DH1 was the highest (958 g kg–1 DM) above all other pasture treatments, while NNF-DH3 had the lowest PD (730 g kg–1 DM). These values are similar to others (Do-hme et al., 2007; Trujillo et al., 2010; Valderrama and Anrique, 2011). The higher PD of RGWC than NNF, may be related to the higher degradability of L. perenne than Agrostis spp. (Bruinenberg et al., 2004), the main species
Table 2 – Mean nutrient content of pastures.
Variables (g kg−1)
NNF NF RGWC MIXED Signifi cance
DH1 DH2 DH3 DH1 DH2 DH3 DH1 DH2 DH3 DH1 DH2 DH3 SEM p dh p*dh
DM 207 171 177 162 156 159 202 160 171 163 177 192 7.41 < 0.001 0.029 0.002
CP 176 146 180 250 266 218 211 209 235 231 231 234 9.03 < 0.001 0.781 0.003
NDF 412 504 477 426 518 431 343 434 412 363 450 450 9.46 < 0.001 < 0.001 0.002
ADF 214 272 281 199 262 259 193 279 273 223 274 280 9.99 0.124 < 0.001 0.695
DOMD 747 776 700 757 769 775 769 780 711 737 770 707 11.82 0.026 < 0.001 0.020
WSC 111 144 93 105 98 115 120 114 94 82 96 78 6.36 < 0.001 < 0.001 < 0.001 NNF: naturalized non fertilized pasture; NF: naturalized fertilized pasture; RGWC: sown pasture with Lolium perenne and Trifolium repens; MIXED: sown pasture with Bromus valdivianus, Dactylis glomerata, Holcus lanatus, Lolium perenne and Trifolium repens; DH1: early-spring (5 Oct 2009), DH2: mid spring (5 Nov 2009) and DH3: autumn (5 Apr 2010); SEM: standard error of the means; p: pasture type; dh: date of harvest; p*dh: interaction between pasture type and date of harvest; DM: Dry matter; CP: Crude Protein; NDF: Neutral detergent fi ber; ADF: Acid detergent fi ber; DOMD: Digestible organic matter on dry matter basis; WSC: Water soluble carbohydrates.
Table 3 – In situ dry matter degradation parameters of pastures across dates of harvest.
NNF NF RGWC MIXED Signifi cance
DH1 DH2 DH3 DH1 DH2 DH3 DH1 DH2 DH3 DH1 DH2 DH3 SEM p dh p*dh
A 415 417 292 423 327 383 464 361 333 362 307 255 7.6 < 0.001 < 0.001 < 0.001
B 493 478 439 500 580 543 495 519 534 557 575 575 6.6 < 0.001 < 0.001 < 0.001
k 0.163 0.130 0.130 0.219 0.158 0.193 0.185 0.111 0.113 0.158 0.162 0.120 0.011 < 0.001 < 0.001 0.013
PD 908 894 730 922 908 927 958 880 866 919 882 830 4.7 < 0.001 < 0.001 < 0.001
ED2 854 830 670 880 841 875 910 801 785 857 819 747 3.6 < 0.001 < 0.001 < 0.001
ED5 792 760 605 829 766 814 853 718 702 785 746 659 5.6 < 0.001 < 0.001 < 0.001
ED8 768 725 574 801 728 781 822 679 662 748 709 617 6.5 < 0.001 < 0.001 < 0.001
of RGWC and NNF, respectively. The ‘pasture’*‘date of harvest’ interaction indicates that ruminal in situ DM degradation parameters of pastures were affected in different ways by the date of harvest. For example, the potential degradability was higher for RGWC during DH1; NNF and NF during DH2; and NF during DH3. In general terms PD tended to decrease from DH1 to DH3. It was expected that because of changes in the ratio of cell walls to cell contents, the digestibilities of pastures would be higher in the early vegetative stage (early spring for this study) due to a high cell soluble content (Groot et al., 1999).
The DM readily soluble fraction (A) of RGWC-DH1 was higher (464 g kg–1 DM) than that of the other treatments, with MIXED-DH3 having the lowest value (255 g kg–1 DM). RGWC showed the lowest NDF content during the three dates of harvest, resulting in a higher readily soluble fraction. Higher soluble fractions for pe-rennial ryegrass than for orchard grass and bromegrass have been reported earlier (Dohme et al., 2007; Hoffman et al., 1993; Le Goffe et al., 1993). Our values are similar to those reported by Valderrama and Anrique (2011) for vegetative mixed and ryegrass pastures (346 and 442 g kg–1 DM, respectively), Trujillo et al. (2010) for peren-nial ryegrass (380 g kg–1 DM) and Sun et al. (2010) for vegetative perennial ryegrass harvested in early spring (435 – 470 g kg–1 DM). The soluble fraction was higher for RGWC, NNF and NF during DH1, DH2 and DH3, re-spectively. MIXED showed a consistently lower soluble fraction for the three dates of harvest, which is consis-tent with the lower WSC conconsis-tent (Table 2).
The readily soluble fraction of DM was higher for early spring than for late spring and autumn. This agrees with results obtained by Dohme et al. (2007). However, Le Goffe et al. (1993) did not fi nd effects for spring, sum-mer and autumn collected forages; suggesting that the effect of date of harvest on degradability parameters depends on the forage species. On the other hand, in-soluble but degradable fraction ‘B’ of DM refl ected the inverse of the readily soluble fraction and was consis-tently higher for MIXED across the three dates of har-vests, whereas NNF had the lowest values during DH2 and DH3. Although insoluble degradable fraction was higher for DH2, such difference was not considered bio-logically important as it represented less than 5 % of differences among the highest and lowest values. The values of RGWC and MIXED agree with those reported by Le Goffe et al. (1993) for perennial ryegrass (496 and 531 g kg–1 DM) and orchard grass (564 g kg–1 DM); and Trujillo et al. (2010) for perennial ryegrass (520 g kg–1 DM).
The naturalized fertilized pasture had the high-est fractional degradation rates among pastures across the three dates of harvest. The highest and lowest frac-tional degradation rates of DM were observed for NF-DH1 (0.22 h−1) and RGWC-DH2 (0.11 h−1), respectively; and are in accordance with the fractional degradation rates of 0.123 and 0.182 h−1 for ryegrass and mixed
(mainly composed by grasses) pastures (Valderrama and Anrique; 2011); and of 0.148 – 0.173 h−1 for vegetative ryegrass cultivars with a similar regrowth period (Sun et al. 2010). Faster fractional degradation rates of DM were found for early spring than late spring and autumn. This might be related to a lower leaf:stem ratio, as stems de-grade slower than leaves (Chaves et al., 2006a).
Pastures with higher fractional degradation rates had higher effective degradability (ED) values, and were less affected by passage rate. For example, the lowest ef-fect of passage rate was observed with NF-DH1, which had the highest fractional degradation rate (0.219 h−1) with a reduction of 7.9 units of percentage of total de-gradability considering passage rates of 0.02 and 0.05 h−1.
The effective degradability estimated with rumi-nal passage rates of 0.02, 0.05 and 0.08 h−1 were consis-tently higher for RGWC-DH1 (910; 853; and 822 g kg–1 DM, respectively) and lower for NNF-DH3 (670; 605; and 574 g kg–1 DM, respectively). All pastures showed high ED values during DH1 and DH2; however, it was considered that differences of biological importance among pastures only occurred during autumn, where NF showed a consistently higher ED compared to the other pastures (875, 814 and 781 g kg–1 DM for rumen outfl ows of 0.02, 0.05 and 0.08 h−1). In general terms, increasing ruminal outfl ow reduced the ED, but did not alter the patterns observed in the different treatments. Naturalized non fertilized had a lower ED during DH3 despite the passage rate used for the estimation. Natural-ized fertilNatural-ized pasture had similar ED values in DH1 and DH3 with a reduction in DH2, which was higher consid-ering faster passage rates (39; 63; and 73 g kg–1 DM for passage rates of 0.02, 0.05 and 0.08 h−1). Effective de-gradability was highest for early spring, followed by late spring and autumn. The highest ruminal effective de-gradability for RGWC was observed in DH1 and dimin-ished to similar values in DH2 and DH3. Finally ED of MIXED decreased from DH1 to DH3. Similar values for effective degradability for vegetative ryegrass pastures have been reported by Trujillo et al. (2010) with 680 g kg–1 DM considering a passage rate of 0.06 h−1 %, and Valderrama and Anrique (2011) with 878, 802 and 749 g kg–1 DM for 0.02, 0.05 and 0.08 h−1 rumen outfl ows.
Crude Protein degradation kinetics
enzyme polyphenol oxidase, which reduces proteolysis by binding proteins with quinones forming complexes resistant to the digestive enzymes (Niderkorn and Bau-mont, 2009). Except for RGWC-DH1 and RGWC-DH2, predicted soluble fractions were lower than the 520 g kg–1 CP predicted for a perennial ryegrass pasture by Le Goffe et al. (1993), who observed that the CP soluble fraction was lower in autumn than in spring, whereas we observed higher ‘A’ fraction for autumn and early spring than for late spring. Although these differences were signifi cant, their relative small range (50 g kg–1 CP) suggest that seasonal variation in soluble CP fraction for NNF, NF and RGWC has little biologi-cal importance, which agrees with Steg et al. (1994) who found little effect of cutting date on CP soluble fraction.
The insoluble potentially degradable fraction of CP was higher for MIXED-DH1 (702 g kg–1 CP) and lower for RGWC-DH3 (440 g kg–1 CP). MIXED had a high degradable fraction for all dates of harvest, whereas RGWC 'B' fraction was always lower. Pastures harvested during autumn had a higher insoluble degradable frac-tion than those harvested in early and mid spring.
Our predicted values for soluble and degradable CP fractions are within the ranges reported by NRC (2001) for intensively managed pastures with CP con-tent of 265 ± 56 g kg−1 DM (A: 307 ± 183 g kg–1 CP; B: 635 ± 178 g kg–1 CP), however the fractional degradation rates (0.125 ± 0.045 h−1) of NRC (2001) were lower than ours.
The maximum fractional disappearance rate was observed in RGWC-DH2 (0.294 h−1), and the lowest in RGWC-DH3 (0.146 h−1). Valderrama and Anrique (2011) predicted ‘k’ coeffi cients of 0.314 and 0.157 h−1 for mixed
and ryegrass pastures, respectively, whereas Sun et al. (2010) reported CP fractional degradation rates rang-ing from 0.122 to 0.347 h−1 for perennial ryegrass, de-pending on the cultivar and regrowth period. In general terms, the fractional degradation rate tended to decrease in autumn. The interaction showed that the fractional degradation rate was higher for RGWC in DH1, RGWC and MIXED in DH2, whereas no differences among pas-tures were observed in DH3.
Fractional degradation rates of CP were higher than those of DM and NDF; this asynchrony has been described previously for permanent pastures (Chaves et al., 2006b; Sun et al., 2010). For example, Valder-rama and Anrique (2011) estimated that differences between CP and DM degradation rates were about 73 and 27 % higher in mixed and ryegrass pastures, re-spectively.
In contrast, as occurred with the DM effective degradability, the patterns of crude protein ED (cpED) were more affected by the rumen passage rate used for the estimation. For example, the ED estimated with a passage rate of 0.02 h−1, decreased from DH1 to DH3 for all pasture types except for NF with the highest and lowest values for RGWC-DH1 (942 g kg–1 CP) and NNF-DH3 (786 g kg–1 CP), respectively. On the other hand, considering a 0.05 h−1 rumen passage rate, ED decreased from DH1 to DH3 for NNF, NF and RGWC; while no differences were observed between DH1 and DH2 for MIXED. Furthermore, ED with passage rate of 0.08 h−1 decreased from DH1 to DH3 for NNF; was similar between DH2 and DH3 for NF; similar for DH1 and DH2, and higher than DH3; and higher in DH2 for MIXED (DH2>DH1>DH3). These fi ndings disagree with Flores et al. (2008) and Salaun et al. (1999) who
Table 4 – In situ crude protein degradation parameters of pastures across dates of harvest.
NNF NF RGWC MIXED Signifi cance
DH1 DH2 DH3 DH1 DH2 DH3 DH1 DH2 DH3 DH1 DH2 DH3 SEM p dh p*dh
A 300 302 343 372 330 375 459 399 458 265 309 343 11.8 < 0.001 < 0.001 0.005
B 620 599 498 582 627 546 519 549 440 702 618 578 11.9 < 0.001 < 0.001 < 0.001
k 0.254 0.223 0.161 0.23 0.215 0.208 0.272 0.294 0.146 0.193 0.274 0.173 0.017 < 0.001 < 0.001 < 0.001
PD 921 901 841 955 957 921 977 948 898 966 926 920 3.8 < 0.001 < 0.001 < 0.001
ED2 876 849 786 908 903 872 942 912 845 902 885 860 2.6 < 0.001 < 0.001 < 0.001
ED5 819 787 722 868 838 814 897 868 785 822 831 790 4.5 < 0.001 < 0.001 < 0.001
ED8 772 738 675 828 785 769 859 828 742 761 786 737 6.1 < 0.001 < 0.001 < 0.001
ERDP 144.1 114.9 130.0 214.5 222.8 177.6 189.2 181.4 184.5 189.8 191.9 184.9 0.92 < 0.001 < 0.001 < 0.001
UDP 31.9 31.1 50.0 30.6 43.2 40.4 21.8 27.6 50.5 41.2 39.6 49.1 0.92 < 0.001 < 0.001 < 0.001
suggest that estimates of cpED for autumn are com-parable to those observed typically for early spring growth.
The lower cpED may be related to environmental factors such as rainfall, temperature and light, e.g. high-er temphigh-eratures are negatively related to protein degrad-ability (Salaun et al., 1999). In our experiment (Southern Hemisphere) the mean daily temperatures in the week preceding sampling were 9.8 ºC in Oct, 10.2 ºC in Nov and 14.2 ºC in Apr. Le Goffe et al. (1993) estimated an ED (kp = 0.06 h−1) that ranged between 796 and 858 g kg–1 CP, which are similar to our values for ED consider-ing a kp of 0.05 h−1; they also observed a lower ED for autumn in relation to spring.
Values of effective rumen degradable protein (ERDP) give an estimate of N supply to microbes for grazing ruminants (Bowen et al., 2008). Higher and low-er supplies of ERDP wlow-ere obtained for NF-DH2 (222.8 g kg−1 DM) and NNF-DH2 (114.9 g kg−1 DM), respectively. On the other hand, the amount of protein escaping ru-men degradation (UDP) may be available at an intestinal level as part of the metabolizable protein (Flachowsky and Lebzien, 2006); UDP was higher for RGWC-DH3 (50.5 g kg−1 DM) and lower for RGWC-DH1 (21.8 g kg−1 DM). Protein escaping from the rumen was higher in au-tumn than in early and mid spring for NNF, RGWC and MIXED, whereas for NF it was higher during mid spring and autumn than early spring. The higher UDP might be related to an increase in the N that is linked to the cell walls, which usually occurs as the growing season pro-gresses and plants mature, resulting in a lower leaf:stem ratio (Chaves et al., 2006a).
According to NRC (2001), ERDP estimates satisfy the requirements of a 500 kg LW Holstein Friesian lac-tating dairy cow (Milk production: 20 l day−1, Fat: 4.4 %, milk crude protein: 3.5 %, without body weight change) i.e. 99.1 g RDP per kg of ingested DM, assuming a DM intake of 15 kg day−1. Furthermore, RDP supply exceeds requirements by 16 to 248 %. This surplus can be excret-ed as urinary N and may have negative impacts on the environment such as nitrate leaching, ammonia volatil-ization and nitrous oxide generation (Ledgard, 2001).
Neutral Detergent Fiber degradation kinetics
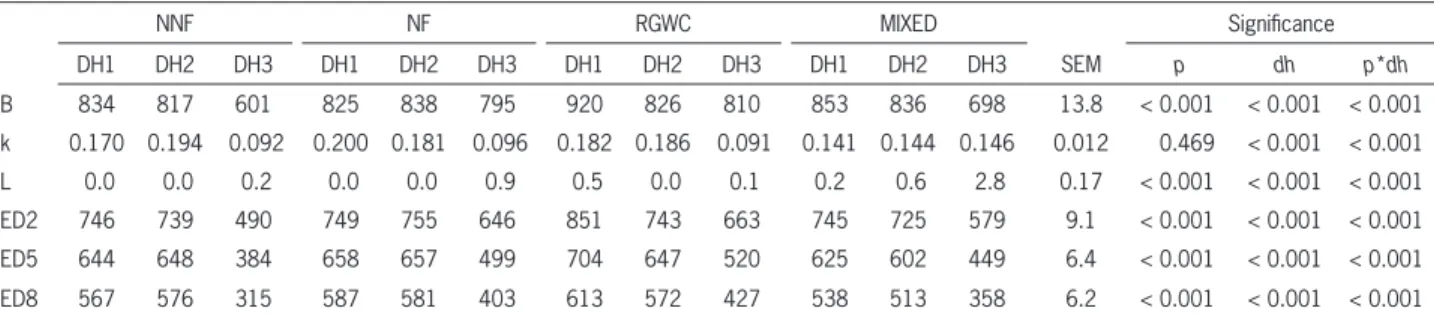
Concentration and degradation characteristics of NDF are important factors determining the energetic value of forages for ruminants (Moharrery et al., 2009). All NDF degradation parameters were affected by the ‘pasture’*‘date of harvest’ interaction (p < 0.05), which agrees with Dohme et al. (2007) and Hoffman et al. (1993). More than 600 g kg–1 NDF was present in the insoluble and potential degradable fraction, which is in accordance with Hoffman et al. (1993) for perennial grasses at the second node stage of maturity, and Sun et al. (2010) for vegetative perennial ryegrass cultivars.
Insoluble degradable NDF was similar between early and mid-spring and higher than autumn. The high-est B fraction was predicted for RGWC in DH1 (920 g
kg–1 NDF; Table 5); no differences among pastures were observed in DH2, whereas RGWC and NF were higher in DH3; which agrees with Cherney et al. (1993), who did not fi nd differences in NDF degradable fractions be-tween early and late spring. Salaun et al. (1999) found no differences for perennial ryegrass samples collected in late spring (908 g kg–1 NDF) and autumn (935 g kg–1 NDF); although their B fractions were numerically high-er, which might be explained by the higher N fertiliza-tion applied in their experiment (250 kg N ha−1), as N fertilization increases theoretical degradation in the ru-men (Ferri et al., 2004).
The degradation rate of NDF was higher for NF-DH1 (0.20 h−1) and lower for NNF, NF and RGWC in DH3 with values of around 0.09 h−1. In general terms, fractional degradation rate tended to be higher in DH1 and DH2 than DH3. The interaction arose from highest degradation rates for NNF, NF and RGWC during DH1 and DH2, whereas MIXED was highest during DH3. Our results partially agree with Uden (2006), who es-timated an insoluble degradable fraction of 883 g kg–1 NDF for perennial ryegrass harvested in spring with a short lag time (0.8 h), however the predicted fractional degradation rate was slower (0.042 h−1). On the other hand, Sun et al. (2010) predicted similar fractional deg-radation rates of NDF in perennial ryegrass for early spring (0.099 – 0.183 h−1) and Hoffman et al. (1993) for autumn samples (0.09 h−1). Degradation rates for DH3 were similar to those predicted by Chaves et al. (2006a) for perennial ryegrass leaves. However, values obtained for DH1 and DH2 were higher, probably because of the differences in the stage of maturity between our (vegeta-tive stage) and their (reproduc(vegeta-tive stage) samples.
The high ‘k’ coeffi cients suggest that pasture NDF, during spring, may be composed mainly by hemicellulo-ses with a low degree of lignifi cation, resulting in a faster fermentation (Cajarville et al., 2006), as hemicelluloses degrade faster than the other constituents of NDF or ADF (Hackmann et al., 2010). The same authors report-ed fractional degradation rates of 0.173 h−1 and 0.234 h−1 for NDF and hemicelluloses of alfalfa hay, respectively. These values may be comparable to vegetative grass pas-tures, as Hoffman et al. (1993) indicated that perennial ryegrass exhibits low lignifi cation, fast degradation rate and a high NDF effective degradability. Martineau et al. (2006) reported lower NDF ‘B’ fractions, ‘k’ coeffi cients and ED for timothy silages and hay harvested in repro-ductive stages, thus indicating the effect of the stage of maturity on NDF degradation kinetics.
Effective disappearance of NDF was relatively ex-tensive for all pastures. Effective NDF degradability with passage rates of 0.02, 0.05 and 0.08 h−1, was consistently higher for RGWC-DH1 (851, 704 and 613 g kg–1 NDF, respectively) and lower for NNF-DH3 (490, 384 and 315 g kg–1 NDF for ED2, ED5 and ED8, respectively). Slight-ly lower NDF effective degradability (540 g kg–1 NDF, estimated assuming a ruminal passage rate of 0.06 h−1) for perennial ryegrass pasture have been reported previ-ously (Trujillo et al., 2010).
Regardless of the rumen passage rate consid-ered to estimate ED (0.02, 0.05 and 0.08 h−1), ED was similar between DH1 and DH2 and higher than DH3 for NNF and NF, while it decreased from DH1 to DH3 (DH1>DH2>DH3) for RGWC and MIXED. Similar neu-tral detergent fi ber ED values were reported by Dohme et al. (2007) for a passage rate of 0.02 h–1 (662 and 759 g kg–1 NDF for orchard grass and ryegrass) and 0.08 h−1 (482 and 585 g kg–1 NDF for orchard grass and ryegrass). Using a slower passage rate (0.02 instead of 0.05) in-creased the degradation of NDF by 140-300 g kg–1 NDF. Such increase has been already reported by Chaves et al. (2006a) and occurs as a consequence of a longer resi-dence in the rumen.
Conclusions
High potential degradabilities and fractional degra-dation rates of DM, CP and NDF were observed, which is typical of forages harvested at immature stages of growth. Nutrient supply was generally higher for RGWC and NF, especially in comparison with NNF during au-tumn. Pastures harvested in early spring tended to have higher degradabilities and faster fractional degradation rates, followed by mid spring, and fi nally autumn.
Interactions between type of pasture and date of harvest occurred for all DM, CP and NDF degradation parameters, suggesting that it is advisable to have specif-ic estimations of degradation patterns for different pas-tures at each season of utilization, hence a more accurate data for ration formulation.
Acknowledgements
This research was funded by Dirección de Inves-tigación y Desarrollo, Universidad Austral de Chile, Val-divia, Chile (DID-S2011-20). The corresponding author would like to acknowledge Dr. Oscar Balocchi for his support and advices.
References
Association of Offi cial Analytical Chemists [AOAC]. 1996. Offi cial Methods of Analysis. 16ed. AOAC, Gaithersburg, MD, USA. Astigarraga, L.; Peyraud, J.L.; Delaby, L. 2002. Effect of nitrogen
fertiliser rate and protein supplementation on the herbage intake and the nitrogen balance of grazing dairy cows. Animal Research 51: 279-293.
Aufrere, J.; Graviou, D.; Demarquilly, C. 2003. Ruminal degradation of protein of cocksfoot and perennial ryegrass as affected by various stages of growth and conservation methods. Animal Research 52: 245-261.
Balocchi, O.; López, I.F.; Anwandter, V. 2010. Effect of pasture botanical composition and fertilizer application on herbage production, nutritive value and grazing preference of dairy cows. p. 69-80. In: Machado, C.F.; Wade, M.; Da Silva, S.C.; Agnusdei, M.; De Faccio, P.C.; Morris, S.; Beskow, W., eds. An overview of research on pastoral-based systems in the southern part of South America. Editorial Universidad Nacional del Centro de la Provincia de Buenos Aires, Buenos Aires, Argentina.
Bowen, M.K.; Poppi, D.P.; McLennan, S.R. 2008. Ruminal protein degradability of a range of tropical pastures. Australian Journal of Experimental Agriculture 48: 806-810.
Bruinenberg, M.H.; Valk, H.; Korevaar, H.; Struik, P.C. 2002. Factors affecting digestibility of temperate forages from seminatural grasslands: a review. Grass and Forage Science 57: 292-301.
Bruinenberg, M.H.; Van Gelder, A.H.; Perez, P.G.; Hindle, V.A.; Cone, J.W. 2004. Estimating rumen degradability of forages from semi-natural grasslands, using nylon bag and gas production techniques. Njas - Wageningen Journal of Life Sciences 51: 351-368.
Table 5 – In situ neutral detergent fi ber degradation parameters of pastures across dates of harvest.
NNF NF RGWC MIXED Signifi cance
DH1 DH2 DH3 DH1 DH2 DH3 DH1 DH2 DH3 DH1 DH2 DH3 SEM p dh p*dh
B 834 817 601 825 838 795 920 826 810 853 836 698 13.8 < 0.001 < 0.001 < 0.001
k 0.170 0.194 0.092 0.200 0.181 0.096 0.182 0.186 0.091 0.141 0.144 0.146 0.012 0.469 < 0.001 < 0.001
L 0.0 0.0 0.2 0.0 0.0 0.9 0.5 0.0 0.1 0.2 0.6 2.8 0.17 < 0.001 < 0.001 < 0.001
ED2 746 739 490 749 755 646 851 743 663 745 725 579 9.1 < 0.001 < 0.001 < 0.001
ED5 644 648 384 658 657 499 704 647 520 625 602 449 6.4 < 0.001 < 0.001 < 0.001
ED8 567 576 315 587 581 403 613 572 427 538 513 358 6.2 < 0.001 < 0.001 < 0.001
Butkuviene, E.; Butkute, R. 2008. Effects of pasture improvement measures on sward productivity, botanical and chemical composition. Zemes ukio Mokslai 15: 46-52.
Cajarville, C.; Aguerre, M.; Repetto, J.L. 2006. Rumen pH, NH3-N concentration and forage degradation kinetics of cows grazing temperate pastures and supplemented with different sources of grain. Animal Research 55: 511-520.
Chaves, A.V.; Burke, J.L.; Waghorn, G.C.; Brookes, I.M. 2006a. Digestion kinetics of leaf, stem and infl orescence from fi ve: species of mature grasses. Journal of the Science of Food and Agriculture 86: 816-825.
Chaves, A.V.; Waghorn, G.C.; Brookes, I.M.; Woodfi eld, D.R. 2006b. Effect of maturation and initial harvest dates on the nutritive characteristics of ryegrass (Lolium perenne L.). Animal Feed Science and Technology 127: 293-318.
Cherney, D.J.R.; Cherney, J.H.; Lucey, R.F. 1993. In vitro digestion kinetics and quality of perennial grasses as infl uenced by forage maturity. Journal of Dairy Science 76: 790-797.
Dohme, F.; Graf, C.M.; Arrigo, Y.; Wyss, U.; Kreuzer, M. 2007. Effect of botanical characteristics, growth stage and method of conservation on factors related to the physical structure of forage: an attempt towards a better understanding of the effectiveness of fi bre in ruminants. Animal Feed Science and Technology 138: 205-227.
Dulphy, J.P.; Demarquilly, C.; Baumont, R.; Jailler, M.; L'Hotelier, L.; Dragomir, C. 1999. Study of modes of preparation of fresh and conserved forage samples for measurement of their dry matter and nitrogen degradations in the rumen. Annales de Zootechnie 48: 275-288.
Ferri, C.M.; Stritzler, N.P.; Pagella, J.H. 2004. Nitrogen fertilization on rye pasture: effect on forage chemical composition, voluntary intake, digestibility and rumen degradation. Journal of Agronomy and Crop Science 190: 347-354.
Flachowsky, G.; Lebzien, P. 2006. Possibilities for reduction of Nitrogen (N) excretion from ruminants and the need for further research: a review. Landbauforschung Volkenrode 56: 19-30.
Flores, R.; Coblentz, W.K.; Ogden, R.K.; Coffey, K.P.; Looper, M.L.; West, C.P.; Rosenkrans, C.F. 2008. Effects of fescue type and sampling date on the nitrogen disappearance kinetics of autumn-stockpiled tall fescue. Journal of Dairy Science 91: 1597-1606.
Fulkerson, W.J.; Neal, J.S.; Clark, C.F.; Horadagoda, A.; Nandra, K.S.; Barchia, I. 2007. Nutritive value of forage species grown in the warm temperate climate of Australia for dairy cows: grasses and legumes. Livestock Science 107: 253-264.
Grime, J.P.; Hodgson, J.G.; Hunt, R. 1989. Comparative Plant Ecology: A Functional Approach to Common British Species. Unwin Hyman, London, UK.
Groot, J.C.J.; Neuteboom, J.H.; Deinum, B. 1999. Composition and digestibility during ageing of consecutive leaves on the main stem of Italian ryegrass plants, growing undisturbed or regrowing after cutting. Journal of the Science of Food and Agriculture 79: 1691-1697.
Hackmann, T.J.; Sampson, J.D.; Spain, J.N. 2010. Variability in in situ ruminal degradation parameters causes imprecision in estimated ruminal digestibility. Journal of Dairy Science 93: 1074-1085.
Hoffman, P.C.; Sievert, S.J.; Shaver, R.D.; Welch, D.A.; Combs, D.K. 1993. In situ dry-matter, protein and fi ber degradation of perennial forages. Journal of Dairy Science 76: 2632-2643. Kasuya, N.; Xu, Q.; Kobayashi, Y.; Fukuda, K.; Enishi, O.;
Iiyama, K.; Itabashi, H. 2008. Cell wall degradation of tropical and temperate forage grasses measured by nylon bag and in vitro digestion techniques. Animal Science Journal 79: 200-209.
Kolver, E.S.; Muller, L.D. 1998. Performance and nutrient intake of high producing Holstein cows consuming pasture or a total mixed ration. Journal of Dairy Science 81: 1403-1411.
Le Goffe, P.; Verité, R.; Peyraud, J.L. 1993. Infl uence de l’espèce et de la saison sur la dégradabilité de l’azote des fourrages verts dans le rumen = Infl uence of herbage species and harvest season on the rumen degradability of fresh forage nitrogen. Annales de Zootechnie 42: 3-15 (in French, with abstract in English).
Ledgard, S.F. 2001. Nitrogen cycling in low input legume-based agriculture, with emphasis on legume/grass pastures. Plant and Soil 228: 43-59.
Licitra, G.; Hernandez, T.M.; Van Soest, P.J. 1996. Standardization of procedures for nitrogen fractionation of ruminant feeds. Animal Feed Science and Technology 57: 347-358.
Martineau, R.; Lapierre, H.; Ouellet, D.R.; Pellerin, D.; Berthiaume, R. 2006. In situ degradation of timothy conserved as restrictively or extensively fermented silage or as hay. Canadian Journal of Animal Science 86: 299-306.
McDonald, I. 1981. A revised model for the estimation of protein degradability in the rumen. Journal of Agricultural Science 96: 251-252.
Ministry of Agriculture, Fisheries and Food [MAFF]. 1985. The Analysis of Agricultural Materials. 3ed. Agriculture Development and Advisory Service, London, UK.
Moharrery, A.; Hvelplund, T.; Weisbjerg, M.R. 2009. Effect of forage type, harvesting time and exogenous enzyme application on degradation characteristics measured using in vitro technique. Animal Feed Science and Technology 153: 178-192. National Research Council [NRC]. 2001. Nutrient Requirements
of Dairy Cattle. 7ed. USDA, Washington, DC, USA.
Niderkorn, V.; Baumont, R. 2009. Associative effects between forages on feed intake and digestion in ruminants. Animal 3: 951-960.
Nie, Z.N.; Chapman, D.F.; Tharmaraj, J.; Clements, R. 2004. Effects of pasture species mixture, management, and environment on the productivity and persistence of dairy pastures in south-west Victoria. 1. Herbage accumulation and seasonal growth pattern. Australian Journal of Agricultural Research 55: 625-636.
Ørskov, E.R.; McDonald, I. 1979. The estimation of protein degradability in the rumen from incubation measurements weighted according to rate of passage. Journal of Agricultural Science 92: 499-503.
Salaun, C.; van Straalen, W.M.; Kogut, J.; Peyraud, J.L.; van Vuuren, A.M. 1999. In situ degradation of perennial rye grass from grazed pastures during the season at two levels of nitrogen fertilization. Annales de Zootechnie 48: 35-46.
Steg, A.; Van Straalen, W.M.; Hindle, V.A.; Wensink, W.A.; Dooper, F.M.H.; Schils, R.L.M. 1994. Rumen degradation and intestinal digestion of grass and clover at two maturity levels during the season in dairy cows. Grass and Forage Science 49: 378-390.
Sun, X.Z.; Waghorn, G.C.; Clark, H. 2010. Cultivar and age of regrowth effects on physical, chemical and in sacco degradation kinetics of vegetative perennial ryegrass (Lolium perenne L.). Animal Feed Science and Technology 155: 172-185.
Sun, X.Z.; Waghorn, G.C.; Hatier, J.H.B.; Easton, H.S. 2012. Genotypic variation in in sacco dry matter degradation kinetics in perennial ryegrass (Lolium perenne L.). Animal Production Science 52: 566-571.
Tilley, J.M.; Terry, R.A. 1963. A two stage technique for the in vitro digestion of forage crops. Journal of the British Grassland Society 18: 104-111.
Trujillo, A.I.; Marichal, M.D.; Carriquiry, M. 2010. Comparison of dry matter and neutral detergent fi bre degradation of fi brous feedstuffs as determined with in situ and in vitro gravimetric procedures. Animal Feed Science and Technology 161: 49-57.
Turner, L.R.; Donaghy, D.J.; Lane, P.A.; Rawnsley, R.P. 2007. A comparison of the establishment, productivity, and feed quality of four cocksfoot (Dactylis glomerata L.) and four brome (Bromus spp.) cultivars, under leaf stage based defoliation management. Australian Journal of Agricultural Research 58: 900-906. Uden, P. 2006. In vitro studies on microbial effi ciency from two
cuts of ryegrass (Lolium perenne, cv. Aberdart) with different proportions of sugars and protein. Animal Feed Science and Technology 126: 145-156.
Valderrama, X.; Anrique, R. 2011. In situ rumen degradation kinetics of high-protein forages in temperate climate. Chilean Journal of Agricultural Research 71: 572-577.
Van Soest, P.J.; Robertson, J.B.; Lewis, B.A. 1991. Methods for dietary fi bre, neutral detergent fi bre and non-starch polysaccharides in relation to animal nutrition. Journal of Dairy Science 74: 3583-3597.