1 Universidade Regional Integrada do Alto Uruguai e das Missões, Laboratório de Sistemática e Ecologia Vegetal, Departamento de Ciências Biológicas,
Erechim, RS, Brazil
2 Author for correspondence: [email protected]
Spatial distribution, association patterns and richness of tree species
in a seasonal forest from the Serra Geral formation, southern Brazil
RESUMO
(Distribuição, associação espacial e riqueza de espécies arbóreas em uma fl oresta decídua da formação Serra Geral, sul do Brasil). Este estudo objetivou determinar a distribuição espacial das espécies arbóreas mais abundantes num remanescente fl orestal e avaliar relações que possam ser responsáveis por estas distribuições, bem como comparar a riqueza específi ca esperada ao longo da formação Serra Geral no estado do Rio Grande do Sul, Brasil. Uma parcela de 1 hectare, subdividida em 100 unidades amostrais contíguas foi instalada e todos os indivíduos com pelo menos 4,8 cm de diâmetro à altura do peito foram medidos e identifi cados. Cada unidade amostral recebeu uma descrição de sua posição espacial por meio de coordenadas (x,y) para quantifi car o padrão espacial e posteriormente aplicar um índice de associação para as espécies amostradas. A riqueza específi ca foi comparada a outros levantamentos realizados na região da encosta da Serra Geral do estado do Rio Grande do Sul por meio de rarefação. Foram amostrados 1.063 indivíduos distribuídos em 69 espécies e 33 famílias. A diversidade especifi ca foi de 3,35 nats (equitatividade Pielou - J’ = 0,79) e a maioria das espécies apresentou distribuição agregada. Padrões de associação e dissociação foram encon-trados entre as espécies, demonstrando diferentes grupos fl orestais. Foi observado que existe um decréscimo de espécies Atlânticas no sentido leste para oeste na formação Serra Geral, sendo substituídas por espécies da fl oresta estacional.
Palavras-chave: Rarefação; métricas de diversidade; associação espacial; agregação
Rafael Barbizan Sühs1,2 and Jean Carlos Budke1
ABSTRACT
(Spatial distribution and association patterns of tree species in a seasonal forest from the Serra Geral formation, southern Brazil). Th is study aimed to determine the spatial distribution of the most abundant tree species, to look for relationships that may be responsible for their distribution and to compare the expected richness along the Serra Geral formation in the state of Rio Grande do Sul , Brazil. An one-hectare plot was divided in 100 contiguous 10 x 10 m sampling units and all individuals with at least 4.8 cm diameter at breast high were measured and identifi ed. Each sampling unit received a description of the spatial position through metric coordinates (x,y) in order to quantify the spatial pattern. Later, an association index among species was applied. Th e observed richness was rarefi ed and compared to other surveys located on the slopes of Serra Geral in Rio Grande do Sul. We surveyed 1,063 individuals belonging to 69 species and 33 families, and the Shannon’s diversity index showed a diversity of 3.35 nats (Pielou’s species evenness - J’ = 0.79). Most species showed an aggregated distribution. Both association and dissociation pat-terns occurred among species leading to distinct forest patches. Th e rarefaction results showed a decrease of Atlantic species, which were replaced by typical seasonal forest species, when analyzing fl oristic contingents towards the west.
Key words: Rarefaction; diversity metrics; spatial association; aggregation Recebido em 22/11/2010. Aceito em 15/06/2011
Introduction
In nature, organisms frequently show an aggregated distribution, forming patches, gradients or other types of spatial patterns (Legendre & Fortin 1989; Dale et al. 2002). Th e analysis of such patterns is a relevant statistical tool in the area of forest dynamics (Pélissier 1998; Franklin & Rey 2007), which helps in understanding species ecology and providing
information for its management and conservation (Perry et al. 2002; Bell et al. 2010). In Brazil, studies about spatial dis-tribution of plants were scarce in the last decade (Nascimento et al. 2002) but have started to increase in recent years (e.g. Anjos et al. 2004; Lindenmaier & Budke 2006; Giehl et al. 2007; Paludo et al. 2009; Higuchi et al. 2010; Rode et al. 2010).
models have been created for the analysis of spatial patterns. In this sense, Dale et al. (2002) and Perry et al. (2002) de-scribed concepts and provided a broad framework for mak-ing decisions on analytical approaches and interpretations of spatial patterns. Among these methods, the Spatial Analysis by Distance Indices or SADIE, proposed by Perry (1995), has been successfully used in recent studies (Ferguson et al. 2000; Winder et al. 2001; Xu & Madden 2004; Lindenmaier & Budke 2006; Giehl et al. 2007; Rechenmacher et al. 2007), and has been useful in describing and quantifying spatial patterns (Xu 2003).
Based on the spatial pattern provided by SADIE, Perry & Dixon (2002) created a new method of association analysis. By identifying the spatial heterogeneity as a patch or a gap, this method is more effi cient in detecting associations than a simple correlation co-effi cient (Donovan et al. 2007; Bell et al. 2010). Th rough the analysis of spatial pattern and as-sociation, Donovan et al. (2007) emphasized the importance of termites in a tropical forest in Malaysia. Bell et al. (2010) built co-occurrence networks based on statistical analysis of the SADIE method, providing valuable information on the area of biological control in the United Kingdom. Gabriel et al. (2007), using SADIE’s method, verifi ed that the young individuals of Cupania vernalis Cambess. do not follow the distribution of adults in a forest remnant in southern Brazil. Th e state of Rio Grande do Sul (southern Brazil) has, beyond areas of sandbanks and pioneer formations, humid and seasonal forests (Teixeira et al. 1986). Nowadays the best preserved areas are located on the slopes, along the Serra Geral and Serra do Sudeste formations, mainly in inaccessible areas (Jarenkow & Waechter 2001; Jurinitz & Jarenkow 2003).
Th e main entrance corridors of tropical species in this state occur in the east, through the Atlantic Corridor, and in the west, across the basins of the Paraná and Uruguay rivers (Rambo 1956; 1961). Species interpenetration occurs on the hillside areas of Serra Geral (Jarenkow & Waechter 2001). Rambo (1956; 1960) mentioned that as species move, from east to west, across the Serra Geral, there is a reduction trend in species richness, which is higher in Atlantic Forest stricto sensu and gradually becomes lower towards the seasonal forest. However, little has been discussed about this in recent years. Regardless of several structural studies about plant communities of the Serra Geral formation(Jarenkow 1994; Longhi et al. 1999; Longhi et al. 2000; Jarenkow & Waechter 2001; Lindenmaier & Budke 2006; Giehl et al. 2007; Sühs et al. 2010), the lack of standardized data, which occurs in most descriptive studies of terrestrial plant communities conducted in Brazil, makes it harder to compare their results (Sonego et al. 2007; Giehl & Budke 2011).
Th is study aimed to determine the spatial distribution of the most abundant tree species from a seasonal forest remnant in the central region of Rio Grande do Sul, Brazil, and to look for relationships that may be responsible for their distribution. Likewise, the horizontal structure,
di-versity and changes in species richness along the slopes of the Serra Geral region were also evaluated. In this sense, we tried to answer the following questions: i) how is the spatial pattern of the most abundant species sampled? ii) is there an association between the spatial distribution of these species? iii) is there reduction in the species richness, from east to west, along the Serra Geral formation?
Materials and methods
Study area
Th e study was conducted at Sinimbu, in the central region of Rio Grande do Sul State, Brazil, in a Private Re-serve of Natural Heritage which belongs to the University of Santa Cruz do Sul. Th is reserve was offi cially created in 2009 (Brasil 2009) and has an area of 221.39 ha. Sühs et al. (2010) found 160 tree species in this area and observed that 12 are at risk of extinction. On the other hand, the same authors also found 11 exotic species and emphasized that these species must be controlled, especially the invasive ones.
According to Maluf (2000), the regional climate belongs to type STSBv, (subtropical, sub humid, with dry periods in summer). Th e average annual temperature is 19.3 ºC and average annual rainfall is 1,547 mm, recorded in Santa Cruz do Sul, the nearest station (data supplied by the Laboratory of Meteorology, University of Santa Cruz do Sul). Th e local soils belong to an association of Ciríaco and Charrua map-ping units (Streck et al. 2002).
Data collection
A plot of 1 hectare (100 x 100 m) was set in the reserve do-main and divided in 100 contiguous 10 x 10 m sampling units (central point near coordinates 29º23’22’’S – 52º32’00’’W at 500 m.s.l. - map available in Sühs et al. (2010). Th e plot was set on a slope, because it had better forest, where we observed the presence of two non-rectilinear gullies along the sampling area. All individuals with diameter at breast height > 4.8 cm were measured and identifi ed. Voucher specimens were deposited in the HCB Herbarium at the University of Santa Cruz do Sul. Specimens were identifi ed through literature and by comparison with vouchers from the HCB Herbarium. Th e classifi cation of families of angiosperms was defi ned accord-ing to the Angiosperm Phylogeny Group (APGIII 2009) while Smith et al. (2006) was used to classify tree-like ferns. Th e nomenclature of species was based on Forzza et al. (2010).
and “shade tolerant” for those who tolerate some degree of shade (Budke et al. 2008). Th e species were divided into three height groups: small (average height < 8 m); medium (average height ≥ 8 m < 12 m) and tall (average height ≥ 12 m). Estimated height values were given in Sühs et al. (2010).
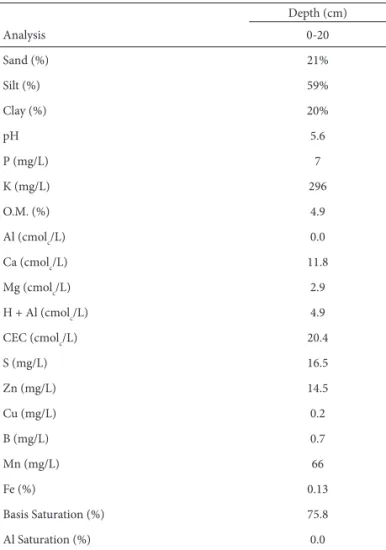
Twelve samples of topsoil (0-20 cm depth) were ran-domly collected in the area and formed a single composite sample that was taken for chemical and texture analysis. Th e results were interpreted according to Comissão de Química e Fertilidade do Solo – RS/SC (2004).
Data analysis
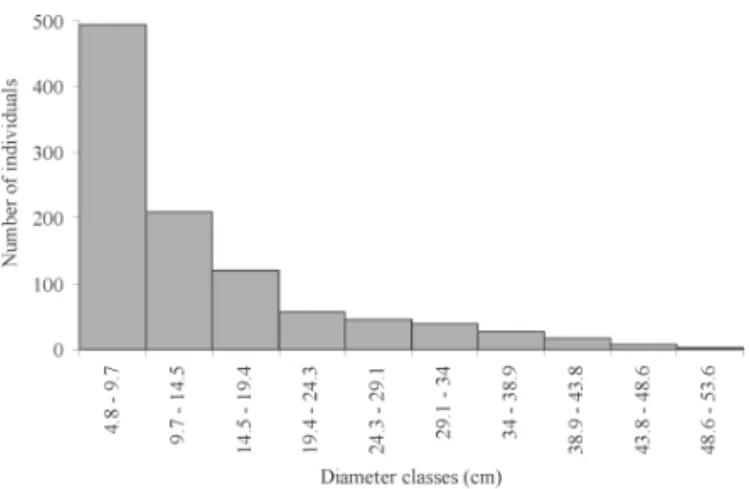
For each species, the phytosociological parameters of density, frequency and dominance (derived from tree basal area) (Mueller-Dombois & Ellenberg 1974) were calculated to describe the tree community structure. A histogram was constructed (class interval determined statistically at 4.8 cm) to express the diameter classes of individuals.
In order to answer the fi rst question of our study, we applied the SADIE methodology to evaluate the spatial pat-terns of species (Perry 1995). Each sampling unit received a description of the spatial position through metric coordi-nates (x,y), mapped from an initial established point. Species showing more than 20 ind·ha-1 had their spatial distribution analyzed through the index of aggregation – Ia (Perry 1995). Values of Ia > 1 indicates aggregation (patches), Ia < 1 indicates regularity and Ia = 1 suggests randomness (Perry et al. 1996; Perry 1998). Negative values of aggregation indicates that a species-i does not occur in that position (gaps), providing further details on pattern analysis (Perry et al. 1999).
According to Perry (1998), the spatial pattern in a sampled population is quantifi ed by SADIE by measuring the total eff ort (in terms of distance moved), which the in-dividuals in the observed sample must expend to move to extreme arrangements, in order to keep individuals either at uniformly (regularly) or aggregated (patchy) intervals. By comparing counts of the observed spatial pattern with ran-dom needed rearrangements, the degree of non-ranran-domness within a set of data can be quantifi ed (Perry 1998). Once the sampling-unit counts are the same for each randomization, the original heterogeneity of the sampled data is preserved (Xu 2003). Finally, distribution maps were produced using the kriging technique from the index values generated for each cluster plot, in which the aggregation index of each species was interpolated along the sampling area. Th ese analyses were performed with the SADIEshell program (Perry et al. 1996; Conrad et al. 2006).
We used SADIES’s association index (Perry & Dixon 2002) to assess the spatial association of all sampled indi-viduals, species richness and among most abundant species in order to answer the second question of this study. Th is spatial association refers to the similarity between the spatial patterns of two data sets, and it was equivalent to a spatially explicit correlation coeffi cient that tests the level of associa-tion between two populaassocia-tions (Bell et al. 2010). According
to Perry & Dixon (2002), a positive association is expected when the spatial distributions of two species join both in patches and gaps. In addition, if the spatial distribution of patches and gaps do not coincide, a spatial dissociation is expected. Th e spatial associations were undertaken with the SADIEshell program (Perry et al. 1996; Conrad et al. 2006).
Rarefaction curves from the number of sampled in-dividuals (Koellner et al. 2004) were created to compare species richness to other studies developed on the slopes of the Serra Geral region in Rio Grande do Sul, Brazil. By this methodology, the expected richness can be estimated in a random previously determined individual sample (Waite 2000). Following this, the results of other studies carried out in the slopes of the Serra Geral formation, in Rio Grande do Sul, were adapted for the construction of the rarefaction curves. In this way, a matrix of species abundance was built and, based on Forzza et al. (2010), the species names were updated and their synonymy was verifi ed. Th e survey show-ing the lowest number of individuals was set as the basis for the comparison. Some studies were not included due to a low sampling eff ort or by omitting the names of species or group-ing, which could weaken the comparison. Neophytes were excluded from this analysis but non-identifi ed taxa or taxa identifi ed at the level of family or genus were kept. Alpha (α) diversity was calculated through Shannon’s diversity index with Pielou’s evenness index (neophytes were excluded). Rarefaction and diversity analysis were performed within the PAST package (Hammer et al. 2001).
Spearman correlation coeffi cient (rs) was used to verify whether there was a reduction of species richness from east to west along Serra Geral formation. In order to answer the third question of this study we further partitioned the amount of species from each fl oristic contingent (western seasonal and eastern wet). Correlation analyses were per-formed with JMP® soft ware (Version 9. SAS Institute Inc., Cary, NC, 1989-2007).
Results
Soil
Th e soil samples showed high proportion of silt and low proportions of clay and sand, leading to a soil class “four”, which group soils with medium content of organic matter, base saturation and pH. Th e cation exchange capacity (CEC) was considered high, in the same way as Calcium (Ca), Magnesium (Mg) and Sulfur (S). Zinc (Zn), Boron (B) and Manganese (Mn) levels were considered high, while copper (Cu) was considered medium. Th e Aluminum (Al) saturation was null and base saturation had a high rate (Tab. 1).
Structure
Nectandra megapotamica, with 106 (10.3%), Sorocea bonplan-dii, with 94 (9.2%), Alchornea triplinervia, with 72 (7.0%), Cupania vernalis, with 67 (6.5%) and Allophylus edulis, with 51 (5.0%). Together these species totaled 50.4% of surveyed individuals (Tab. 2). With respect to absolute frequency, a small number (13%) of the sampled species occupied higher values of frequency classes (between 20% and 60%), while 87% of sampled species had frequency classes between 0% and 20%. Nectandra megapotamica was the most frequent (AF = 59%). Regarding dominance, the overall basal area was 24.10 m²·ha-1, where the highest values were recorded for N. megapotamica, which had 9.04 m²·ha-1, A. triplinervia with 2.82 m²·ha-1 and Tetrorchidium rubrivenium with 2.12 m²·ha-1. Together these species account for 58% of the total value of dominance. Nectandra megapotamica held 37.5% of the total basal area, with several large sized individuals (height and diameter values above average). Casearia sylvestris and Sorocea bonplandii had high values of density and frequency and low values of dominance because they showed several well distributed small trees. On the other hand, Tetrorchid-ium rubrivenTetrorchid-ium and Ocotea puberula had higher values of dominance with lower values of frequency and density. Concerning the diameter, 50% of sampled individuals had diameters between 4.8 and 9.7 cm (Fig. 1).
Table 1. Physical and chemical parameters obtained with soil samples collected in a seasonal forest in central region of Rio Grande do Sul state, Brazil.
Depth (cm)
Analysis 0-20
Sand (%) 21%
Silt (%) 59%
Clay (%) 20%
pH 5.6
P (mg/L) 7
K (mg/L) 296
O.M. (%) 4.9
Al (cmolc/L) 0.0
Ca (cmolc/L) 11.8
Mg (cmolc/L) 2.9
H + Al (cmolc/L) 4.9
CEC (cmolc/L) 20.4
S (mg/L) 16.5
Zn (mg/L) 14.5
Cu (mg/L) 0.2
B (mg/L) 0.7
Mn (mg/L) 66
Fe (%) 0.13
Basis Saturation (%) 75.8
Al Saturation (%) 0.0
Spatial distribution and association patterns
Twelve species showed absolute density higher than 20 individuals.ha-1 and had their spatial pattern analyzed (Fig. 2 and 3). All of them were aggregated (Ia > 1), except Myrsine guianensis and Trichilia claussenii. Alchornea triplinervia, Cupania vernalis, Cabralea canjerana, Myrsine umbellata, Tetrorchidium rubrivenium and Diospyros inconstans had signifi cant aggregation values (Tab. 4).
Th e spatial distributions of Alchornea triplinervia and Diospyros inconstans were signifi cantly associated to the spatial distribution of species richness per sampling unit or, as the case of Cupania vernalis, showed a dissociated pattern between overall species richness and plant species abundance (Tab. 4). Th e spatial distributions of Casearia sylvestris, Alchornea trip-linervia, Allophylus edulis, Myrsine umbellata and Tetrorchidium rubrivenium were signifi cantly associated with the overall number of individuals (Tab. 4). Furthermore, we verifi ed that some species were signifi cantly associated (p < 0.025) with each other. On this way, regardless of their abundance, the spatial patterns (distribution) are similar both in areas of patches (high abundance) and in areas of gaps (low abundance). At the same time, some species showed signifi cant dissociation (p > 0.975) with each other, indicating that the spatial patterns in both areas (patches and gaps) did not match. According to this, Tab. 5 shows the signifi cant dissociation between Alchornea triplin-ervia and Cupania vernalis and, as expected, their associations with other species, which were frequently dissimilar; Diospyros inconstans showed signifi cant association with A. triplinervia and signifi cant dissociation with C. vernalis, while Myrsine guianensis showed signifi cant association with A. triplinervia and a dissociation trend with C. vernalis. Th e same occurred between Sorocea bonplandii and Allophylus edulis. Both of these species showed a tendency to be dissociated with each other but S. bonplandii showed a trend to be associated to Cabralea can-jerana, which also showed a dissociation trend with A. edulis. Finally, we observed that Casearia sylvestris was signifi cantly associated to A. edulis and showed a trend to be dissociated to C. canjerana. Only C. vernalis did not show associations with any other species.
Alpha Diversity and Species Richness
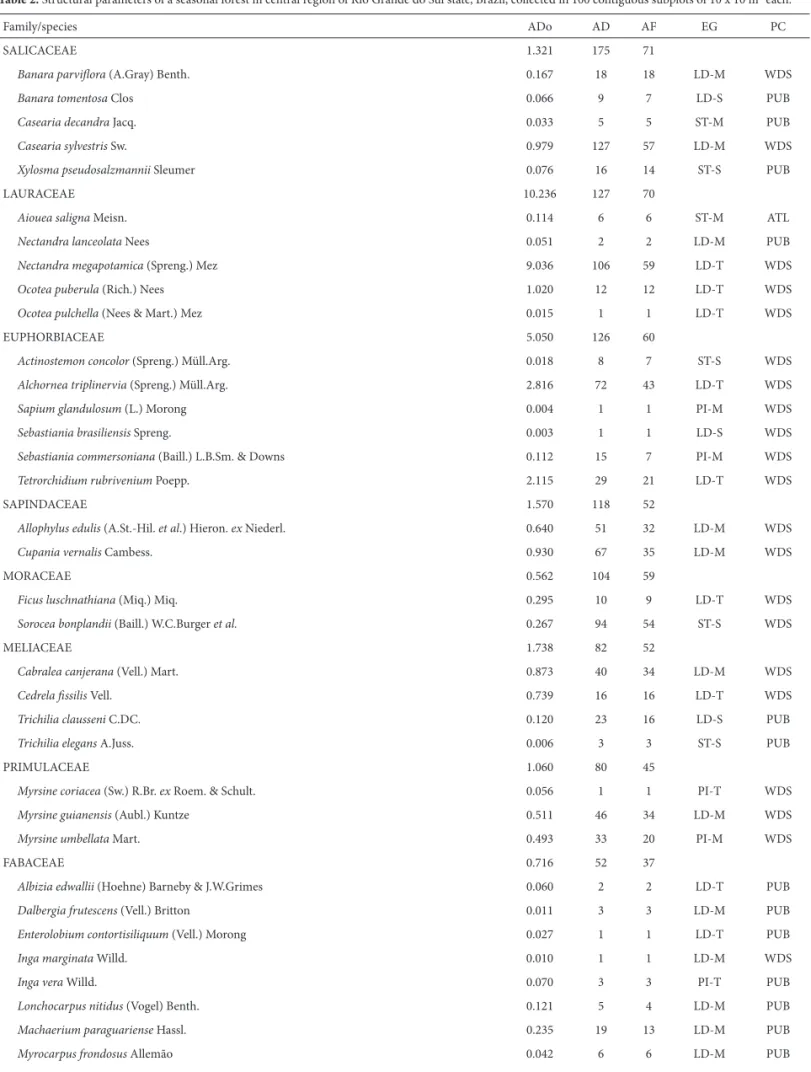
Table 2. Structural parameters of a seasonal forest in central region of Rio Grande do Sul state, Brazil, collected in 100 contiguous subplots of 10 x 10 m² each.
Family/species ADo AD AF EG PC
SALICACEAE 1.321 175 71
Banara parvifl ora (A.Gray) Benth. 0.167 18 18 LD-M WDS
Banara tomentosa Clos 0.066 9 7 LD-S PUB
Casearia decandra Jacq. 0.033 5 5 ST-M PUB
Casearia sylvestris Sw. 0.979 127 57 LD-M WDS
Xylosma pseudosalzmannii Sleumer 0.076 16 14 ST-S PUB
LAURACEAE 10.236 127 70
Aiouea saligna Meisn. 0.114 6 6 ST-M ATL
Nectandra lanceolata Nees 0.051 2 2 LD-M PUB
Nectandra megapotamica (Spreng.) Mez 9.036 106 59 LD-T WDS
Ocotea puberula (Rich.) Nees 1.020 12 12 LD-T WDS
Ocotea pulchella (Nees & Mart.) Mez 0.015 1 1 LD-T WDS
EUPHORBIACEAE 5.050 126 60
Actinostemon concolor (Spreng.) Müll.Arg. 0.018 8 7 ST-S WDS
Alchornea triplinervia (Spreng.) Müll.Arg. 2.816 72 43 LD-T WDS
Sapium glandulosum (L.) Morong 0.004 1 1 PI-M WDS
Sebastiania brasiliensis Spreng. 0.003 1 1 LD-S WDS
Sebastiania commersoniana (Baill.) L.B.Sm. & Downs 0.112 15 7 PI-M WDS
Tetrorchidium rubrivenium Poepp. 2.115 29 21 LD-T WDS
SAPINDACEAE 1.570 118 52
Allophylus edulis (A.St.-Hil. et al.) Hieron. ex Niederl. 0.640 51 32 LD-M WDS
Cupania vernalis Cambess. 0.930 67 35 LD-M WDS
MORACEAE 0.562 104 59
Ficus luschnathiana (Miq.) Miq. 0.295 10 9 LD-T WDS
Sorocea bonplandii (Baill.) W.C.Burger et al. 0.267 94 54 ST-S WDS
MELIACEAE 1.738 82 52
Cabralea canjerana (Vell.) Mart. 0.873 40 34 LD-M WDS
Cedrela fi ssilis Vell. 0.739 16 16 LD-T WDS
Trichilia clausseni C.DC. 0.120 23 16 LD-S PUB
Trichilia elegans A.Juss. 0.006 3 3 ST-S PUB
PRIMULACEAE 1.060 80 45
Myrsine coriacea (Sw.) R.Br. ex Roem. & Schult. 0.056 1 1 PI-T WDS
Myrsine guianensis (Aubl.) Kuntze 0.511 46 34 LD-M WDS
Myrsine umbellata Mart. 0.493 33 20 PI-M WDS
FABACEAE 0.716 52 37
Albizia edwallii (Hoehne) Barneby & J.W.Grimes 0.060 2 2 LD-T PUB
Dalbergia frutescens (Vell.) Britton 0.011 3 3 LD-M PUB
Enterolobium contortisiliquum (Vell.) Morong 0.027 1 1 LD-T PUB
Inga marginata Willd. 0.010 1 1 LD-M WDS
Inga vera Willd. 0.070 3 3 PI-T PUB
Lonchocarpus nitidus (Vogel) Benth. 0.121 5 4 LD-M PUB
Machaerium paraguariense Hassl. 0.235 19 13 LD-M PUB
Myrocarpus frondosus Allemão 0.042 6 6 LD-M PUB
Parapiptadenia rigida (Benth.) Brenan 0.141 12 10 LD-M PUB
Family/species ADo AD AF EG PC
EBENACEAE 0.148 21 16
Diospyros inconstans Jacq. 0.148 21 16 LD-S PUB
MONIMIACEAE 0.099 20 17
Hennecartia omphalandra J.Poiss. 0.056 5 5 ST-S PUB
Mollinedia schottiana (Spreng.) Perkins 0.043 15 12 ST-S ATL
CUNONIACEAE 0.431 14 11
Lamanonia ternata Vell. 0.431 14 11 LD-M WDS
MELASTOMATACEAE 0.110 14 13
Miconia pusillifl ora (DC.) Naudin 0.110 14 13 LD-M WDS
SAPOTACEAE 0.111 13 10
Chrysophyllum gonocarpum (Mart. & Eichler ex Miq.) Engl. 0.040 3 3 ST-M PUB
Chrysophyllum marginatum (Hook. & Arn.) Radlk. 0.071 10 8 LD-M PUB
RUTACEAE 0.069 11 10
Citrus X limon (L.) Osbeck 0.003 1 1 U-S EXT
Zanthoxylum caribaeum Lam. 0.067 10 10 LD-S WDS
BORAGINACEAE 0.080 11 9
Cordia americana (L.) Gottschling & J.S.Mill. 0.003 1 1 LD-S PUB
Cordia ecalyculata Vell. 0.011 3 3 ST-S PUB
Cordia trichotoma (Vell.) Arráb. ex Steud. 0.066 7 7 LD-M WDS
MALVACEAE 0.102 9 8
Luehea divaricata Mart. & Zucc. 0.102 9 8 PI-M WDS
MYRTACEAE 0.032 6 6
Eugenia involucrata DC. 0.006 2 2 ST-S PUB
Eugenia rostrifolia D.Legrand 0.021 2 2 ST-S PUB
Eugenia unifl ora L. 0.005 2 2 LD-S WDS
CYATHEACEAE 0.027 6 1
Alsophila setosa Kaulf. 0.027 6 1 ST-S WDS
ANNONACEAE 0.025 5 5
Annona sylvatica A.St.-Hil. 0.025 5 5 LD-S WDS
NYCTAGINACEAE 0.085 5 5
Pisonia ambigua Heimerl 0.085 5 5 LD-M WDS
SIMAROUBACEAE 0.084 5 3
Picrasma crenata (Vell.) Engl. 0.084 5 3 LD-M PUB
LAMIACEAE 0.023 3 2
Vitex megapotamica (Spreng.) Moldenke 0.023 3 2 LD-M WDS
RUBIACEAE 0.012 3 3
Coutarea hexandra (Jacq.) K.Schum. 0.009 2 2 ST-M PUB
Randia armata (Sw.) DC. 0.002 1 1 ST-S WDS
ANACARDIACEAE 0.079 2 2
Lithrea brasiliensis Marchand 0.079 2 2 LD-M PUB
PROTEACEAE 0.013 2 2
Roupala montana var. brasiliensis (Klotzsch) K.S.Edwards 0.013 2 2 ST-M ARA
RHAMNACEAE 0.074 2 2
Hovenia dulcis Th unb. 0.074 2 2 PI-M EXT
Table 2. Continuation.
Table 2. Continuation.
Family/species ADo AD AF EG PC
URTICACEAE 0.011 2 1
Urera baccifera (L.) Gaudich. ex Wedd. 0.011 2 1 LD-S PUB
ARALIACEAE 0.068 1 1
Scheffl era morototoni (Aubl.) Maguire et al. 0.068 1 1 LD-T PUB
BIGNONIACEAE 0.022 1 1
Tecoma stans (L.) Juss. ex Kunth 0.022 1 1 PI-M EXT
CANNABACEAE 0.006 1 1
Trema micrantha (L.) Blume 0.006 1 1 PI-S WDS
CARICACEAE 0.028 1 1
Vasconcellea quercifolia A.St.-Hil. 0.028 1 1 LD-M WDS
ROSACEAE 0.070 1 1
Prunus myrtifolia (L.) Urb. 0.070 1 1 LD-T WDS
SOLANACEAE 0.017 1 1
Cestrum intermedium Sendtn. 0.017 1 1 LD-M PUB
ADo = absolute dominance (m².ha-1); AD = absolute density (ind.ha-1); AF = absolute frequency (%); EG = ecological groups; T = tall; M = medium; S = small; LD = light-demanding; ST = shade-tolerant; PI = pioneer; U = undetermined; PC = phytogeographic characteristics; WDS = widely distributed species; PUB = species from basins of Paraná and Uruguay rivers; ATL = Atlantic contingent species; EXT = exotic species; ARA = species from Araucária forest; Table ranked in absolute density per family.
Figure 1. Distribution of tree individuals by diameter class (class interval of 4.8 cm), obtained in a survey in a seasonal forest in the central region of Rio Grande do Sul State, Brazil.
species for the western seasonal species (rs = 0.80; p = 0.10) from east to west and a trend of decreasing for the eastern wet species (rs = -0.90; p = 0.03) in the same direction. Th ere was no correlation between eastern wet and western seasonal (rs = -0.60; p = 0.28).
Discussion
50% of the sampled individuals had a diameter between 4.8 and 9.7 cm (Fig. 1). Th is result highlights the importance of the understory and regenerating individuals in the com-munity, while, if we had adopted a higher inclusion criterion
(e.g. 10 cm DBH, as used in some studies in tropical and subtropical forests), we would have found only middle and upper layers and half of the surveyed individuals.
Spatial distribution and association patterns – Th ree spe-cies that showed aggregation in the present study also had aggregation in the study of Lindenmaier & Budke (2006), located in Cachoeira do Sul, Rio Grande do Sul, in a riverine forest. Although they used a higher inclusion criterion, Ca-searia sylvestris, Sorocea bonplandii and Cabralea canjerana showed signifi cant values of aggregation in their survey, the latter had a signifi cant value of aggregation in our study. Th is could indicate that these species present aggregation not only due to local factors but also as a natural behavior.
Table 3. Data of surveys realized in the slope of Serra Geral formation, in Rio Grande do Sul state, Brazil, aft er the adaptation procedure (revision of synonyms, exclusion of neophytes), ordered from east to west.
Local n area S R1020 s A sp B sp E sp H’ J’
Morrinhos do Sul, RS 1 2822 1.00 112 92 3.14 22.04 5.06 11.5 3.66 0.77
Montenegro, RS 2 3514 1.83 78 66 2.36 4.93 3.77 13.0 3.06 0.70
Vale do Sol, RS 3 1855 1.00 55 48 2.15 5.49 13.7 10.9 2.24 0.56
Sinimbu, RS 4 1020 1.00 66 66 0.00 2.0 28.0 35.0 3.34 0.79
Santa Maria, RS 5 1427 1.00 58 55 1.45 0.79 18.5 22.1 3.07 0.75
n = number of individuals; area = survey area (hectare); S = species richness; A sp = number of species from Atlantic contingent; B sp = number of species from basins of Paraná and Uruguay rivers; E sp = number of widely distributed species; R1020 = species richness acquired with rarefaction curves for 1020 individuals (with standard deviation = s); H’ = Shannon’s diversity index; J’ = Pielou’s evenness index; 1 Jarenkow (1994); 2 Longhi et al. (2008); 3 Jarenkow & Waechter (2001); 4 Th is study; 5 Giehl et al. (2007).
Table 5. Probability values (p) obtained with association analysis between trees species with at least 20 individual surveyed in a seasonal forest in central region of Rio Grande do Sul, Brazil. Signifi cant association (+) occurs when p < 0.025 and signifi cant dissociation (-) when p > 0.975.
Dio_inc Tri_cla Tet_rub Myr_umb Cab_can Myr_gui All_edu Cup_ver Alc_tri Sor_bon Nec_meg
Cas_syl 0.1185 0.5497 0.6473 0.0901 0.9165 0.7495 0.0008+ 0.3421 0.0591 0.7008 0.8071
Nec_meg 0.9390 0.6773 0.1045 0.0311 0.8453 0.8749 0.4803 0.4358 0.0591 0.4521
Sor_bon 0.8582 0.1916 0.2284 0.8225 0.0507 0.0758 0.8808 0.4069 0.0331
Alc_tri 0.0014+ 0.4462 0.2294 0.1397 0.0606 0.0098+ 0.2379
0.9970-Cup_ver 0.9964- 0.7664 0.5698 0.5916 0.6232 0.8779 0.1982
All_edu 0.1758 0.7570 0.1435 0.0504 0.9402 0.6372
Myr_gui 0.1750 0.4053 0.0478 0.0937 0.0016+
Cab_can 0.1499 0.0415 0.4258 0.9534
Myr_umb 0.1720 0.9608 0.1891
Tet_rub 0.9274 0.9233
Tri_cla 0.6757
Table 4. Values obtained with index of aggregation and association for species with at least 20 individuals surveyed in a seasonal forest in central region of Rio Grande do Sul state, Brazil.
Espécie N I a Mvj Mvi Spi x Spp Spi x Nind
Casearia sylvestris 127 1.028 -1.036 1.051 0.0315 <0.0001 +
Nectandra megapotamica 106 1.050 -1.039 1.049 0.7736 0.1228
Sorocea bonplandii 94 1.109 -1.109 1.030 0.0497 0.1722
Alchornea triplinervia 72 1.676 *** -1.669 *** 1.373 ** <0.0001 + <0.0001 +
Cupania vernalis 67 1.490 *** -1.491 *** 1.251 * 0.9979 - 0.8083
Allophylus edulis 51 1.055 -1.055 0.983 0.0532 0.0032 +
Myrsine guianensis 46 0.952 -0.954 0.925 0.0886 0.0697
Cabralea canjerana 40 1.322 ** -1.322 ** 1.183 0.4245 0.5212
Myrsine umbellata 33 1.358 ** -1.355 ** 1.431 ** 0.0624 0.0176 +
Tetrorchidium rubrivenium 29 1.202 * -1.209 1.129 0.0701 0.0071 +
Trichilia claussenii 23 0.957 -0.954 0.992 0.0524 0.3865
Diospyros inconstans 21 1.404 ** -1.401 ** 1.258 * 0.0047 + 0.1076
*P<0.1; ** P <0.05; *** P <0.01; (+) = signifi cant association; (-) = signifi cant dissociation ; N = density (ind.ha-1); I
there is stand-specifi c competition between them (Goldberg & Barton 1992; Devictor et al. 2010) or it had existed at some moment; and IV) both species developed mechanisms to coexist among each other (e.g., creating microsites favorable for coexistence) or among other unknown factors (Christie & Armesto 2003; Silvertown 2004).
Alchornea triplinervia was associated with seven species (two signifi cant associations and 4 tendencies) and had only one dissociation (signifi cant). Th us, this species also had an association tendency with the spatial distribution of species richness per sampling unit, suggesting that this species oc-curs in areas with high heterogeneity. Th e question is why these interactions occur and whether this species itself is the cause of such heterogeneity. Th e association trends of Alchornea triplinervia with Myrsine umbellata and with Sorocea bonplandii can be emphasized. We can infer that aft er the last disturbance (e.g. canopy opening by the fall of a large tree), M. umbellata was one of the fi rst tree species which became established, due to its pioneer characteristic (Oliveira et al. 2005). Alchornea triplinervia, which is light-demanding (Rôças et al. 1997) and occupied the highest layer in the present survey, was probably benefi ted (I) and could establish itself. Finally, S. bonplandii, which is shade tolerant (Budke et al. 2008), could establish itself (I) in the shade provided by A. triplinervia and occupy the lowest layer. At the same time and corroborating this hypothesis, there was a dissociation trend between Myrsine umbellata and Sorocea bonplandii, since their preferences (e.g. regard-ing luminosity requirements) are diff erent.
Nectandra megapotamica tends to be associated with Alchornea triplinervia and Tetrorchidium rubrivenium. This three species are light-demanding (Vaccaro et al. 1999; Budke et al. 2008) and were large trees in the survey (so they occupied the same stratum). It is still not known if there is some type of facilitation between them (I) or if there is another factor that could benefi t them (II), but we can infer that maybe there was (or still there is) competi-tion between them (III) or these species have developed co-existing mechanisms (IV). Th e same can be inferred to the signifi cant associations that occurred between Casearia sylvestris with Allophylus edulis and Myrsine guianensis with Cabralea canjerana, for example. All of them are light-demanding species (Budke et al. 2008) and had an average size in the survey, occupying the same stratum.
Cupania vernalis had signifi cant dissociation with the spatial distribution of species richness per sampling unit and tends to be dissociated with the spatial distribution of the number of individuals per sampling unit. Neverthe-less, C. vernalis was the only species that did not have an association with other species. In a recent study, Gabriel et al. (2007) showed that the young individuals of C. ver-nalis did not follow the distribution of adults in a forest in southern Brazil. Th is may be an important strategy of this species and reinforces the hypothesis that it forms dense and dominant groups.
Alpha Diversity and Species Richness – Th e value of species diversity obtained through the Shannon Index (H’) of 3.35 nats.ind can be considered high when compared to other surveys made on the slopes of the Serra Geral forma-tion. We attribute this elevated value to natural disturbances in the location: I) due to the terrain’s inclination and soil characteristics, the two gullies in the studied area probably interfered in the dominance of one species, and II) these gullies provide a permanent canopy gap, which favored the establishment of widely distributed pioneer or light-demanding species with low density values. Th e infl uence and functioning of these disturbances in the richness of tropical and subtropical forests, has been demonstrated in current studies (Schintzer & Carson 2001; Sheil & Burslem 2003; Smith et al. 2005). Th ese disturbances play an impor-tant role in the structure of plant communities, leading to environmental heterogeneity in time and space at diff erent scales (Budke et al. 2010).
A reduction of species richness can be seen from east to west when comparing the farthest east survey, located in the tropical rain forest domain, with our survey and with the farthest west survey, both located in the seasonal forest domain. Th e latter had 40% less species than the farthest east one. However, the correlation analysis done with the total amount of species of each survey showed that there is not a clear reduction of species richness from east to west because some of the compared surveys showed an oscillation in their richness values, so that the reduction line from east to west was not rectilinear. Th is fact can be related to local factors and not regional, because canopy gaps, big tree falls, or other local disturbances may create microsites which infl uence species richness and forest structure (Christie & Armesto 2003; Smith et al. 2005; Budke et al. 2010). It is also worth noting that two surveys, despite being in relatively close longitudes (e.g., our survey and the survey done in Vale do Sol), may have diff erences in their richness due to the elevation factor (Budke et al. 2004). From this premise, the present survey (done at 500 m.s.l.) had less species from the east contingent and also more species from the west contingent than the survey located in Vale do Sol (done at 100-140 m.s.l.), which is located a few kilometers to the west. So we considered that the survey of Vale do Sol had more characteristics from the east contingent than the present one.
Acknowledgements
We sincerely thank Joe Perry, Kelvin Conrad, Nicholas Gotelli and Rob Brooker for suggestions.
References
Anjos, A.; Mazza, M.C.M.; Santos A.C.M. & Delfi ni, L.T. 2004. Análise do padrão de distribuição espacial da araucária (Araucaria angustifolia) em algumas áreas no Estado do Paraná, utilizando a função K de Ripley. Scientia Forestalis 66: 38-45.
APG III. 2009. An update of the Angiosperm Phylogeny Group classifi cation for the orders and families of fl owering plants. Botanical Journal of the Linnean Society 161: 105-121.
Bell, J.R.; King, R.A.; Bohan, D.A. & Symondson, W.O.C. 2010. Spatial co-occurrence networks predict the feeding histories of polyphagous arthropod predators at fi eld scales. Ecography 33: 1-9.
Brasil. 2009. Ministério do Meio Ambiente. Portaria Nº 16, de 18 de Março 2009. Diário Ofi cial da União, seção 1, n. 53.
Brooker, R.W.; Maestre, F.T.; Callaway, R.M.; Lortie, C.L.; Cavieres, L.A.; Kunstler, G.; Liancourt, P.; Tielbörger, K.; Travis, J.M.J.; Anthelme, F.; Armas, C.; Coll, L.; Corcket, E.; Delzon, S.; Forey, E.; Kikvidze, Z.; Olofsson, J.; Pugnaire, F.; Quiroz, C.L.; Saccone, P.; Schiff ers, K.; Seifan, M.; Touzard, B. & Michalet, R. 2008. Facilitation in plant communities: the past, the present, and the future. Journal of Ecology 96: 18-34. Budke, J.C.; Giehl, E.L.H.; Athayde, E.A.A.; Eisinger, S.M. & Záchia, R.A.
2004. Florística e fi tossociologia do componente arbóreo de uma fl oresta ribeirinha, arroio Passo das Tropas, Santa Maria, RS, Brasil. Acta Botanica Brasilica 18: 581-589.
Budke, J.C.; Jarenkow, J.A. & Oliveira-Filho, A.T. 2008. Tree community features of two stands of riverine forest under diff erent fl ooding regimes in Southern Brazil. Flora 203: 162-174.
Budke, J.C.; Jarenkow, J.A. & Oliveira-Filho, A.T. 2010. Intermediary disturbance increases tree diversity in riverine forest of southern Brazil. Biodiversity and Conservation 19: 2371-2387.
Christie, D.A. & Armesto, J.J. 2003. Regeneration microsites and tree species coexistence in temperate rain forests of Chiloé Island, Chile. Journal of Ecology 91: 776-784.
Comissão de Química e Fertilidade do Solo. 2004. Manual de adubação e de calagem para os estados do RS e SC. Porto Alegre, Sociedade Brasileira de Ciência do Solo - Núcleo Regional Sul.
Conrad, K.F.; Perry, J.N.; Woiwod, I.P. & Alexander, C.J. 2006. Large-scale temporal changes in spatial pattern during declines of abundance and occupancy in a common moth. Journal of Insect Conservation 10: 53-64.
Dale, M.R.T.; Dixon, P.; Fortin, M.J.; Legendre, P.; Myers, D.E. & Rosenberg, M.S. 2002. Conceptual and mathematical relationships among methods for spatial analysis. Ecography 25: 558-577.
Devictor, V.; Clavel, J.; Julliard, R.; Lavergne, S.; Mouillot, D.; Th uiller, W.; Venail, P.; Villérger, S. & Mouquet, N. 2010. Defi ning and measuring ecological specialization. Journal of Applied Ecology 47: 15-25. Donovan, S.E.; Griffi ths, G.J.K.; Homathevi, R. & Winder, L. 2007. Th e
spatial pattern of soil-dwelling termites in primary and logged forest in Sabah, Malaysia. Ecological Entomology 32: 1-10.
Ferguson, A.W.; Klukowski, Z.; Walczak, B.; Perry, J.N.; Mugglestone, M.A.; Clark, S.J. & Williams, I.H. 2000. The spatio-temporal distribution of adult Ceutorhynchus assimilis in a crop of winter oilseed rape in relation to the distribution of their larvae and that of the parasitoid Trichomalus perfectus. Entomologia Experimentalis et Applicatta 95: 161-171.
Forzza, R.C.; Leitman, P.M.; Costa, A.F.; Carvalho Jr., A.A.; Peixoto, A.L.; Walter, B.M.T.; Bicudo, C.; Zappi, D.; Costa, D.P.; Lleras, E.; Martinelli, G.; Lima, H.C.; Prado, J.; Stehmann, J.R.; Baumgratz, J.F.A.; Pirani, J.R.; Sylvestre, L.; Maia, L.C.; Lohmann, L.G.; Queiroz, L.P.; Silveira, M.; Coelho, M.N.; Mamede, M.C.; Bastos, M.N.C.; Morim, M.P.; Barbosa, M.R.; Menezes, M.; Hopkins, M.; Secco, R.; Cavalcanti, T.B.; Souza, V.C. 2010. Introdução. Lista de Espécies da Flora do Brasil. Jardim
Botânico do Rio de Janeiro. Disponível em http://fl oradobrasil.jbrj. gov.br/2010/ (Acesso em 09/11/10).
Franklin, J. & Rey, S.J. 2007. Spatial patterns of tropical forest trees in Western Polynesia suggest recruitment limitations during secondary succession. Journal of Tropical Ecology 23: 1-12.
Gabriel, C.; Azambuja, B.O.; Giehl, E.L.H. & Eisinger, S.M. 2007. Revista Brasileira de Biociências 5: 624-626.
Giehl, E.L.H.; Athayde, E.A.; Budke, J.C.; Gesing, J.P.A.; Eisinger, S.M. & Canto-Dorow, T.S. 2007. Espectro e distribuição vertical das estratégias de dispersão de diásporos do componente arbóreo em uma fl oresta estacional no sul do Brasil. Acta Botanica Brasilica 21: 137-145. Giehl, E.L.H. & Budke, J.C. 2011. Aplicação do método científi co em
estudos fi tossociológicos no Brasil: em busca de um paradigma. Pp. 1-21. In: Felfi li, J.M.; Eisenlohr, P.V.; Melo, M.M.R.F. Andrade, L.A.; Meira Neto J.A.A. (Org.). Fitossociologia no Brasil: métodos e estudos de caso. UFV: Viçosa, Sociedade Botânica do Brasil. Goldberg, D.E. & Barton, A.M. 1992. Patterns and consequences of
interspecifi c competition in natural communities: a review of fi eld experiments with plants. Th e American Naturalist 139: 771–801. Hammer, Ø.; Harper, D.A.T & Ryan, P.D. 2001. PAST: Paleontological
statistics software package for education and data analysis. Palaeontologia Electronica 4.
Higuchi, P.; Silva, A.C.; Louzada, J.N.C. & Machado, E.L.M. 2010. Spatial patterns of a tropical tree species growing under an eucalyptus plantation in South-East Brazil. Brazilian Journal of Biology 70: 271-277.
Hooten, M.B.; Larsen, D.R. & Wikle, C.K. 2003. Predicting the spatial distribution of ground fl ora on large domains using a hierarchical Bayesian model. Landscape Ecology 18: 487-502.
Jarenkow, J.A. 1994. Estudo fi tossociológico comparativo entre duas áreas com mata de encosta no Rio Grande do Sul. São Carlos, UFSCar. Tese de Doutorado, Centro de Ciências e da Saúde, Universidade Federal de São Carlos.
Jarenkow, J.A. & Waechter, J.L. 2001. Composição, estrutura e relações fl orísticas do componente arbóreo de uma fl oresta estacional no Rio Grande do Sul, Brasil. Revista Brasileira de Botânica 24: 263-272. Jarenkow, J.A. & Budke, J.C. 2009. Padrões fl orísticos e análise estrutural
de remanescentes fl orestais com Araucaria angustifolia no Brasil. Pp. 113-126. In: Fonseca, C.S.D.; Souza, A.F.; Zanchet, A.M.L.; Dutra, T.; Backes, A.; Ganade, G.M.S. (Org.). Floresta com Araucária: ecologia, conservação e desenvolvimento sustentável. Ribeirão Preto, Holos.
Jurinitz, C.F. & Jarenkow, J.A. 2003. Estrutura do componente arbóreo de uma fl oresta estacional na Serra do Sudeste, Rio Grande do Sul, Brasil. Revista Brasileira de Botânica 26: 475-487.
Koellner, T.; Hersperger, A.M. & Wohlgemuth, T. 2004. Rarefaction method for assessing plant species diversity on a regional scale. Ecography 27: 532-544.
Legendre, P. & Fortin, M.J. 1989. Spatial pattern and ecological analysis. Vegetatio 80: 107-138.
Levine, J. 1999. Indirect facilitation: evidence and predictions from a riparian community. Ecology 80: 1762-1769.
Lindenmaier, D.S. & Budke, J.C. 2006. Florística, diversidade e distribuição espacial das espécies arbóreas em uma fl oresta estacional na bacia do Rio Jacuí, sul do Brasil. Pesquisas, Botânica 57: 193-216.
Longhi, S.J.; Nascimento, A.R.T.; Fleig F.D.; Della-Flora, J.B.; Freitas, R.A. & Charão, L.W. 1999. Composição fl orística e estrutura da comunidade arbórea de um fragmento fl orestal no município de Santa Maria-Brasil. Ciência Florestal 9: 115-133.
Longhi, S.J.; Araujo, M.M.; Kelling, M.B.; Hoppe, J.M.; Müller, I. & Borsoi, G.A. 2000. Aspectos fitossociológicos de fragmento de floresta estacional decidual, Santa Maria, RS. Ciência Florestal 10: 59-74. Maluf, J.R.T. 2000. Nova classifi cação climática do Rio Grande do Sul.
Revista Brasileira de Agrometeorologia 8: 141-150.
Muller-Dombois, D. & Ellenberg, H. 1974. Aims and methods of vegetation ecology. New York, Wiley.
Oliveira, M. de L.A.A.; Balbueno, R.A. & Senna, R.M. 2005. Levantamento fl orístico de fragmentos fl orestais na bacia hidrográfi ca do rio Gravataí, Rio Grande do Sul, Brasil Iheringia, Série Botânica 60: 269-284 Paludo, G.F.; Mantovani, A.; Klauberg, C. & Reis, M.S. 2009. Estrutura
demográfi ca e padrão espacial de uma população natural de Araucaria angustifolia (Bertol.) Kuntze (Araucariaceae), na Reserva Genética Florestal de Caçador, Estado de Santa Catarina. Revista Árvore 33: 1109-1121.
Pélissier, R. 1998. Tree spatial patterns in three contrasting plots of a southern Indian tropical moist evergreen forest. Journal of Tropical Ecology 14: 1-16.
Perry, J.N. 1995. Spatial analysis by distance indices. Journal of Animal Ecology 64: 303-314.
Perry, J.N.; Bell, E.D.; Smith, R.H. & Woiwoid, I.P. 1996. SADIE: soft ware to measure and model spatial pattern. Aspects of Applied Biology 46: 95-102.
Perry, J.N. 1998. Measures of spatial pattern for counts. Ecology 79: 1008-1017.
Perry, J.N.; Winder, L.; Holland, J.M. & Alston, R.D. 1999. Red-blue plots for detecting clusters in count data. Ecology Letters 2: 106-113. Perry, J.N. & Dixon 2002. A new method for measuring spatial association
in ecological count data. Ecoscience 9: 133-141.
Perry, J.N.; Liebhold, A.M.; Rosenberg, M.S.; Dungan, J.; Miriti, M.; Jakomulska, A. & Citron-Pousty, S. 2002. Illustrations and guidelines for selecting statistical methods for quantifying spatial pattern in ecological data. Ecography 25: 578-600.
Rambo, B. 1956. A fi sionomia do Rio Grande do Sul. 2. ed. Porto Alegre, Selbach.
Rambo, B. 1960. Die Südgrenze des brasilianischen Regenwaldes. Pesquisas, Botânica 8: 5-41.
Rambo, B. 1961. Migration routes of the South Brazilian rain Forest. Pesquisas, Botânica 12: 1-54.
Rechenmacher, C.; Schmitt, J.L. & Budke, J.C. 2007. Estrutura e distribuição espacial de uma população de Blechnum tabulare (thunb.) Kuhn (Pteridophyta, Blechnaceae) em um mosaico fl oresta-campo no sul do Brasil. Pesquisas, Botânica 58: 177-186.
Rôças, G.; Barros, C.F. & Scarano, F.R. 1997. Alchornea triplinervia (Euphorbiaceae) under distinct light regimes in a Brazilian montane Atlantic rain forest. Trees 11: 469-473.
Rode, R.; Figueiredo-Filho, A.; Machado, S.A. & Galvão, F. 2010. Análise do padrão espacial de espécies e de grupos fl orísticos estabelecidos em um
povoamento de Araucaria angustifolia e em uma Floresta Ombrófi la Mista no centro-sul do Paraná. Floresta 40: 255-268.
Schnitzer, S.A. & Carson, W.P. 2001. Treefall gaps and the maintenance of species diversity in a tropical forest. Ecology 82: 913-919.
Sheil, D. & Burslem, D.F.R.P. 2003. Disturbing hypotheses in tropical forests. Trends in Ecology & Evolution 18: 18-26.
Silvertown, J. 2004. Plant coexistence and the niche. Trends in Ecology and Evolution 19: 605-611.
Smith, R.G.B.; Nichols, J.D. & Vanclay, J.K. 2005. Dynamics of tree diversity in undisturbed and logged subtropical rainforest in Australia. Biodiversity and Conservation 14: 2447-2463.
Smith, A.R.; Pryer, K.M.; Schuettpelz, E.; Korall, P.; Schneider, H. & Wolf, P.G. 2006. A classifi cation for extant ferns. Taxon 55: 705-731. Sonego, R.C.; Backes, A. & Souza, A.F. 2007. Descrição da estrutura de
uma Floresta Ombrófi la Mista, RS, Brasil, utilizando estimadores não paramétricos de riqueza e rarefação de amostras. Brasília, Acta Botanica Brasilica 21: 943-955.
Streck, E.V.; Kämpf, N.; Dalmolin, R.S.D.; Klamt, E.; Nascimento, P.C. & Schneider, P. 2002. Solos do Rio Grande do Sul.
Sühs, R.B.; Putzke, J. & Budke, J.C. 2010. Relações fl orístico-geográfi cas de espécies arbóreas em remanescente fl orestal da região central do Rio Grande do Sul, Brasil. Revista Floresta 40: 635-646.
Teixeira, M.B.; Coura-Neto, A.B.; Pastore, U. & Rangel-Filho, A.L.R. 1986. Vegetação In: Levantamento de recursos naturais 33: 541-632. Instituto Brasileiro de Geografi a e Estatística.
Vaccaro, S.; Longhi, S.J. & Brena, D.A. 1999. Aspectos da composição fl orística e categorias sucessionais do estrato arbóreo de três subseres de uma fl oresta Estacional Decidual, no município de Santa Tereza – RS. Ciência Florestal 9: 1-18.
Xu, X.-M. 2003. Considerations for the use of SADIE statistics to quantify spatial patterns. Ecography 26: 821-830.
Xu, X.-M. & Madden, L.M. Use of SADIE statistics to study spatial dynamics of plant disease epidemics. 2004. Plant Pathology 53: 38-49.
Waite, S. 2000. Statistical Ecology in Practice: A Guide to Analysing Environmental and Ecological Field Data. Essex, Pearson Education Ltd.
Winder, L.; Alexander, C.J.; Holland, J.M.; Wooley, C. & Perry, J.N. 2001. Modelling the dynamic spatio-temporal response of predators to transient prey patches in the field. Ecology Letters 4: 568-576.