Economia Aplicada, v. 18, n. 1, 2014, pp. 5-34
PERFORMANCE-BASED COMPENSATION VS.
GUARANTEED COMPENSATION: CONTRACTUAL
INCENTIVES AND PERFORMANCE IN THE
BRAZILIAN BANKING INDUSTRY
Klenio Barbosa*
André Bucione† André Portela Souza‡
Abstract
Top management from retail banks must delegate authority to lower-level managers to operate branches and service centers. Doing so, they must navigate through conflicts of interest, asymmetric information and limited monitoring in designing compensation plans for such agents. Pur-suant to this delegation, banks adopt a system of performance targets and incentives to align the interests of senior and unit managers. This pa-per evaluates the causal relationship between pa-performance-based salaries and managers’ effective performance. Using data from January 2007 to
June 2009 of a large Brazilian retail banks, we find that that agents with guaranteed variable salary contracts have inferior performance compared with agents who have performance-based compensation packages. We conclude that there is a moral hazard in the behavior of agents who are subject to guaranteed variable salary contracts.
Keywords:Contract and Incentives; Moral Hazard; Retail Bank Industry; Manager’s Performance; Panel Data Analysis.
Resumo
A alta gerência dos bancos de varejo delega autoridade aos gerentes de unidades bancárias para operação de suas agências. Tal delegação está per-meada de conflitos de interesse, informação assimétrica e monitoramento limitado, os quais moldam os planos de compensação dos gerentes. Dessa forma, bancos alinham os interesses da alta gerência e dos gerentes por meio de um sistema de metas e incentivos. Este artigo avalia a relação cau-sal entre os cau-salários com base no desempenho e desempenho dos gestores. Usando dados de janeiro/07 a junho/09, de um grande banco de varejo do Brasil, verificamos que os agentes com contratos salariais variáveistêm desempenho inferior em comparação com agentes que têm remuneração por desempenho. Conclui-se que há um risco moral no comportamento dos agentes que estão sujeitos a contratos salariais variáveis garantidos.
Palavras-chave: Contratos e Incentivos; Risco Moral; Banco de Varejo; Desempenho dos Gerentes; Dados em Painel.
JEL classification:D23, G3, J3.
DOI:http://dx.doi.org/10.1590/1413-8050/ea474
*Sao Paulo School of Economics — FGV. E-mail: [email protected]
†Sao Paulo School of Economics — FGV. E-mail: [email protected] ‡Sao Paulo School of Economics — FGV. E-mail: [email protected]
1
Introduction
Typically, the top management of retail banks must delegate authority to lower-level managers to supervise bank activities outside headquarters. A 2009 Febraban study (Barbosa 2009), for example, shows that there were 19,142 retail bank branches in Brazil that covered the entire national territory and directly employed more than 431,000 people. Operations of such magni-tude would not be viable if senior management did not delegate authority to production unit managers.
However, according to the literature on organization theory, there are po-tential conflicts of interest between senior management and the managers of production units (e.g., bank branches) that arise due to information asymme-try between the parties and because it is impossible for senior management to thoroughly monitor all the managers’ activities (Milgrom and Roberts, 1992). In this environment, a bank’s top management must decide how much author-ity to delegate to lower management levels and adopt an incentives scheme to induce managers to take actions that are aligned with the goals of senior management.
A typical problem of asymmetric information that permeates the relation-ship between top management and production unit managers is the hidden action problem or moral hazard. In a moral hazard environment, senior man-agement cannot control the actions of the managers of production units be-cause those actions are not observable by upper management or by a third
party. As a result, senior management cannot write an effective employment
contract based on the actions of production unit managers because the actions of such managers are not contractible (because they cannot be observed). This type of moral hazard raises a conflict of interest between senior management and production unit managers because the decisions/actions of the latter af-fect bank earnings and other performance measures and cannot be controlled
by the former (Laffont & Martimort 2001, Chapter 4).
In this context, senior management must design an incentive scheme that induces production unit managers to take actions that maximize the profits and value of the bank. As the literature on the delegation of activities and the
design of optimal contracts under moral hazard indicates,1 senior
manage-ment can solve this problem by offering unit managers a performance-ased
re-muneration scheme in which better performance leads to higher remueration.
A fixed salary scheme offers unit managers no incentive to conduct their
actvi-ties to maximize the value and profits of the bank, whereas a performanced-based remuneration scheme allows senior management to align unit man-agers’ interests with the bank’s.
One possible way to test whether there is a moral hazard in the relation-ship between senior management and production unit managers is to estimate the relationship between the sensitivity of the unit managers’ remuneration to
their own effective performance. The theory of contracts and asymmetric
in-formation predicts that the higher the sensitivity of a manager’s remuneration to his own performance, the better his performance will be.
The aim of this study is to empirically investigate whether such a theoreti-cal prediction identifies a causal relationship between employment contracts
Performance-Based Compensation vs. Guaranteed Compensation 7
with variable remuneration for performance and the effective performance of
banking unit managers in Brazil. Jensen & Murphy (1990) estimate the rela-tionship between performance and remuneration (including salary, options, bonuses and other) for the CEOs of publicly held companies in the United States. However, to the best of our knowledge, our study is the first to ex-amine this empirical question for Brazilian companies and is also the first to empirically study the presence of the moral hazard as the same relates to the design of contracts between senior management and branch managers in a banking organization.
To estimate such a causal relationship, we use the database of a large na-tional retail bank in Brazil for the period from January 2007 to June 2009. We chose this retail bank because it provides us with an unique dataset. The database contains information about the performance of each manager (in-cluding percentage-based performance evaluations with respect to their over-all performance goals), the type of remuneration (labor contract) for each
production unit manager and the sensitivity of these different remuneration
schemes to performance. This information is critical to investigate the subject matter of this article.
In particular, this bank utilizes two compensation schemes with respect to its production unit managers: (i) performance-based remuneration and (ii) “guaranteed variable salary“. A manager with performance-based remunera-tion has his monthly and yearly income pegged to the degree of his achieve-ment of certain performance indicators. Conversely, a manager with a guar-anteed variable salary contract has his remuneration guarguar-anteed by the bank, and this remuneration may be higher if the manager satisfies certain perfor-mance indicators. In practice, a manager subject to a guaranteed variable
salary is remunerated by the bank regardless of the manager’s effective
perfor-mance. As noted previously, this type of salary scheme does not induce man-agers to perform their activities to maximize bank value and profits. There-fore, managers should not perform as well when they are subject to a guar-anteed variable salary contract than when they are subject to an employment contract based on performance-based remuneration.
Using a fixed effects estimator for an unbalanced panel, we estimate the
causal effect of employment contracts with variable remuneration on
perfor-mance and the effective performance of the managers. Consistent with moral
hazard theory, we find that managers subject to a guaranteed variable salary contract underperformed compared with managers subject to performance-based remuneration and, consequently, that performance-performance-based remunera-tion induces better manager performance. Therefore, we conclude that we cannot rule out the moral hazard problem for the behavior of managers sub-ject to a guaranteed variable salary contract.
Although this work is grounded in previously consolidated concepts and theories, its academic relevance is related to the scarcity of empirical work in this area, particularly in Brazil and in the retail banking industry. From a practical perspective, there is evidence that guaranteed variable salary
con-tracts do not promote an efficient allocation of bank resources because such
contracts induce lower levels of manager performance.
This section also presents the different types of remuneration (contracts) at
the retail bank under study. In particular, we describe the performance-based remuneration scheme and the guaranteed variable salary scheme and explain
how these different contractual employment schemes affect the incentives of
unit managers. Section 3 presents a theoretical discussion about the possible
effects and describes the theoretical basis that supports the empirical work;
its main focus is to present the essential ideas of the principal-agent model while describing the moral hazard problem and to highlight the role of mon-itoring and the incentive mechanisms at work. Section 4 provides a descrip-tion of the data and the sample selecdescrip-tion from this large nadescrip-tional retail bank during the period from January 2007 to June 2009. Section 5 presents the methodology and results, describes the econometric tools used and interprets
the coefficients. Section 6 presents some robustness tests. Section 7 concludes
and provides final thoughts on this study. Graphs and tables are found in the Appendix.
2
The bank’s organizational profile: delegation of activities and
types of remuneration
The purpose of this section is to present the organizational profile of the bank analyzed in this study, noting its main spheres of activity and how its oper-ational strategy depends on delegating authority to branches. Additionally, this section describes the relevant contractual relationships between senior management and banking unit managers.
2.1 Organizational structure of the bank
The retail bank analyzed in this article is organized with headquarters where the bank’s main corporate strategies are formulated and banking units (branches and service centers) across Brazil.
Top executives and senior management of the bank work at headquarters and are responsible for setting and approving major decisions and general business practices, for monitoring managers who are responsible for the bank-ing units (agents), decidbank-ing how much authority to delegate such lower-level managers and determining which incentives scheme to adopt to induce such agents to fulfill the objectives established by senior management. In particu-lar, senior management is responsible for designing the system of goals and remuneration schemes for banking unit managers.
Bank branches and service centers are run by unit managers who are con-sidered the highest in the hierarchy of each such bank branch or service center. The unit managers have powers that enable them to manage, coordinate and supervise each production unit, and they are accountable only to a Regional Director. The unit manager is responsible for:
1. Verifying compliance with each office’s operational goals and quality
in-dicators through the agency platform and/or reports forwarded by the administrative section of the bank;
Performance-Based Compensation vs. Guaranteed Compensation 9
3. Evaluating the operational relationship between customers and man-agers of the branch;
4. Guiding the team in various campaigns and the sale of products and services to focus, for example, on targets defined as annual strategies of the bank;
5. Developing, where necessary, programs for conquest, activation and cus-tomer retention and to monitor the branches’ indicators of productivity and quality, which may include, for example, proposing a methodology to leverage a manager’s customer relationships;
6. Monitoring each unit’s employees and warning and/or punishing them when there is a violation of the electronic punch clock;
7. Analyzing the performance of each unit’s employees and acting as the responsible party for management, feedback, hiring and firing in the production unit; and
8. Motivating and guiding the team to achieve the goals and priorities es-tablished by the bank.
The agents are coordinated, monitored and controlled by means of a sys-tem of targets described below.
2.2 Incentive schemes and types of remuneration
Banking unit managers are subject to one of two types of remuneration: (i) performance-based remuneration or (ii) “guaranteed variable salary”. A man-ager with performance-based remuneration has his monthly and yearly in-come pegged to his degree of achievement of certain pre-determined perfor-mance indicators. A manager with a guaranteed variable salary contract has his variable remuneration guaranteed by the bank, although this remunera-tion may be somewhat higher if the manager achieves certain performance indicators.
Performance-Based Remuneration
The performance-based remuneration incentive scheme is based on a system of goals established by the bank’s senior management. Formally, the goals system is established by the bank’s Department of Planning and Goals using an econometric model that considers both forward — and backward-looking factors.
The system of targets encompasses various indicators, including net fund-raising, growth of the customer base by segment, insurance, liability products, asset products, cards and customer satisfaction. The achievement of these
in-dicators is measured by dividing the effective value calculated for each item
by the established target value. For example, the manager of Y unit from Z branch had a net fund raising target of 1,000 BRL for Period 1. At the en of
this period, the bank verified effective net funds raised of 900 BRL. Th
The weight of each indicator-and the inclusion/exclusion of the indicators-is established semi-annually by aligning the goal system with th strategy estab-lished by senior management. Both the indicators and their weights in the global achievement score are identical for all the agents in each period.
Another indicator that is observed and controlled separately is the abso-lute value of the adjusted gross margin of the production unit, i.e., revenue minus adjusted costs for the branch or service center. The criterion for the ad-justment is identical for all the branches in each period. The system of goals described above and the absolute value of the adjusted gross margin forms the basis for the system of direct incentives, and unit managers are monitored monthly in matrix form by the Regional Directors and by those responsible for the bank’s products.
As a premise of this study, we assume that the bundle of information used to establish these goals is complete and that the goals arising from the appli-cation of this methodology contain an error with zero mean and standard de-viation. With these premises and considering that the same system is applied
to all agents without exception, we can affirm that the goals do not contain a
bias that might compromise their achievement by agents and, consequently, the analysis of the causal relationship that is the subject of this work.
The unit managers’ incentive system provides for the payment of variable remuneration based on the results achieved in two ways: monthly and bian-nually. In the first case, a percentage of the absolute value of the adjusted gross margin is paid monthly, subject to certain restrictions related to inter-nal rules and procedures, current legislation and compliance. In the second case, a value that depends on the overall achievement of the performance in-dicators established in the target system is distributed biannually. In recent years, the share of variable compensation based on the results corresponded to approximately 50% of the total annual remuneration of the unit managers. All banking unit managers are subject to this type of contract except for those managers who were transferred from one bank unit to another and who are under the guaranteed variable salary regime for a period of 12 months.
Guaranteed Variable Salary
All the bank unit managers who are transferred to another unit are subject to
guaranteed variable salary scheme for a period of 12 months.2
This type of contract ensures that managers who are transferred from one unit to another have a total monthly variable compensation that is at least equal to the average achieved by the manager in the last 12 months, regard-less of performance. This variable salary is assured to the manager for 12 months after a transfer. Specifically, during the twelve-month period follow-ing the transfer, the manager of the unit does not share in the risk of poor performance and receives at a minimum the manager’s average for the past twelve months obtained from the direct incentives system in the monthly and biannual programs. In practice, this scheme indicates that the premium for sharing the risk of the bank’s results is embedded in the total remuneration of the agent. It is worth noting that even with this guaranteed variable salary contract, all the other means of coordination, control and monitoring of the unit managers described above remain unchanged.
2No trade union’s collective bargaining agreement explicitly mandates the application of a
Performance-Based Compensation vs. Guaranteed Compensation 11
The transfer of unit managers from one production unit to another is an important management tool and is widely used by senior management. Through this practice, the bank seeks to supplement unit managers’ training by placing the managers in competition with one another, changing the ex-ternal environment in a particular region or simply injecting motivation and creativity into the unit managers and the teams involved in the changes. All the unit managers transferred from one branch to another are subject to this type of contract, and the criteria for transfer is solely in the bank’s discretion. Thus, a manager with a guaranteed variable salary contract has the value of his variable remuneration guaranteed by the bank, and this remuneration may be higher if the manager achieves his performance indicators. In practice, managers subject to a guaranteed variable salary have a variable remuneration paid by the Bank regardless of their actual performance. As discussed in the introduction, this type of salary scheme does not induce managers to perform their obligations to maximize the value and profits of the bank.
In this study, we assume that bank unit managers construct their
expecta-tion of variable remuneraexpecta-tion int+ 1 on the basis of their variable
compen-sation effective in t plus a few more random effects; thus, we can say that
the implicit contract raises the value expected by agents intabout their
vari-able remuneration int+ 1 because the likelihood of a downside is eliminated
regardless of whether the transfer has made the possibility of upside less cer-tain. Therefore, these managers will demonstrate worse performance when they are subject to a guaranteed variable salary contract than when they are subject to a performance-based salary scheme.
3
Theoretical discussion of the possible e
ff
ects
Agency theory is the conceptual basis for this work. The problem appears as we analyze how the top managers at a retail bank (principals) establish contractual rules (incentives) that induce unit managers (agents) to act in top management’s interest. The relationship between principal and agent there-fore moderates our discussion, particularly with respect to the problem that arises from the inability of one side to observe the actions of other: the moral hazard.
The concept of moral hazard, whose manifestation occurs in both the mar-kets for goods and services-and inside organizations-originated in the insur-ance market, where it was observed that people with insurinsur-ance have the ten-dency to change their behavior by becoming less careful with the insured ob-ject, which generates greater costs to the insurer. However, it is not possible for the insurer to observe, verify or confirm this behavioral change in its pol-icyholders, which nullifies adopting specific measures that depend on an en-forceable contract. The problem of moral hazard is a type of post-contractual opportunism that arises because a party chooses to deviate from the hired ob-ject for its own benefit at the expense of the other party and because these actions cannot be completely observable.
found who does not devote a considerable amount of time to studying just how slowly he can work and still convince his employer that he is going at a good pace.”
Thus, the moral hazard is sufficiently inherent in the environment of firms
that they devote considerable resources to mitigating it. Two basic condi-tions are necessary for the moral hazard: potential divergence of interests and costly monitoring or unobservable activity.
Thus, it is appropriate to discuss the role of monitoring in this context. The main purpose of monitoring is to increase the probability that an agent will be detected when he is deviating from the principal’s interests for his own benefit, which implies that actions of interest are monitored to generate evidence that a contract is or is not being followed properly. For monitoring
to be effective, an organization must establish penalties or bonuses that are
linked to observed actions of interest.
Employment contracts are frequently used in response to the moral hazard
problem. Companies typically offer incentives or performance contracts with
the objective of increasing the level of employee dedication and ensuring the alignment of the goals of employees with those of the company. Following Varian (1990, p.730), we present a simple, formal idea of the incentive system.
1. Letxbe the amount of effort that a unit manager spends, andy=f (x)
is the quantity produced. For simplicity, we normalize the price to 1 so
that y also reflects the financial value of the product. Let s(y) be the
wages paid by the retail bank foryunits produced. The bank then tries
to maximizey−s(y).
2. Assuming that the cost of exerting effortxin the productive process is
c(x) for the unit manager, the manager attempts to maximize his utility,
given bys(y)−c(x), subject to the participation constraint. The latter
stems from the fact that the unit manager is on y willing to work at the bank if the utility that he obtains from this job is at least a great as the utility he could obtain elsewhere. Denoting the utility that the worker
could obtain (given the alternatives) asu∗, the participation constraint
is given bys(f (x))−c(x)≥u∗.
3. Thus, the firm seeks to maximize its profit given the restrictions of par-ticipation of the unit manager, i.e.,
max
x f (x)−s(f (x))
s.t. s((x))−c(x)≥u∗
4. The optimalx−x∗ — is found when the marginal product (MP(x)) is
equal to the marginal cost (MC(x)), which determines the level of the
unit manager’s effort that upper management wants to achieve to
max-imize his objective function. The question becomes how to induce the
unit manager to choose the level of effortx∗by appropriately designing
s(y). To this end,s(y) must satisfy the incentive compatibility constraint,
namely:
Performance-Based Compensation vs. Guaranteed Compensation 13
5. If the firm chooses to establish this incentive through a bonus —k —,
the salary structure is given by:
s(x) =wx+k,
in which the wage ratew is equal to the marginal product of the unit
manager at pointx∗, i.e.,MP(x∗). The constantkis chosen only to
en-sure that the participation constraint is met. Thus, the problem of
maxi-mizing the unit manager has the following format: maxx wx+k−c(x),
andwmust also match theMCbecause the optimal choice isMP(x∗) =
w=MC(x∗), exactly as desired by the bank.
Because the effort xis typically not observable, the bank follows the
ac-tions of interest through the resulty. However,y may vary depending on
fac-tors that do not depend solely on the effort and performance of unit managers.
Other factors that are not controllable by the company or the unit manager
may influencey, including macroeconomic factors, health issues, family
con-cerns, traffic, etc. This problem of uncertainty aboutyaffects the motivation
of unit managers because it is a measure of the risk in the salary structure. Thus, the process of maximizing the unit manager’s performance is more complicated when accepting or rejecting an incentive system, namely:
max
x wy(x) +k−c(x) =u ∗(E(y))
in whichE(y) is the risk premium embedded in the incentive compatibility
constraint of the manager.
Applying these theoretical results to the context of this article, when a bank unit manager is transferred to another unit, the uncertainty regarding
the resulty increases, and therefore the risk premium increases, which alters
the incentive compatibility constraint. To maintain the change, the bank
in-creaseskduring the next twelve periods by incorporating the averagewy of
the twelve prior periods into k. Under a guaranteed variable wage contract,
wwill only be optimal —MP(x∗) =w=MC(x∗) — whenE[(y)|x∗] is greater
than the average ofyfrom the twelve periods prior to the contract’s execution.
As described in the previous section, we take as a premise that the agent
builds the expected value foryfor the 12 subsequent periods for a guaranteed
variable wage contract based on the value ofyfor the previous 12 periods plus
a random effect. Thus, wis not optimal under a guaranteed variable salary
contract. In the following sections, we empirically evaluate the behavior of agents under these conditions.
4
Description of the data and sample Selection
The data were obtained from a large retail bank with a presence throughout Brazil. This database contains information on the performance of each man-ager (measured as a percentage of the achievement of their goals for over-all performance), the type of remuneration (labor contract) that the manager
of each production unit is subject to and how these different remuneration
schemes are adjusted for managers’ performance.
however, the application of the system of incentives was significantly diff
er-ent before 2007, which precludes the use of these data in this study. Thus, the analysis is focused on the period between January 2007 and June 2009,
capturing the effects of 5 semesters and 30 productive periods.
The observational unit of our sample is the manager, about whom there is information on performance and the type of compensation (performance-based remuneration or guaranteed variable salary) for every month through-out the period under examination. The data are arranged in the form of a panel and form a database with 27,659 observations. Our sample contains in-formation for approximately 1,018 branches, of which 13 appear in only one year, 95 in two years and the vast majority, 910, are observed in all three years under study.
The employment contracts between the managers and the bank are for an indeterminate period; however, either party can opt for closure at any time without great expense, subject only to applicable Brazilian labor law. Thus, because of the rotation of unit managers, the unit manager sample is larger than the sample of branches, although there are cases in which a manager simultaneously manages more than one branch. The sample consists of a to-tal of 1,260 unit managers, with 207 appearing in only one year, 279 in two years, and the vast majority, 774, are observed in all three years under study. Therefore, we have an unbalanced panel.
Because the purpose of this study is to identify and estimate a causal rela-tionship between employment contracts with variable remuneration for
per-formance and the effective performance of banking unit managers, two
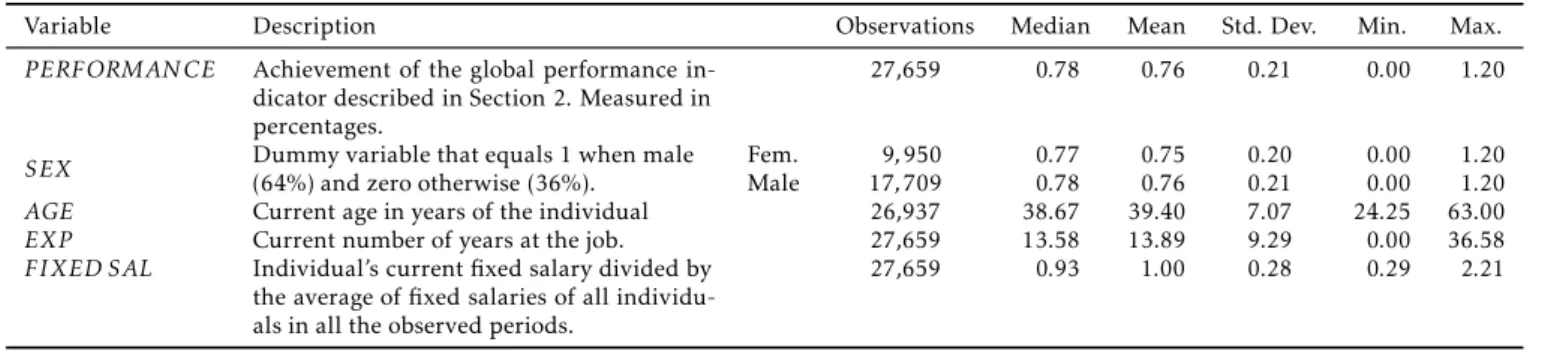
vari-ables are crucial. The first of these is the performance of the unit manager that is represented by the level of achievement of the overall performance indicator presented in Section 3 of this work. These observations are in per-centages and range from 0% to 120%, which is the maximum value achieved by an agent during the 30 months observed. The descriptive statistics for this variable are listed in Table 1.
The other key variable is the type of contract that the manager is subject
to. The variableCON T RACT is a dummy that equals 1 when the person
ob-served is subject to a guaranteed variable salary contract, and zero otherwise. On average, 38% of the agents observed are subject to guaranteed variable salary contracts.
Certain observed individual control variables are added: gender, age, ex-perience and fixed salary. Table 1 also describes how the control variables are represented and presents the median, mean, standard deviation and min-imum and maxmin-imum values.
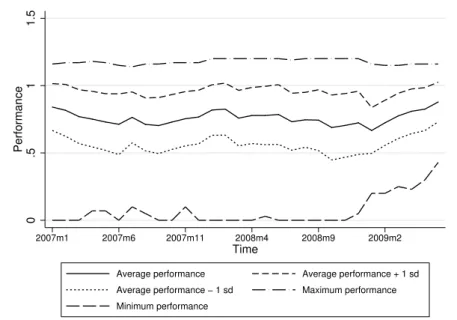
The control of a unit manager’s performance over time is measured by creating dummy variables for year and month. Figure 1 shows the mean, stan-dard deviation, and minimum and maximum performances of unit managers over the 30 months observed.
A variable identifying the agents subject to a guaranteed variable salary contract described in Section 2 allows us to assess the causal relationship
be-tween this type of contract and manager performance. The variableCON T RACT
is a dummy that takes the value of 1 when a manager is subject to a guaranteed variable salary contract. On average, 38% of the agents observed are subject to this type of contract over time.
man-P
er
fo
rm
an
ce
-B
as
ed
C
om
p
en
sa
tio
n
vs
.
G
u
ar
an
te
ed
C
om
p
en
sa
tio
n
1
5
Table 1: Descriptive Statistics
Variable Description Observations Median Mean Std. Dev. Min. Max.
PERFORMAN CE Achievement of the global performance in-dicator described in Section 2. Measured in percentages.
27,659 0.78 0.76 0.21 0.00 1.20
SEX (64%) and zero otherwise (36%).Dummy variable that equals 1 when male Fem.Male 179,950 0.77 0.75 0.20 0.00 1.20 ,709 0.78 0.76 0.21 0.00 1.20
AGE Current age in years of the individual 26,937 38.67 39.40 7.07 24.25 63.00
EXP Current number of years at the job. 27,659 13.58 13.89 9.29 0.00 36.58
FIXED SAL Individual’s current fixed salary divided by the average of fixed salaries of all individu-als in all the observed periods.
0
.5
1
1.5
Performance
2007m1 2007m6 2007m11 2008m4 2008m9 2009m2
Time
Average performance Average performance + 1 sd Average performance − 1 sd Maximum performance Minimum performance
Figure 1: Performance over time
agers who were subject to guaranteed variable salary contracts.
.84 .82
.77 .75
.73.71 .76
.71 .7.73 .75.77
.82 .83
.76.78 .78 .79 .73.75 .74
.69.7 .72
.67 .72
.78 .81.83
.88
0
.2
.4
.6
.8
1
Average performance
.2
.4
.6
.8
1
0
Contract type
Without guarantee With guarantee Average performance
Figure 2: Contract type and performance
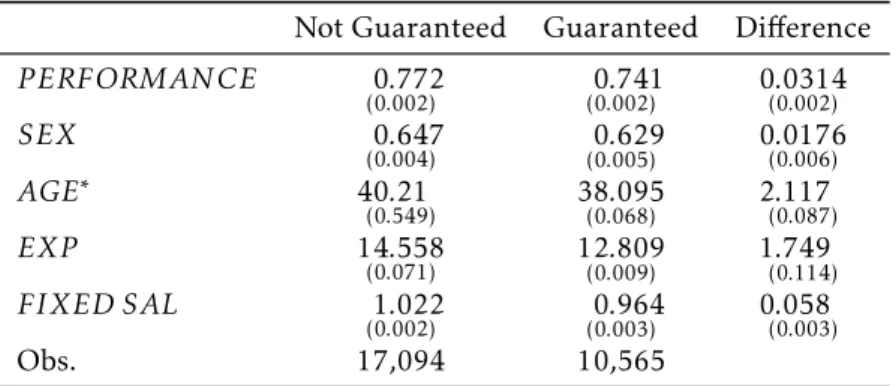
The average performance of the unit managers subject to a guaranteed variable salary contract is 0.741, which is 3.14 percentage points lower than the average unit manager not subject to this type of agreement. The minimum and maximum values of these groups are 0.0 and 1.2, respectively. Table 2 compares the groups with and without guaranteed variable salary contracts
Performance-Based Compensation vs. Guaranteed Compensation 17
Table 2: Difference between groups with guaranteed salary and
vari-able salary according to performance
Not Guaranteed Guaranteed Difference
PERFORMAN CE 0.772
(0.002) (00..002)741 0(0.0314.002)
SEX 0.647
(0.004) (00..005)629 0(0.0176.006)
AGE∗ 40.21
(0.549) 38(0..068)095 2(0.117.087)
EXP 14.558
(0.071) 12(0..009)809 1(0.749.114)
FIXED SAL 1.022
(0.002) (00..003)964 0(0.058.003)
Obs. 17,094 10,565
*Number of observations: 16,657 and 10,280, respectively.
Standard errors in parentheses.
Table 2 shows the differences among the groups with guaranteed variable
salary contracts and variable salary contracts according to their performance.
For all the variables, the hypothesis that the difference between the groups is
zero is rejected.
The differences between the groups, mainly in the variable FIXED SAL,
may be explained by recent acquisitions made by the bank in which these incorporated unit managers had higher fixed salaries than the average of the current group of managers.
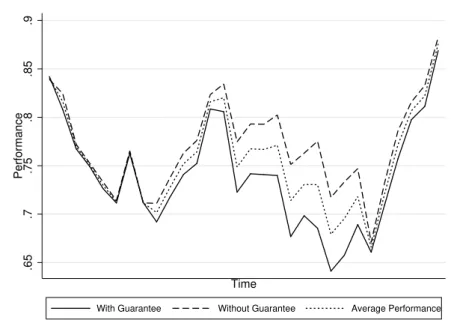
Figure 3 shows the average performance of the unit managers over time. The dotted line shows the average performance of all observations, the solid line shows the average performance of the unit managers subject to a guaran-teed variable salary and the dashed line shows the average performance of the unit managers subject to performance-based pay. We note that the solid line (with guarantee) is always below the dashed line.
5
Methodology and results
To measure the causal effect of the guaranteed variable salary contract on unit
manager performance, we first use a single cross section of the data and esti-mate the following equation by OLS:
ln (PERFORMAN CE) =β0+β1CON T RACT+u
In the specification above, the parameterβ0is the constant,β1captures the
average effect of having a guaranteed variable salary contract on performance
and u is the random error. We find a value of−0.031 for the coefficient of
interest,β1, i.e., the unit manager’s performance under a guaranteed variable
salary contract is lower, on average, by 3.1 percentage points in relation to unit managers subject to performance-based remuneration. With a robust
standard error of 0.003, the coefficientβ1is statistically significant at the 1%
level. However, the explanatory power of this model is weak, with an adjusted
R2of 0.01. The number of observations is 27,659.
.65
.7
.75
.8
.85
.9
Performance
Time
With Guarantee Without Guarantee Average Performance
Figure 3: Average performance over time, by contract
might influence the variable of interest. It is important to remember that, as
shown in Section 4, we reject the hypothesis that the difference between the
groups with and without a guaranteed variable salary is statistically zero.
To circumvent this problem, we use a fixed effects estimator for
unbal-anced panel data where the fixed effects for each unit manager and each
branch are included, thereby avoiding a likely omission bias resulting from omitting characteristics of the unit managers and the branches that are fixed over time. We also include the dummy variables of time (year and month) and other variables relevant to controlling unit managers presented above.
To this end, we estimate the equation below as a base model:
ln (PERFORMAN CE)iat=β0+β1CON T RACTiat+β2CARGGiat+ δt+λa+νi+uiat,
in which the variable of interest is the natural log ofPERFORMAN CEiat,
de-scribed in Section 4 for the unit manager i in branch a of periodt; CON
-T RAC-Tiatis described in Section 4 and takes the value 1 if the unit manager
i in branchais subject to a “Guaranteed Variable Salary” contract in period
t; andCARGGiatcontemplates several control variables related to
character-istics of unit manageri at branchaduring periodt, as described in Section
4:GEN DERiat, EXPiat, EXPiat2 , AGEiatandFIXED SALiat.δtis a time dummy
(year and month) and takes a value of 1 depending on the period of
obser-vation the variablesλa andνi are dummies that capture the fixed effects of
branch and the bank unit manager, respectively, i.e., variables that capture the characteristics of the branch and the manager that are fixed over t me;
anduiatis the random term.
The parameterβ1captures the effect of a guaranteed variable salary
Performance-Based Compensation vs. Guaranteed Compensation 19
managers subject to a guaranteed variable salary contract differs from the
av-erage performance of a manager subject to a performance-based contract. To better analyze the results, we deploy the base model described above in 5 formats:
Model 1 Takes into account manager characteristics and the CON T RACT
variable.
Model 2 In addition to the variables in Model 1, considers aT IMEdummy for the year.
Model 3 In addition to the variables in Model 1, considers aT IMEdummy for the year and the month.
Model 4 Considers all the variables from Model 3 and includes the fixed ef-fects of the branch.
Model 5 Considers all of the variables from Model 3 and includes the fixed
effects for both the unit manager and the branch.
The inclusion of theT IME dummy variables (year) beginning in Model
2 and theT IME dummy variables (year and month) from Model 3 onward
aims to control for macroeconomic factors, i.e., to prevent macroeconomic movements from influencing the relationship between the estimated perfor-mance of the unit manager and the existence of a guaranteed variable salary contract.
In Model 4, we introduce the fixed effects of the branch. This model is
more robust from an econometric perspective because it controls for any pos-sible bias caused by the omission of characteristics of branches that are fixed
over time. In Model 5, we add the fixed effects of the unit manager. In this
model, we control for the specific features of the unit manager that are fixed over time.
Note that Model 5 is a differences-in-differences model in which the effect
of the type of remuneration on performance (parameter β1) is identified by
comparing those managers who changed their contracts over time with man-agers who have not changed their contracts over time.
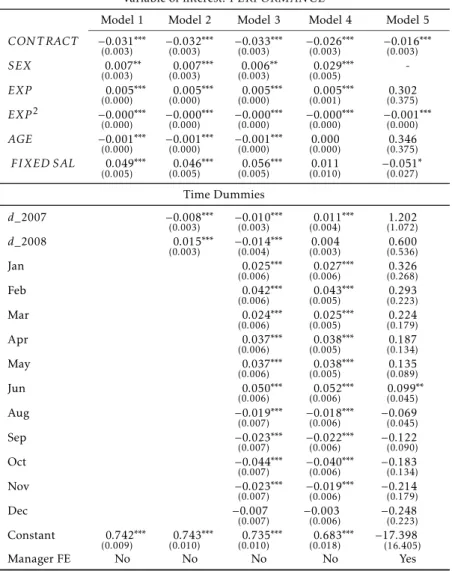
Table 3 presents the results of the regressions in the formats of the five models shown above:
First, we note in Table 3 that the coefficientβ1is negative and statistically
significant in all the evaluated models. The results indicate that the perfor-mance of the unit manager under a guaranteed variable salary contract is, depending on the model, between 3.3 and 1.6 percentage points lower than the performance of the unit managers subject to performance-based remuner-ation.
It is worth noting certain of the results for the unit manager control
vari-ables. The SEX variable’s coefficient indicates that being a man results in
superior performance of between 0.7 and 2.9 percentage points. The coeffi
-cients of EXP and EXP2 corroborate the expectation of a positive sign and
negative sign, respectively, which indicates decreasing marginal productivity as an individual’s experience increases.
The variableFIXED SAL confirms that as a unit manager’s fixed salary
Table 3: Regressions for Models 1 through 5. Dependent variable:
ln(PERFORMAN CE).
Variable of interest:PERFORMAN CE
Model 1 Model 2 Model 3 Model 4 Model 5
CON T RACT −0.031∗∗∗
(0.003) −0.032 ∗∗∗
(0.003) −0.033 ∗∗∗
(0.003) −0.026 ∗∗∗
(0.003) −0.016 ∗∗∗ (0.003)
SEX 0.007∗∗
(0.003) 0.007 ∗∗∗
(0.003) 0.006 ∗∗
(0.003) 0.029 ∗∗∗
(0.005)
-EXP 0.005∗∗∗
(0.000) 0.005 ∗∗∗
(0.000) 0.005 ∗∗∗
(0.000) 0.005 ∗∗∗
(0.001) (00..302375)
EXP2 −0.000∗∗∗
(0.000) −0.000 ∗∗∗
(0.000) −0.000 ∗∗∗
(0.000) −0.000 ∗∗∗
(0.000) −0.001 ∗∗∗ (0.000)
AGE −0.001∗∗∗
(0.000) −0.001 ∗∗∗
(0.000) −0.001 ∗∗∗
(0.000) (00..000000) (00..346375)
FIXED SAL 0.049∗∗∗
(0.005) 0.046 ∗∗∗
(0.005) 0.056 ∗∗∗
(0.005) (00..011010) −0.051 ∗ (0.027)
Time Dummies
d_2007 −0.008∗∗∗
(0.003) −0.010 ∗∗∗
(0.003) 0.011 ∗∗∗
(0.004) (11..202072)
d_2008 0.015∗∗∗
(0.003) −0.014 ∗∗∗
(0.004) (00..004003) (00..600536)
Jan 0.025∗∗∗
(0.006) 0.027 ∗∗∗
(0.006) (00..326268)
Feb 0.042∗∗∗
(0.006) 0.043 ∗∗∗
(0.005) (00..293223)
Mar 0.024∗∗∗
(0.006) 0.025 ∗∗∗
(0.005) (00..224179)
Apr 0.037∗∗∗
(0.006) 0.038 ∗∗∗
(0.005) (00..187134)
May 0.037∗∗∗
(0.006) 0.038 ∗∗∗
(0.005) (00..135089)
Jun 0.050∗∗∗
(0.006) 0.052 ∗∗∗
(0.006) 0.099 ∗∗ (0.045)
Aug −0.019∗∗∗
(0.007) −0.018 ∗∗∗
(0.006) −(00..069045)
Sep −0.023∗∗∗
(0.007) −0.022 ∗∗∗
(0.006) −(00..122090)
Oct −0.044∗∗∗
(0.007) −0.040 ∗∗∗
(0.006) −(00..183134)
Nov −0.023∗∗∗
(0.007) −0.019 ∗∗∗
(0.006) −(00..214179)
Dec −0.007
(0.007) −(00..003006) −(00..248223) Constant 0.742∗∗∗
(0.009) 0.743 ∗∗∗
(0.010) 0.735 ∗∗∗
(0.010) 0.683 ∗∗∗
(0.018) −17(16.398.405)
Manager FE No No No No Yes
∗,∗∗,∗∗∗denote statistically significant at 10%, 5% and 1% levels, respectively.
Performance-Based Compensation vs. Guaranteed Compensation 21
an increase of 10% in the fixed salary of an individual results in an increase of approximately 1% in performance. It is notable that this variable loses
statistical significance in the models controlled by fixed effects.
Analyzing the dummy variables forT IME, we note that these variables are
statistically significant in the models in which the fixed effects of the branch
and the unit manager are missing. In Model 4, we introduce the fixed effects of
the branch, and only the dummy variableT IME d_2008 (equals 1 when year
= 2008) loses statistical significance. However, in Model 5, which includes
the fixed effects of the unit managers, all the dummy variables forT IME,
for both year and month, lose statistical significance, which indicates that macroeconomic factors that were common to all the branches and individuals were no longer relevant to explain the performance of these managers when the performance is controlled by the specific features of the unit manager and the branch that are fixed over time.
It is important to note that the degree of fit of the models evolves as we
in-clude more control variables, particularly when we inin-clude both fixed effects
for the branches and for the unit managers. The power of explanation goes from 0.01 in Model 1 to 0.16 in Model 5.
Finally, we compare the results of the coefficient of interest β1 between
Model 4 (−0.026∗∗∗) and Model 5 (−0.016∗∗∗). When we introduce the control
by specific features of the unit managers that are fixed over time, we find that
the coefficient of interest has a variation of greater than 1.0 percentage points.
These results indicate that the behavior of unit manager (i) who is subject to a
guaranteed variable salary contract is different from the behavior of the same
unit managerisubject to a performance-based contract. This result indicates,
in particular, that the moral hazard problem explains 1.6 percentage points of the performance of unit managers who are subject to a guaranteed variable
salary, i.e., the coefficientβ1of Model 5. Additionally, these results indicate
that the behavior of two unit managers who are subject to the same
guaran-teed variable salary contract is different, which may indicate that the problem
of adverse selection explains 1.0 percentage points of the performance of unit
managers who are subject to a guaranteed variable salary, i.e., the differential
between the coefficients forβ1between Models 4 and 5.
6
Robustness Testing
The results from the previous section indicate that the performance of unit managers subject to performance compensation is superior to the performance of unit managers subject to a guaranteed variable salary contract. According
to the theory described in Section 3, such an effect is triggered by the moral
hazard in the relationship between senior management and banking unit man-agers.
The estimate of the causal effect of the type of employment contract on the
effective performance of managers can be biased if the manager’s performance
is correlated with an unobserved feature of the manager (e.g., productivity), which in turn is correlated with the remuneration contract allocated to that manager by senior management. In particular, if senior management decides to transfer managers who senior management expects will decline in produc-tivity to other branches and, therefore, such managers receive remuneration
is overestimated. Those managers with a tendency for declining productivity will likely demonstrate poor performance in the new unit to which they were transferred.
If the productivity of the managers is invariant through time, then the
panel data estimator with manager fixed effects presented in the previous
sec-tion in Model 5 fixes this problem and therefore provides an unbiased
esti-mate of the causal effect of the type of employment contract on managerial
performance. It is notable that Model 5 estimates the relationship between the type of contract and manager performance while controlling for all the
ob-servable features of the manager, and it includes the fixed effects of both the
branch and the manager. These fixed effects can control for the time-invariant
portion of productivity shocks.
However, if the productivity of managers varies over time, or if the
pro-ductivity growth rate varies over time, then the fixed effect estimator from
Model 5 may still be biased. In this case, we can only show that the Model 5 estimator is unbiased by trying to invalidate the other possible explanations that might bias the estimator.
In this study, we investigate two possible explanations that could make the
fixed effect estimator in Model 5 biased: (i) allocation of different employment
contracts by the productivity of managers and (ii) rules for hiring/firing of managers, contract allocation and productivity.
6.1 Allocation of contracts for senior management and managers’
productivity
Because the database in this article is observational and not experimental, the choice of the type of employment contract (guaranteed variable salary versus variable remuneration for performance) may be related to the productivity of the managers. As described above, if top management decides to trans-fer managers who have a tendency toward declining productivity to other branches, which mean, therefore, that these managers are allocated a
guar-anteed variable salary contract, the fixed effects estimator might be biased. In
this case, Model 5 will be overestimated if these managers demonstrate poor performance in their new unit in the first 12 months, when they are subject to a guaranteed variable salary contract.
To check if there is evidence that senior management transfers managers who they expect to demonstrate declining productivity to other branches, we must investigate whether the probability of a manager receiving a guaranteed variable salary contract is positively related to productivity and/or their per-formance at the bank. If there is evidence of such a relationship, then the
fixed effect estimator of Model 5 may be biased.
Performance-Based Compensation vs. Guaranteed Compensation 23
Using this sub-sample, we estimate the probability of a manager who en-tered the bank (sample) with a variable remuneration for performance con-tract to later go on to have a guaranteed variable salary concon-tract in the future on the basis of their performance and their characteristics, such as gender, age, experience and fixed salary at the bank. Table 4 presents the results of these estimations.
Columns (1) and (2) of Table 4, Models 6 and 7, present the estimates of the impact of the manager’s performance when entering the bank, measured by
the variablePERFORMAN CE(EN T RY IN T HE BAN K), on the probability
of the manager later having a guaranteed variable salary contract in the future using a probit and a logit model, respectively. In both estimations, it can be
observed that the performance of the manager does not seem to affect the
manager’s chances of later having a guaranteed variable salary contract. Columns (3) and (4) of Table 4, Models 8 and 9, present the estimates of the impact of the performance of the manager during the manager’s start-ing period at the bank while under a variable remuneration for performance
contract, measured by thePERFORMAN CE variable (AV ERAGE IN IT IAL
PERIODS IN BAN K), on the probability of the manager later having a guar-anteed variable salary contract in the future using a probit and a logit model, respectively. Both estimations indicate that the performance of a manager
does not seem to affect the manager’s chances of having a guaranteed variable
salary contract in the future.
The estimates in Table 4 indicate that there is no evidence that senior management transfers underperforming managers to other branches, grant-ing them a guaranteed variable salary contract. Thus, we have evidence that
the estimation of the causal effect between guaranteed variable salary
con-tracts and the effective performance of the managers through a panel data
fixed effect estimator, Model 5, is not biased.
6.2 Hiring/firing rule of managers, contract allocation and productivity
When managers’ productivity varies over time, another problem that can lead to bias of the Model 5 estimator derives from the fact that top management’s decisions to hire new managers and fire other managers can be made simulta-neously with the allocation of contracts of employment and their inferences about managers’ productivity.
In particular, the Model 5 estimator is biased if senior management had an expectation for declining productivity (low performance) for those managers (sample) who were relocated to another branch subject to guaranteed variable salary contracts, and, concomitantly, those managers who left the sample had higher productivity and better performance.
In Section 6.1, we showed that there is no evidence that senior manage-ment transfers managers with low productivity to other branches. Therefore, we can only investigate whether the probability of leaving the bank is posi-tively related to productivity and/or managers’ performance. If there is
evi-dence of such a relationship, then the fixed effect estimator of Model 5 may
be biased.
B
ar
bo
sa
,
B
u
ci
on
e
an
d
P
or
te
la
E
co
n
om
ia
A
p
lic
ad
a,
v.1
8
,
n
.1
Table 4: Determinants for a manager to have a “Guaranteed Variable Salary” contract in the future
Dependent Variable: Probability(Manager has a “Guaranteed Variable Salary” contract in the future|Manager has a “Performance-based Variable Salary”)
Model 6: Logit Model 7: Probit Model 8: Logit Model 9: Probit
PERFORMAN CE(EN T RY IN T HE BAN K) 0.725
(0.578) (00..460356)
PERFORMAN CE(AV ERAGE IN IT IAL PERIODS IN BAN K)
0.426
(0.912) (00..266560)
SEX −0.059
(0.224) −(00..035137) −(00..071224) −(00..045137)
EXP(EN T RY IN T HE BAN K) 0.145∗∗
(0.045) 0.091 ∗∗
(0.028) 0.148 ∗∗
(0.045) 0.093
∗∗ (0.027)
EXP(EN T RY IN T HE BAN K)2 −0.003∗
(0.001) −0.002 ∗
(0.001) −0.003 ∗
(0.001) −0.002 ∗ (0.001)
AGE(EN T RY IN T HE BAN K) −0.058∗∗
(0.023) −0.036 ∗∗
(0.014) −0.058 ∗
(0.023) −0.036 ∗∗ (0.014)
FIXED SAL(EN T RY IN T HE BAN K) −0.737
(0.396) −(00..458244) −(00..727395) −(00..450243)
Constant 1.421
(0.964) (00..859594) (11..636117) (00..997688)
Number of Observations 422 422 422 422
∗,∗∗,∗∗∗denote statistically significant at 10%, 5% and 1% levels, respectively.
P
er
fo
rm
an
ce
-B
as
ed
C
om
p
en
sa
tio
n
vs
.
G
u
ar
an
te
ed
C
om
p
en
sa
tio
n
2
5
Table 5: Manager’s determinants for leaving the bank
Dependent Variable: Probability (Manager leaves the bank (sample))
Model 10: Logit Model 11: Logit Model 12: Logit Model 13: Probit
PERFORMAN CE JAN07
0.100
(0.513) 0(0..110514) (00..004300) (00..013301)
CON T RACT JAN07 −0.140
(0.185) −(00..076106)
SEX −0.545∗∗
(0.186) −0.547
∗∗
(0.187) −0.318
∗∗
(0.109) −0.319
∗∗
(0.109)
EXP JAN07 −0.055
(0.037) −0(0..061038) −(00..033021) −(00..035022)
(EXP JAN07)2 0.001
(0.001) 0(0..001001) (00..000001) (00..000001)
AGE JAN07 −0.033
(0.020) −0(0..035020) −(00..018011) −(00..019011)
FIXED SAL JAN07 0.627
(0.381) 0(0..605382) (00..349217) (00..337218)
Constant 0.286
(0.744) 0(0..470785) (00..159437) (00..252456)
Number of observations 782 782 782 782
∗,∗∗,∗∗∗denote statistically significant at 10%, 5% and 1% levels, respectively.
Columns (1) and (2) of Table 5, Models 10 and 11, present estimates of the impact of a manager’s performance at the beginning of the sample,
mea-sured byPERFORMAN CE JAN07, on the probability of the manager leaving
the bank using a logit model. Column (1) does not control for contract type (guaranteed variable salary versus variable remuneration for performance), and Column (2) does control by contract type. Both estimations show that the
performance of the manager does not seem to affect the manager’s chances of
leaving the bank.
Columns (3) and (4) of Table 5, Models 12 and 13, estimate the impact of a manager’s performance at the beginning of the sample, measured by the performance in January 2007, on the probability of the manager later leaving the bank using a probit model. Column (3) does not control by contract type (guaranteed variable salary versus variable remuneration for performance), and Column (4) does control by contract type. Both estimations show that the
performance of the manager does not seem to affect the manager’s chances of
leaving the bank.
The estimates in Table 5 indicate that there is no evidence that the proba-bility of a manager leaving the bank is related to the manager’s productivity.
Thus, we have evidence that the estimation of the causal effect by a panel data
fixed effect estimator, Model 5, is not biased.
The Model 5 estimator would also be biased if managers who entered the bank (sample) had lower productivity (performance) and therefore were hired subject to a guaranteed variable salary contract.
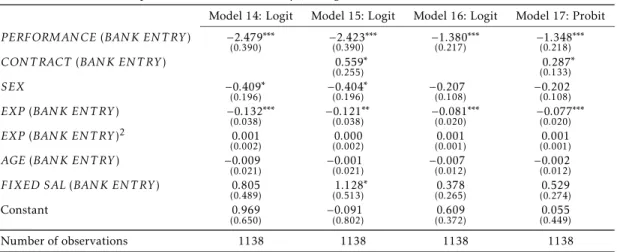
To investigate this relationship, we estimate the probability of a manager being in the bank (sample) in 2008 or 2009 as a function of the manager’s per-formance at the time of entry into the bank and the manager’s characteristics, such as gender, age, experience and fixed salary in the bank. Table 6 presents the results of these estimations.
Columns (1) and (2) of Table 6, Models 14 and 15, present the estimates of the impact of the manager’s performance at entry into the bank, as
mea-sured by PERFORMAN CE(BAN K EN T RY), on the manager’s probability
of entry in 2008 or 2009 using a logit model. Column (1) does not control by contract type (guaranteed variable salary versus variable remuneration for performance), and Column (2) does control for contract type. Both models demonstrate that the managers entering the bank have, on average, worse per-formance than other managers.
Columns (3) and (4) of Table 6, Models 16 and 17, present the estimates of the impact of the manager’s performance at entry into the bank, as
mea-sured byPERFORMAN CE(BAN K EN T RY), on the manager’s probability of
entry in 2008 or 2009 using a probit model. Column (3) does not control by contract type (guaranteed variable salary versus variable remuneration for performance), and Column (4) does control for contract type. As in Columns (1) and (2), Regressions (3) and (4) estimate that the managers entering the bank have, on average, worse performance than other managers.
The estimates in Table 6 indicate that there is evidence that the proba-bility of a manager entering the bank is negatively related to the manager’s
productivity/performance. Thus, the panel data fixed effect estimator, Model
5, could be biased by the entry of new managers in the sample.3
3Tables A.1 and A.2 in the Appendix analyze the likelihood that a manager enters the bank
P er fo rm an ce -B as ed C om p en sa tio n vs . G u ar an te ed C om p en sa tio n 2 7
Table 6: Manager’s determinants for entering the bank: Entry in 2008 or 2009
Dependent Variable: Probability (Manager enters the bank in 2008 or 2009)
Model 14: Logit Model 15: Logit Model 16: Logit Model 17: Probit
PERFORMAN CE BAN K EN T RY) −2.446∗∗∗
(0.370) −2.370
∗∗∗
(0.371) −1.421
∗∗∗
(0.209) −1.373
∗∗∗
(0.211)
CON T RACT BAN K EN T RY) 0.969∗∗∗
(0.236) 0.503
∗∗∗
(0.126)
SEX −0.265
(0.178) −0(0.260.180) −0(0.139.101) −0(0.132.102) EXP(BAN K EN T RY) −0.109∗∗
(0.035) −0.088
∗
(0.035) −0.070
∗∗∗
(0.019) −0.063
∗∗∗
(0.019)
EXP(BAN K EN T RY)2 0.000
(0.002) −0(0.000.002) 0(0.001.001) 0(0.001.001) AGE(BAN K EN T RY) −0.054∗∗
(0.020) −0.040
∗
(0.020) −0.032
∗∗
(0.011) −0.023
∗
(0.011) FIXED SAL(BAN K EN T RY) 1.114∗
(0.440) 1.652
∗∗∗
(0.466) 0.569
∗
(0.246) 0.817
∗∗
(0.256)
Constant 2.472∗∗∗
(0.622) 0(0.686.748) 1.495
∗∗∗
(0.359) 0(0.545.427)
Number of observations 1138 1138 1138 1138
∗,∗∗,∗∗∗denote statistically significant at 10%, 5% and 1% levels, respectively.
To address this problem, we run a new Model 5 estimation using only a sub-sample with balanced panel data. In this balanced panel subsample, only those managers who have been in the sample for the entire sample period (January 2007 to June 2009) are considered. Therefore, all of the managers who entered the sample or left the bank during the period under analysis are excluded. This subsample contains 18,307 observations, which is 8,629 less
than the sample used to estimate Model 5. Note that the fixed effects estimator
with balanced data can provide us with an unbiased estimate of the parameter of interest once the potential bias caused by the entry of managers with worse performance (documented in Table 6) has been removed.
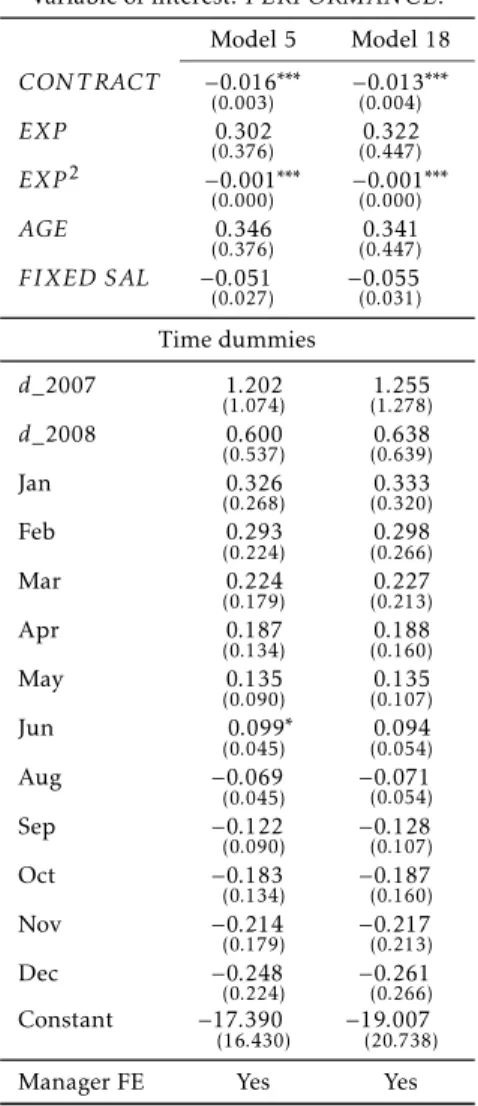
Column (2) of Table 7, Model 18, presents the results of the estimation
with balanced panel data and fixed effects. In particular, Model 18 indicates
that the estimated coefficient parameter of interestβ1 is (−0.013∗∗∗), which is
statistically significant at the 1% level. This result indicates that the problem of moral hazard explains 1.3 percentage points of the performance of unit managers who are subject to a guaranteed variable salary.
Finally, it is worth comparing the results of the coefficients for Models 5
and 18. The coefficients of interest,β1, for Models 5 and 18 are (−0.016∗∗∗) and
(−0.013∗∗∗), respectively. This result indicates that the estimated coefficients in
Models 5 and 18 have the same sign and the same order of magnitude and are statistically significant at the 1% level. Therefore, the potential bias caused by the entry of managers with poor productivity at the bank (sample) does not
seem to have a significant effect in the estimation of the causal effect between
employment contracts with variable remuneration for performance and the
effective performance of the managers in Model 5. Note also that the other
regression coefficients in Models 5 and 18 also have the same sign, the same
order of magnitude and the same degree of significance.
7
Conclusions and final remarks
The aim of this study is to evaluate the causal relationship between a guar-anteed variable salary contract and the performance of unit managers of a retail bank in Brazil. Thus, this study investigates how the application of this type of contract, which represents a substantial change in the direct incentive
system of agents, affects the performance of these unit managers.
We empirically analyze data from a large national retail bank with a fixed
effects estimator for panel data and the results (described in Section 5)
indi-cate that the performance of the unit managers subject to guaranteed variable salary contracts is inferior to the performance of unit managers subject to performance-based remuneration schemes.
Although the behavior of agents subject to a guaranteed variable salary contract is also influenced by the current monitoring and control scheme and the condition of repeated games with an appeal to the growth of these agents within the organization, the findings corroborate current economic theory and existence of the moral hazard. The results show that after controlling for unit managers’ characteristics that are fixed over time, the performance of
Performance-Based Compensation vs. Guaranteed Compensation 29
Table 7: Regressions for Model 5 and Model 18. Dependent variable:
ln(PERFORMAN CE)
Variable of interest:PERFORMAN CE.
Model 5 Model 18
CON T RACT −0.016∗∗∗
(0.003) −0.013 ∗∗∗ (0.004)
EXP 0.302
(0.376) (00..322447)
EXP2 −0.001∗∗∗
(0.000) −0.001 ∗∗∗ (0.000)
AGE 0.346
(0.376) (00..341447)
FIXED SAL −0.051
(0.027) −(00..055031)
Time dummies
d_2007 1.202
(1.074) (11..255278)
d_2008 0.600
(0.537) (00..638639)
Jan 0.326
(0.268) (00..333320)
Feb 0.293
(0.224) (00..298266)
Mar 0.224
(0.179) (00..227213)
Apr 0.187
(0.134) (00..188160)
May 0.135
(0.090) (00..135107)
Jun 0.099∗
(0.045) (00..094054)
Aug −0.069
(0.045) −(00..071054)
Sep −0.122
(0.090) −(00..128107)
Oct −0.183
(0.134) −(00..187160)
Nov −0.214
(0.179) −(00..217213)
Dec −0.248
(0.224) −(00..261266) Constant −17.390
(16.430) −19(20.007.738)
Manager FE Yes Yes
∗,∗∗,∗∗∗denote statistically significant at