ISSN 0104-6632 Printed in Brazil
Vol. 21, No. 03, pp. 497 - 507, July - September 2004
of Chemical
Engineering
TIME SERIES ANALYSIS OF PRESSURE
FLUCTUATION IN GAS-SOLID
FLUIDIZED BEDS
C. Alberto S. Felipe and S. C. S. Rocha
Laboratory of Fluid-Dynamics and Drying - LFS, School of Chemical Engineering, State University of Campinas
C. P. 6066 - 13083-970, Campinas - SP, Brazil Phone: +(55) (19) 3788-3929, Fax: +(55) (19) 3788-3922
E-mail: [email protected], E-mail: [email protected]
(Received: February 13, 2003 ; Accepted: March 15, 2004)
Abstract -The purpose of the present work was to study the differentiation of states of typical fluidization (single bubble, multiple bubble and slugging) in a gas-solid fluidized bed, using spectral analysis of pressure fluctuation time series. The effects of the method of measuring (differential and absolute) pressure fluctuations and the axial position of the probes in the fluidization column on the identification of each of the regimes studied were evaluated. Fast Fourier Transform (FFT) was the mathematic tool used to analysing the data of pressure fluctuations, which expresses the behavior of a time series in the frequency domain. Results indicated that the plenum chamber was a place for reliable measurement and that care should be taken in measurement in the dense phase. The method allowed fluid dynamic regimes to be differentiated by their dominant frequency characteristics.
Keywords: pressure fluctuation, fluidized beds, Fast Fourier Transform, spectral analysis, time series
INTRODUCTION
Fluidization is a unit operation that involves direct contact between a bed formed of fine solids and the upward flow of a fluid, liquid and/or gas, enhancing heat and mass transfer between the phases involved (Kunii and Levenspiel, 1991). Fluidized beds are used in a variety of industries such as the chemical, petroleum, metallurgical, food and pharmaceutical industries (Nelson et al., 1993). Some processes, which utilize fluidization technology, are catalytic cracking, coal combustion, drying and coating. In all of these aplications a well-defined and stable contact regime is very important.
In general, gas fluidized beds can be operated in six different regimes: particulate/homogeneous fluidization (Group A powders of the Geldart
classification only), bubbling fluidization, slugging fluidization (narrow vessels), turbulent fluidization, fast fluidization and pneumatic conveying (Trnka et al., 2000). In addition, bubbling beds can be further divided into three different modes of contact: single bubble, multiple bubble and exploding bubble (Johnsson et al., 2000).
1981). Therefore, the pressure fluctuations in a fluidized bed provide potential information about what is happening inside the fluidization column, because of its approximate relationship with the fluidization state (Kage et al., 2000).
A quantitative description of flow regimes can be obtained from time-series analysis of the fluctuation signals in in-bed measurements of pressure. This quantification is an appropriate measurement method, as is time-series analysis of the fluctuation signals measured. According to Johnsson et al. (2000), the time-series analysis for this purpose can be made in time domain, frequency domain (spectral analysis) or state-space domain (chaos analysis) and the measurements are normally made by one of two methods, differential (two points on the wall column) or absolute (one point) mode (Werther, 1999).
Although they are frequently used in research on differentiation of fluid dynamic regimes in fluidized beds, the literature does not supply definitive information on which method of pressure fluctuation measurement (differential or absolute) is more suitable for this objective or of the most appropriate axial position in the column for measurement, and whether the plenum chamber is an appropriate place for this purpose.
In this work, pressure fluctuations were measured in a fluidization column and its plenum chamber, using differential and absolute pressure transducers connected to a data acquisition system. The electrical signals captured by the acquisition system allowed construction of real time power spectra by Fast Fourier Transform (FFT) and monitoring and differentiation of all states of fluidization obtained. With these informations, it was possible to address the viability of the methodology for determining regimes of fluidization based on evaluation of the on-line power spectrum of the pressure fluctuations obtained by FFT, thereby verifying which method of pressure measurement (differential or absolute) is satisfactory for this end, the best axial location of the pressure probes in the bed and the viability of the plenum chamber as a location for measuring pressure fluctuations.
BACKGROUND
There are several methods for featuring fluidization regimes, visual observation; analysis of images; estimation of average physical properties with time, such as profile of solids axial concentration and size of air bubbles, and analysis and interpretation of pressure fluctuation signal of
fluidization columns through data acquisition (Yates and Simons, 1994). Regarding this last one, in particular, a large amount of information can be found in the literature, and the approach of discussions in the work focuses on pertinent aspects of the technique in question.
From the point of view of subsequent application in industry, the two main objectives of the intense study of the time-sampling pressure measurements in real time in fluidized beds are the identification and monitoring of the different fluidization regimes (DiMattia et al., 1997; Zijerveld et al., 1998; van Ommen et al., 1999; Trnka et al., 2000; Kage et al., 2000; Johnsson et al., 2000; Brown and Brue, 2001) and the demarcation of the transition points between regimes (Hong et al., 1990; Wilkinson, 1995; Bi and Grace, 1995; Bai et al., 1996; Zijerveld et al., 1998). In the first case, the aim was to identify a pattern in the pressure fluctuation behavior for each fluidization state, distinguishing between them with the aid of quantitative methods of time-series analysis. In the second, it was to verify the behavior of these methods in the transition between two fluidization states.
Analysis of the pressure fluctuations in the frequency domain has most often been the form adopted in attempts to quantify fluidization regimes (Hong et al., 1990; Bai et al., 1999; Kage et al., 2000; Trnka et al., 2000, Brown and Brue, 2001). Power spectral density analysis, estimated by FFT (Bendat and Piersol, 1986) has been used as a quantitative analysis in fluidization regimes, i.e., changes in power spectra as a result of changes in dynamic behavior are discussed in terms of “broadening (sharpening) of spectra” and “shift dominant frequencie”.
The Fourier Transform of a function x(t) in the finite time interval (0 to T) is defined as:
T
j2 ft 0
X(f,T)=
∫
x(t)e− π dt (1)Assuming that x(t) is sampled at N points that are equally spaced at a distance of ∆t, where ∆t is selected in such a way to produce a cut frequency ajusted to the valued physical process. The time of sampling is tn = n∆t. However, it is convenient to
begin with n = 0. Thus, we have
n
x =x(n t)∆ n=0,1,2,3...,N-1 (2)
[
]
N 1 n n 0
X(f,T) t x exp j2 fn t
−
=
= ∆
∑
− π ∆ (3)The usual selection of the discrete frequency values in the computation of X(ƒ,T) is as follows
k
k k
f k 0,1,2,3..., N-1 T N t
= = =
∆ (4)
At these frequencies, the transformed values supply the Fourier components defined for
N 1 k
k n
n 0
X(f ) 2 kn
X x exp j
t N
k 0,1,2,3,..., N-1
− − π ⎡ ⎤ = = ⎢− ⎥ ∆ ⎣ ⎦ =
∑
(5)The results provided by Equation (5) are only available up to k=N/2 by virtue of the Nyquitz frequency which occurs at this point. The FFT method is able to compute the amounts of Xk that will appear to
larger or smaller amplitude, in agreement with the characteristic of the process analyzed. This is the characteristic studied in different research areas for the description, characterization and differentiation of the most diverse phenomena (Bendat and Piersol, 1986).
MATERIALS AND EXPERIMENTAL DETAILS
Experimental System
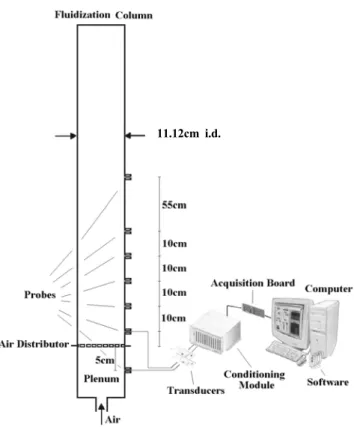
The experimental apparatus, composed of a laboratory-scale unit of a gas-solid fluidized bed and a data acquisition system, is represented in Figure 1. The main component of the system is a cylindrical column with a height of 1.5m and an internal diameter of 11.12cm. Visual observation is very important in qualitative classification because each fluidization regime has its own characteristics. For this reason, it is important that the fluidization columns are made of transparent material, usually plexiglass (the material used in the construction of the column in this work).
The air distributor is a perforated plate, projected in agreement with Geldart and Baeyens (1985) and Kunii and Levenspiel (1991) and composed of holes with 1mm diameter and a total free area of 2.5%. The pressure measurement points are located on the wall of the tube, six above the distributor and one in the plenum chamber. The measurement points will
be referred to here and later in our discussion of the results by their distance above the perforated plate as follows: 5cm, 15cm, 25cm, 35cm, 45cm and 100cm above the distributor (see Figure 1). The seventh point is located 5cm below the plate in the plenum chamber. At the end of the measurement points, flush with the inner surface of the column, a fine screen (10µm) was installed to avoid solids penetration in the pressure probes that link the measurement points to the transducers, thereby avoiding their obstruction. Air was injected into the bed by a air blower of 7.5cv’s and a gate valve allowed control of the air flow. Fluid velocity was determined with the aid of an orifice plate that had been already calibrated.
Pressure fluctuations were measured at the above-mentioned points by absolute and differential transducers. The absolute transducers used are Sealed Stainless Steel model E-07356-01, with an exit signal of 1 to 5 V and a corresponding measurement range of 0 to 30 psig, a precision of ± 0.4% and a response time of less than 5 milliseconds. The differential transducers are of the model NEMA 2 P-68014-18 with an exit signal of 4 to 20 mA for a measurement capacity of 0 to 25 inches of water and a measurement precision of ± 0.5%. The transducers were connected to the measurement points by small polyethylene tubes with an internal diameter of 3mm and a length shorter than the maximum of around 60cm recommended by van Ommen et al. (1999). The data acquisition system that receives the signals coming from the transducers is composed of the following components: a block connector and conditioner of signals, that "purifies" the information captured by the transducers, reducing noises; a PCI-6024 board with 12 bits of resolution in the A/D conversion; LabVIEW 6.0 acquisition software that obtains the power spectrum of each experiment in real time and a microcomputer (Figure 1).
Figure 1: Experimental system In fluidized beds, the predominant frequency of
pressure fluctuation is usually located below 10Hz (Johnsson et al., 2000). The frequency of sampling of the pressure measurements, conducted during the experiments in the present work (100Hz), allowed spectra with a range of 0 to 50Hz to be obtained in agreement with the Nyquist sampling theorem (Bendat and Piersol, 1986), assuring that no problem related to aliasing could distort the results.
Solids and Contact Regimes
In Table 1 information on the physical characteristics of the solids are presented. Materials used in this work were sand, fluid catalytic cracking (FCC) and microcrystalline cellulose. Granulometric distribution was obtained in a MASTERSIZER® particle-size analyzer and also by sieve and solid density, by picnometric
analysis. The minimum fluidization velocity was also determined for all particles. The experimental conditions are shown in Table 2 and were defined after conducting the preliminary tests.
As observed in Table 2, three different fluid dynamic regimes were obtained: single bubble, characterized by the rise of only one air bubble after the coalescence of some bubbles of smaller sizes originating in the air jets near the distributor; multiple bubble or typical bubbling which unlike the first was mostly characterized by the rising and explosion of several bubbles of different sizes on the bed surface; and slugging contact regime with wall slugs for sand I, sand II and microcrystalline cellulose, and flat slugs for sand III. For each regime and experimental condition, differential and absolute pressure measurements were made at all the measurement places in the column.
Table 1: Characteristics of solids used
Solid Sand I Sand II Sand III FCC Microcrystalline
Cellulose
dp (µm) 290 470 727 92 329
ρs (g/cm3) 2.45 2.48 2.48 1.38 0.98
Umf (m/s) 0.04 0.145 0.48 0.0035 0.06
Geldart B B B A A
Table 2: Operational conditions
Solid H0(cm) U0/Umf Regime
Sand I 11 – 21 2.06 – 3.9 Multiple bubble – Slugging
Sand II 11 – 21.5 1.57 – 2.27 Multiple bubble – Slugging
Sand III 11 – 21.5 1.07 – 1.27 Single bubble – Slugging
FCC 13.5 – 20.5 2.2 Multiple bubble
Microcrystalline Cellulose 16 – 31 1.82 – 1.93 Multiple bubble
RESULTS AND DISCUSSION
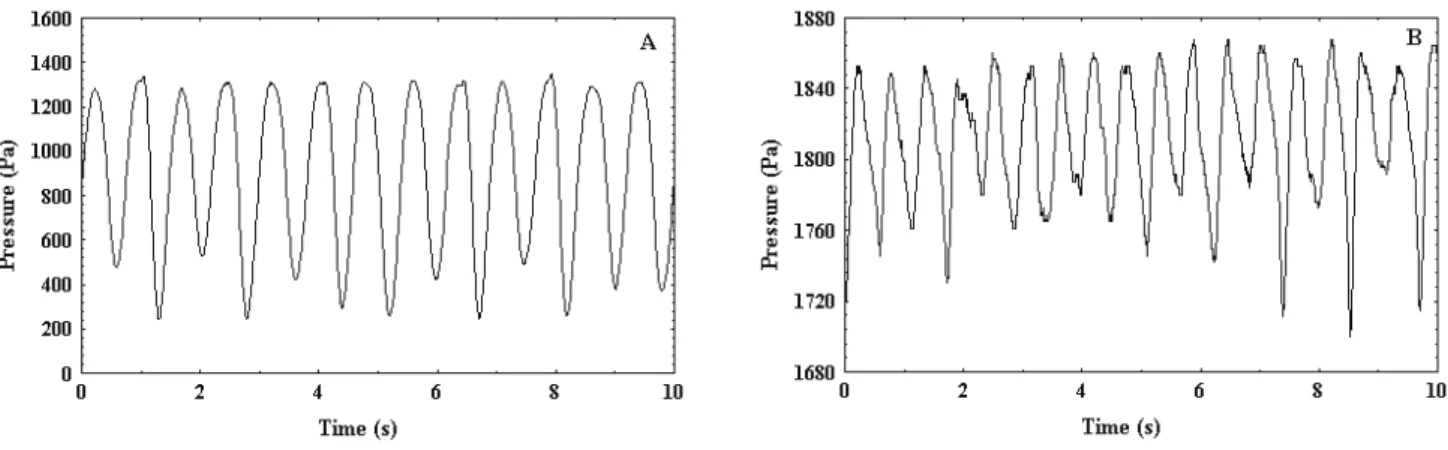
Some examples of the time-pressure behavior are given in Figure 2 for the fluidized regimes studied. Figure 2A illustrates the pressure fluctuations in slugging regime. It is obvious to associate the periodic fluctuation in pressure observed in the illustration with the oscillations in the bed of particles produced by the slugs that arise in the fluidization column, resulting in a large fluctuation on the bed surface. The piston-like movement of the bed is faithfully reproduced in Figure 2A. Single -bubble fluidization, represented in Figure 2B, shows a pressure variation without the regularity of the first, in addition to a smaller amplitude. In this regime, the air bubbles formed are smaller than the slugs, which occupy practically the whole diameter of the bed, and therefore a smaller number of particles is moved during their ascent, resulting in a smoother movement of the bed surface. Actually, the periodicity is not as strong as that observed in the slugging regime, but by observing Figure 2B more carefully, it can be verified that the pressure fluctuation in the single bubble regime varies in a relatively periodic manner.
In Figures 2C and 2D two examples of the pressure fluctuation behavior in the multiple bubble regime are shown. Comparison with the slugging and
single bubble regimes, there are large differences both in the amplitude and in the time behavior of the signals. The multiple bubbling regime has a lower amplitude due to the smaller bubble s, than the slugging and the single bubbling regimes. Also, the periodicity of the signal in the first and second regimes is not found in the multiple bubble regime. The pressure signals observed for the multiple bubble regime are complex, since the bubble movement is developed, and bubbles are of different sizes and have different displacement velocities.
Figure 2: Time sequences of the pressure fluctuations measured in (A) the slugging regime of sand with a 727 µm diameter and differential measurement at points 15 and 25cm, (B) the single bubble regime of sand with a 727 µm diameter and differential measurements at points 5 and 25cm, (C) the multiple bubble regime of FCC with a 92
µm diameter and differential measurement at the plenum point and 15cm, (D) the multiple bubble regime of sand with a 290 µm diameter and differential measurement at points 5 and 15cm.
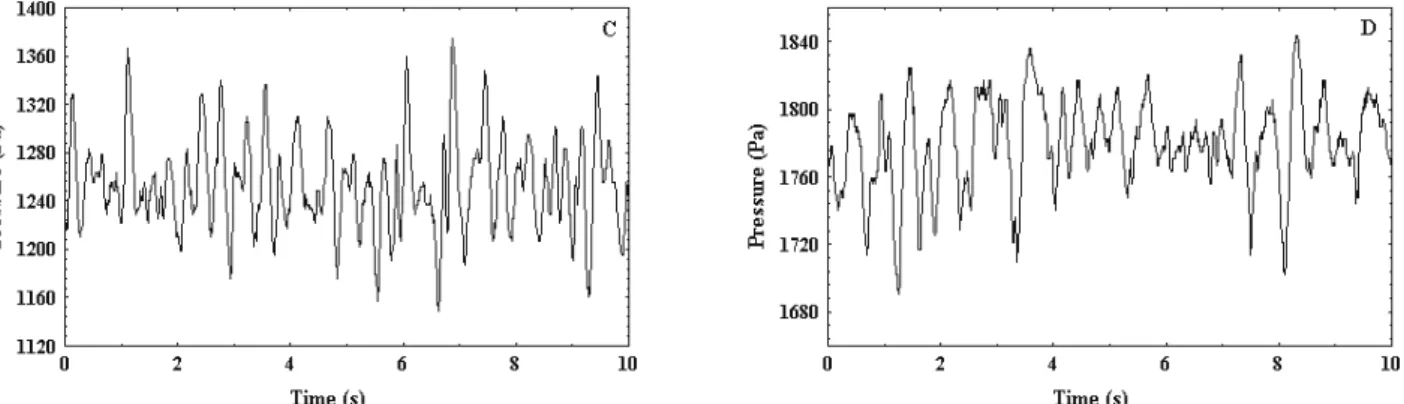
The differences in the dynamics of the three fluidization regimes are more clearly seen in the frequency domain. In Figure 3 power spectra of the slugging (A and B) and single bubble (C and D) regimes are presented. The power spectra illustrate the behavior of the pressure signals in the frequency domain. It identifies and distinguishes one or more pressure signals that are periodical (Bendat and Piersol, 1986). In the case of the slugging regime, the behavior of pressure as a function of time is verified in Figure 2A. The clear presence of just one frequency component can be observed, which demonstrates a practically perfect periodicity. It was expected to obtain power spectra such as those shown in Figures 3A and 3B, which are narrow, reflecting a dominant frequency component, in this case a frequency of 1.31 Hz. In the experiments the formation of bubbles that occupied practically the whole diameter of the bed was verified for this regime; this caused the largest expansions in the bed of the three regimes studied. The up-and-down movement of the particle bed was repetitive and continuous, similar to the movement of a piston. Associating this movement with the spectra in Figures 3A and 3B, it can be concluded that the slugs rise and explode on the bed surface successively and intermittently at a frequency of 1.31Hz under the
experimental condition studied.
Figure 3: Power spectra of (A) the slugging regime of sand with a 727 µm diameter, H0 = 21cm and absolute
measurement at point 15cm, (B) the slugging regime of sand with a 727 µm diameter, H0 = 21cm and
differential measurement at points 15 and 25cm, (C) the single bubble regime of sand with a 727 µm diameter, H0 = 11cm, and absolute measurement at the plenum point, (D) the single bubble regime
of sand with a 727 µm diameter, H0 = 21cm and differential measurement at points 15 and 25cm.
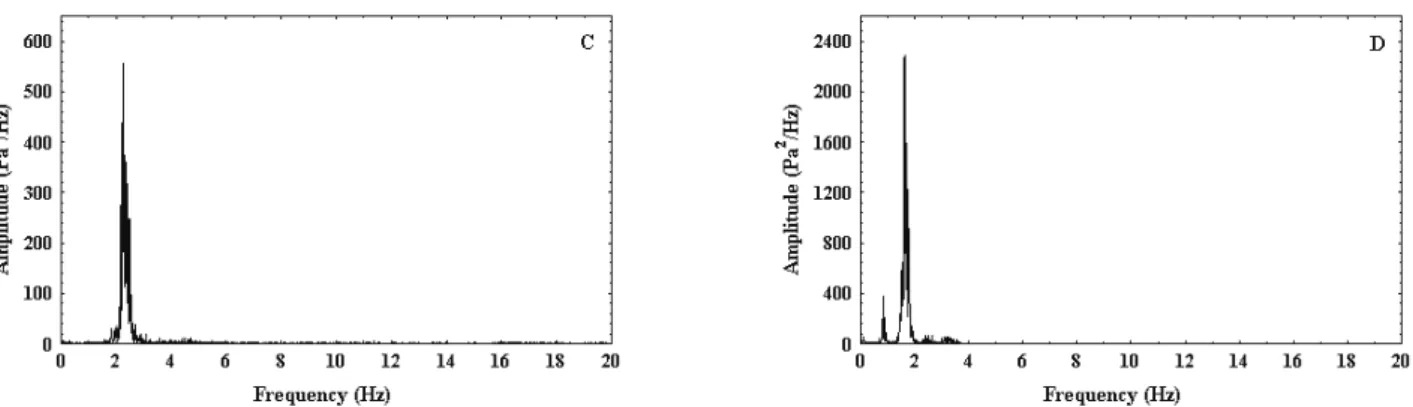
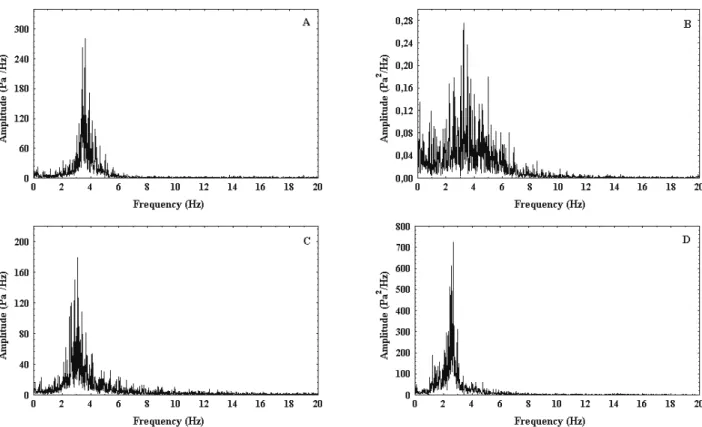
The great potential of analysis of pressure fluctuations using FFT as a tool permitting the differentiation of fluidization states was demonstrated in the analysis of the results obtained for the multiple bubble regime. Figure 4 illustrates four examples of power spectra resulting from measurement of pressure fluctuation in this regime. Much wider spectra can be observed in the multiple bubble regime than in the other two regimes. In fact, this regime behaved as a well-fluidized bed, i.e., a “typical” bubbling bed with a uniform bubble distribution and bubbles that were much smaller than the bed dimensions. The experiments in the multiple bubble bed regime were obtained with the three solids tested and showed that varying bubble size and rising velocity were important characteristics. There was a continuous passage of bubbles through the bed, and several bubbles erupted simultaneously on the bed surface. These visual observations suggest the occurrence of much wider spectra for the multiple bubble regime than for the single bubble and slugging regimes.
Another important characteristic of the power spectra profile, observed for all three fluidization regimes studied, was a frequency peak in all cases, a frequency component of a larger amplitude, almost always positioned at the center of the spectrum. This shows that, even in the multiple bubble regime, one frequency component always stands out from the others. Keeping in mind that pressure fluctuations are caused by the occurrence of air bubbles in the solids bed (Fan et al., 1981), the power spectra suggest that of the bubbles of different sizes, especially in the bubble fluidized bed, one in particular is found in larger numbers, thus standing out in relation to the others.
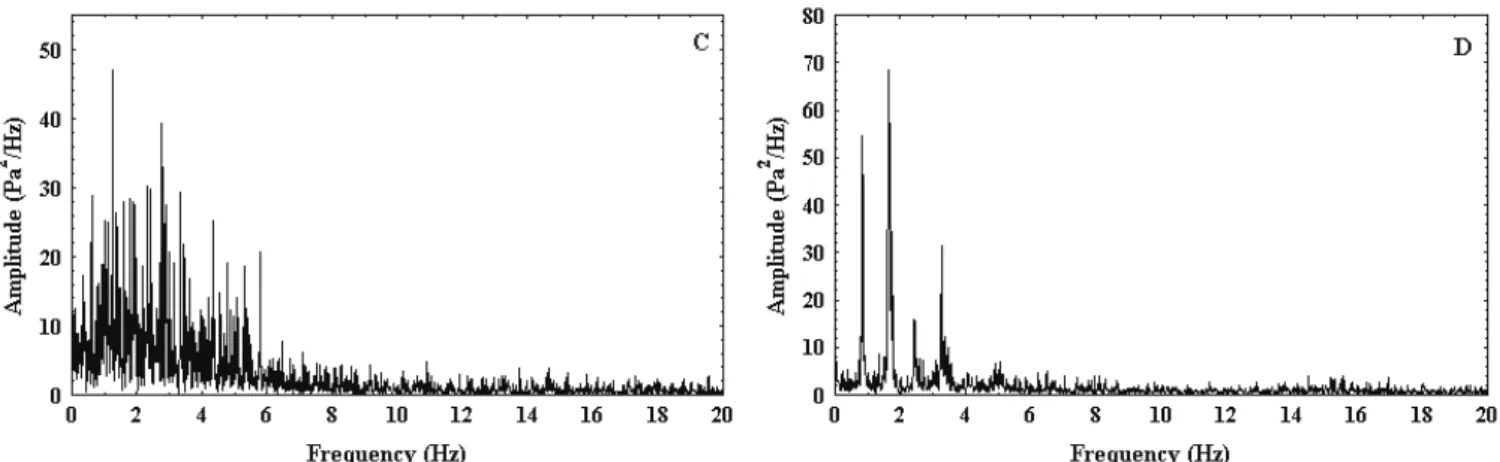
It is worth rememberin g that the three fluidization regimes studied reflected a dominant frequency, independent of different widths of the spectrum. These well-defined spectra served as reference in the discussion of the pressure measurement locations on the column wall that was not considered trustworthy with obtaining good results at the application of FFT. One of these points was located at 5cm; in some cases, spectra similar to those obtained in the appropriate places, by both absolute and differential measurement (Figures 4B and 4C) were obtained, However, in many experiments (especially those with deeper beds), the resulting power spectra of the measurements made at this point, had totally differentiated profile characteristics and almost always the absence of a dominant frequency, as can be observed in Figures 5A, 5B and 5C. The behavior of the bed area near the distributor plate is different from that of the remainder of the bed. The incidence of fluid jets coming from each one of the distributor holes contributes to the formation and coalescence of the fluid bubbles. The incidence jet height is not fixed and depends on the physical characteristics of the particles, the fixed-bed height, the diameter of the distributor holes and the superficial fluid velocity (Kunii and Levenspiel, 1991). This turbulence in the pressure probes results in spectra that are confusing and difficult to interpret, when the objective is to discover a pattern in the variation in pressure signals that represents the dynamic behavior of a fluid-particle contact regime.
the pressure probe is sometimes above and at other times below the bed surface. The behavior described above was observed in the run with sand with a 727µm diameter in single bubble regime at a fixed-bed height of 21cm (Figure 5D), when absolute measurements were made at 25cm above the
distributor plate. The spectrum referred to had characteristics that were totally different from those obtained with the probes placed at the appropriate positions, as in the spectrum shown in Figure 3C, which was obtained by absolute measurement in the plenum.
Figure 4: Power spectra of (A) the multiple bubbling regime of FCC with 92 µm, H0 = 20.5cm and absolute
measurement at plenum point, (B) the multiple bubble regime of microcrystalline cellulose with a 329 µm diameter, H0 = 16cm and differential measurement at the plenum point and 5cm, (C) the multiple bubble
regime of sand with a 290 µm diameter, H0 = 11 cm and absolute measurement at point 5cm, (D)
the multiple bubble regime of sand with a 470 µm diameter, H0 = 21cm
Figure 5: Power spectra of (A) the multiple bubble regime of sand with a 290 µm diameter, H0 = 21cm and
differential measurement at points 5 and 15cm, (B) the multiple bubble regime of sand with a 470 µm diameter, H0 = 21 cm and differential measurements at points 5 and 15cm, (C) the multiple bubble
regime of microcrystalline cellulose with a 329 µm diameter, H0 = 31 cm and absolute
measurement at point 5cm, (D) the single bubble regime of sand with a 727 µm diameter, H0 = 21cm and absolute measurement at point 25 cm.
The results obtained permit the conclusions that the plenum chamber is an appropriate location for reliable pressure measurement signals, as well as being functional, since the pressure probe is not in contact with the particles and, therefore, there is no risk of probe blockage. The data obtained do not undergo any type of dumping or interference. Kage et al. (2000) intended to determine to what extent measurements of pressure fluctuations made in the plenum chamber supply data reliable for diagnosis of bubble fluidization. The results obtained were in agreement with those observed from measurements made in other locations above the distributor plate.
In this work, similar results were verified. The power spectra of each fluid-dynamic regime, obtained by pressure measurement in the plenum, had profiles similar to those obtained when the gauge was placed in the dense phase, for both absolute and differential measurement. This can be verified by comparing Figure 6B and Figure 6D, examples of two spectra obtained in the slugging regime, under the same operational conditions with the measurements made in the plenum (absolute) and at 15 to 25cm (differential).
Reliable measurements were also obtained above the distributor, since the probes were located in an area of the dense phase where the fluid dynamics of the bed is fully developed. For the experiments in which the largest number of possible measurement points was used (fixed-bed height above 20cm), it was possible to verify that the measurements points 15 and 25cm were the ones that had the best spectra,
keeping in mind the previously defined rule for the characteristic fluid-dynamic width and the occurrence of a very well-defined dominant frequency close to the center of the spectrum.
Figure 6: Power spectra of (A) the multiple bubble regime of mic rocrystalline cellulose with a 329 µm diameter, H0 = 31cm and absolute measurement at point 25cm, (B) the slugging regime of sand with a 470 µm
diameter, H0 = 21 cm and absolute measurement at the plenum point, (C) the multiple bubble
regime of microcrystalline cellulose with a 329 µm diameter, H0 = 31 cm and differential
measurement at points 15 and 25cm, (D) the slugging regime of sand with a 470 µm diameter, H0 = 21cm and differential measurement at points 15 to 25 cm.
CONCLUSIONS
The results obtained with this work permit the following conclusions to be drawn:
1) Analysis of pressure fluctuations by FFT was shown to be a viable method for identification of fluidization regimes. It was possible to clearly distinguish three different regimes: single bubble, multiple bubble and slugging.
2) The differential and absolute methods of measuring pressure fluctuations supply similar power spectra;
3) The plenum chamber is a reliable and practical location for measurement, because it supplied the same information on the dynamics of contact regimes as supplied by the usual locations. The advantage of measuring the pressure in the plenum chamber is that pressure probes are not affected by obstruction by fine solids;
4) It was verified that when the measurement points were located very close to the bed surface or to the air distributor, the spectra that were obtained were difficult to interpret. It is, thus, recommended that in the characterization of fluidization regimes, the points of pressure measurement be maintained at the center of the bed, where the fluidization states are fully developed.
NOMENCLATURE
dp particle diameter µm
F cyclical frequency
-H0 fixed-bed height cm
N sample size
-T time variable s
T record length s
U0 air velocity m/s
x (t) time-dependent variable -X amplitude of sinusoidal x (t)
-Greek
ρs solid density g/cm
3
ACKNOWLEDGMENT
The authors are grateful to the Foundation for Research Support of the State of São Paulo (FAPESP) for its financial support.
REFERENCES
Bai, D., Grace, J.R. and Zhu, J.X., Characterization of Gas Fluidized Beds of Group C, A and B Particles Based on Pressure Fluctuations, Canadian Journal of Chemical Engineering, 77, p. 319 (1999).
Bai, D., Shibuya, E., Nakagawa, N. and Kato, K., Characterization of Gas Fluidization Regimes Using Pressure Fluctuations, Powder Technology, 87, p. 105 (1996).
Bendat, J.S. and Piersol, A.G., Analysis and Measurement Procedures, John Wiley & Sons, New York (1986).
Bi, H.T. and Grace, J.R., Effect of Measurement Method on the Velocities Used to Demarcate the Onset of Turbulent Fluidization, The Chemical Engineering Journal, 57, p. 261 (1995).
Brown, R.C. and Brue, E., Resolving Dynamical Features of Fluidized Beds From Pressure Fluctuations, Powder Technology, 119, p. 68 (2001).
DiMattia, D.G., Amyotte, P.R. and Hamdullahpur, F., Slugging Characteristics of Group D Particles in Fluidized Beds, The Canadian Journal of Chemical Engineering, 75, p. 452 (1997).
Fan, L.T., Ho, T.C. and Hiraoka, S., Pressure Fluctuations in a Fluidized Bed, AIChE Journal, 27, p. 388 (1981).
Geldart, D. and Baeyens, J., The Design of Distributors for Gas-Fluidized Beds, Powder
Technology,42, p. 67 (1985).
Hong, S.C., Jo, B.R., Doh, D.S. and Choi, C.S., Determination of Minimum Fluidization Velocity by the Statistical Analysis of Pressure
Fluctuations in a Gas-Solid Fluidized Bed, Powder Technology, 60, p. 215 (1990).
Johnsson, F., Zijerveld, R.C., Schouten, J.C., van den Bleek, C.M., and Leckner, B., Characterization of Fluidization Regimes by Time-Series Analysis of Pressure Fluctuations, International Journal of Multiphase Flow, 26, p. 663 (2000).
Kage, H., Agari, M., Ogura, H. and Matsuno, Y., Frequency Analysis of Pressure Fluctuations in Fluidized Bed Plenum and Its Confidence Limit of Detection of Various Modes of Fluidization, Advanced Powder Technology, 11, p. 459 (2000). Kunii, D. and Levenspiel, O., Fluidization Engineering. John Wiley & Sons, New York (1991).
Nelson, B.H., Briens, C.L. and Bergougnou, M.A., Pressure Fluctuations at Individual Grid Holes of a Gas-Solid Fluidized Bed, Powder Technology, 77, p. 95 (1993).
Trnka, O., Veselý, V., Hartman, M. and Beran, Z., Identification of the State of a Fluidized Bed by Pressure Fluctuation, AIChE Journal, 46, p. 509 (2000).
van Ommen, J.R., Schouten, J.C., Vander Stappen, M.L.M. and van den Bleek, C.M., Response Characteristics of Probe-Transducer Systems for Pressure Measurements in Gas-Solid Fludized Beds: How to Prevent Pitfalls in Dynamic Pressure Measurements, Powder Technology, 106, p. 199 (1999).
Werther, J., Measurement Techniques in Fluidized Bed, Powder Technology, 102, p. 15 (1999). Wilkinson, D., Determination of Minimum
Fluidization Velocity by Pressure Fluctuation Measurement, The Canadian Journal of Chemical Engineering, 73, p. 562 (1995).
Yates, J.G. and Simons, S.J.R., Experimental Methods in Fluidization Research, International Journal of Multiphase Flow, 20, p. 297 (1994). Zijerveld, R.C., Johnsson, F., Marzocchella, A.,