UNIVERSIDADE FEDERAL DO CEARÁ CENTRO DE TECNOLOGIA
DEPARTAMENTO DE ENGENHARIA DE TELEINFORMÁTICA
PROGRAMA DE PÓS-GRADUAÇÃO EM ENGENHARIA DE TELEINFORMÁTICA
ROBERTO PINTO ANTONIOLI
ADAPTIVE RADIO RESOURCE ALLOCATION ALGORITHM FOR USER SATISFACTION MAXIMIZATION IN MULTIPLE
SERVICES WIRELESS NETWORKS
ROBERTO PINTO ANTONIOLI
ADAPTIVE RADIO RESOURCE ALLOCATION ALGORITHM FOR USER SATISFACTION MAXIMIZATION IN MULTIPLE
SERVICES WIRELESS NETWORKS
Dissertação apresentada ao Curso de Mestrado em Engenharia de Teleinformática da Universi-dade Federal do Ceará, como parte dos requisi-tos para obtenção do Título de Mestre em En-genharia de Teleinformática. Área de concentra-ção: Sinais e Sistemas
Orientador: Prof. Dr. Tarcisio Ferreira Maciel
Co-Orientador: Prof. Dr. Emanuel Bezerra Ro-drigues
Dados Internacionais de Catalogação na Publicação Universidade Federal do Ceará
Biblioteca Universitária
Gerada automaticamente pelo módulo Catalog, mediante os dados fornecidos pelo(a) autor(a)
A64a Antonioli, Roberto Pinto.
Adaptive Radio Resource Allocation Algorithm for User Satisfaction Maximization in Multiple Services Wireless Networks / Roberto Pinto Antonioli. – 2017.
101 f. : il. color.
Dissertação (mestrado) – Universidade Federal do Ceará, Centro de Tecnologia, Programa de Pós-Graduação em Engenharia de Teleinformática, Fortaleza, 2017.
Orientação: Prof. Dr. Tarcisio Ferreira Maciel. Coorientação: Prof. Dr. Emanuel Bezerra Rodrigues.
1. Utility Theory. 2. Multiple Services. 3. Radio Resource Allocation. 4. Quality of Service Provision. 5. User Satisfaction Maximization. I. Título.
ROBERTO PINTO ANTONIOLI
ADAPTIVE RADIO RESOURCE ALLOCATION ALGORITHM FOR USER SATISFACTION MAXIMIZATION IN MULTIPLE
SERVICES WIRELESS NETWORKS
Dissertation presented to the Master Program in Teleinformatics Engineering at the Federal University of Ceará, as part of the requirements for obtaining the Master’s Degree in Teleinfor-matics Engineering. Concentration area: Signal and Systems.
Approved in: 10/08/2017.
EXAMINATION BOARD
Prof. Dr. Tarcisio Ferreira Maciel (Advisor) Federal University of Ceará
Prof. Dr. Emanuel Bezerra Rodrigues (Co-Advisor) Federal University of Ceará
Prof. Dr. Yuri Carvalho Barbosa Silva Federal University of Ceará
ACKNOWLEDGEMENTS
Firstly and above all, I would like to thank God for giving me health and guiding me to successfully complete one more step in my life.
I am extremely grateful to my parents, brother and all family members for their support, prayers, love, caring and sacrifices for providing a good education to form the person I am now. In special, I would like to thank my mother, Lenilce, for being such a hardworking and honorable person who raised me with love providing me with everything I needed to get to where I am now. I also thank my beloved Fernanda for the love, support, understanding and encouragement during the moments I most needed.
I would also like to thank very much my advisor Prof. Dr. Tarcisio F. Maciel and to my co-advisor Prof. Dr. Emanuel Bezerra Rodrigues, for receiving me at the Wireless Telecommu-nications Research Group (GTEL) and for the support and guidance during this master’s journey. I also thank Prof. Dr. Fco. Rodrigo P. Cavalcanti for giving me the opportunity to be part of the GTEL team.
Also, lot of thanks to all my friend at the UFC and GTEL for their sincere friendship. Special thanks goes to Diego Sousa, who helped me a lot every time I was in need.
I also thank Prof. Dr. Yuri Carvalho Barbosa Silva and Prof. Dr. Carlos Heracles Morais de Lima, whose comments helped me to greatly improve the quality of this thesis.
Finally, I acknowledge the technical and financial support from FUNCAP, Ericsson Re-search and Ericsson Innovation Center, Brazil, under EDB/UFC.40 Technical Cooperation Con-tract.
Fortaleza, August 2017.
ABSTRACT
The enriched service scope, the steep increase in mobile traffic volume, and the ever increasing number of connected devices in mobile networks coupled with the scarcity of electromagnetic spectrum have raised the importance of designing flexible and ingenious means to guarantee high user satisfaction levels. Therefore, in order to capture and maintain a representative share of the wireless communication market, effective ways to manage the scarce physical resources of cellular networks are fundamental for cellular network operators. The Radio Resource Allo-cation (RRA) algorithms are responsible for performing such a relevant and arduous task. The efficiency of such algorithms is essential so that there exists a fair resource allocation among users and the Quality of Service (QoS) requirements of each individual user are met, thus guar-anteeing high user satisfaction levels.
The recent scenarios of cellular networks are composed of a wide range of available services for mobile users, which demand conflicting QoS requirements. In order to achieve the objective of user satisfaction maximization in such networks, we formulate a utility-based cross-layer opti-mization problem targeted at maximizing the user satisfaction in multi-service cellular networks. The optimal solution of the proposed problem is very hard to be found. Thus, we mathematically manipulate the problem and derive a low complexity suboptimal solution from which we design an adaptive RRA technique. Our technique is composed of user weights and an innovative ser-vice weight that is adapted to meet the satisfaction target of the most prioritized serser-vice chosen by the network operator. Furthermore, the proposed algorithm is scalable to several classes of service and can be employed in the current and future generations of wireless systems.
RESUMO
O escopo enriquecido de serviços, o aumento acentuado do volume de tráfego móvel e o nú-mero cada vez maior de dispositivos conectados nas redes móveis, acompanhado pela escassez do espectro eletromagnético, aumentaram a importância de projetar meios flexíveis e engenho-sos para garantir altos níveis de satisfação dos usuários. Portanto, para capturar e manter uma participação representativa no mercado das comunicações sem fio, mecanismos efetivos para gerenciar os recursos físicos escassos das redes celulares são fundamentais para as operadoras das redes celulares. Os algoritmos de alocação dos recursos de rádio (do inglês,Radio Resource Allocation(RRA)) são os responsáveis por executar essa tarefa tão relevante e árdua. A eficiên-cia desses algoritmos é esseneficiên-cial para que exista uma alocação justa de recursos entre os usuários e os requisitos individuais de qualidade de serviço (do inglês,Quality of Service(QoS)) de cada usuário sejam atendidos, garantindo assim altos níveis de satisfação dos usuários.
Os cenários atuais das redes celulares são compostos por uma ampla gama de serviços disponí-veis para usuários módisponí-veis, que exigem requisitos de QoS conflitantes. Para alcançar o objetivo de maximizar a satisfação dos usuários nessas redes, formulamos um problema de otimização baseado na teoria da utilidade considerando múltiplas camadas que visa maximizar a satisfação dos usuários em redes celulares com múltiplos serviços. A solução ótima do problema proposto é muito difícil de ser encontrada. Dessa forma, nós manipulamos matematicamente o problema e derivamos uma solução subótima de baixa complexidade a partir da qual nós desenvolvemos um mecanismo adaptativo de RRA. Nosso mecanismo é composto por prioridades relacionadas aos usuários e uma inovadora prioridade relacionada ao serviço que é adaptada para atender um objetivo de satisfação dos usuários de um serviço com maior prioridade escolhido pela opera-dora da rede. Além disso, o algoritmo proposto é escalável para várias classes de serviço e pode ser empregado nas gerações atuais e futuras de sistemas celulares.
A avaliação de desempenho do algoritmo proposto foi realizada por meio de simulações sistêmi-cas em vários cenários. A avaliação foi realizada considerando diferentes cenários com múltiplos serviços. Então, o desempenho foi avaliado considerando estimativa imperfeita da informação do estado de canal (do inglês,Channel State Information (CSI)) no transmissor. Ganhos signi-ficativos foram obtidos na capacidade total do sistema em comparação com quatro algoritmos encontrados da literatura, demonstrando que a adaptabilidade e priorização do serviço feita pelo algoritmo proposto são eficazes para atingir o objetivo de maximizar simultaneamente a satisfa-ção dos usuários para múltiplos serviços.
LIST OF FIGURES
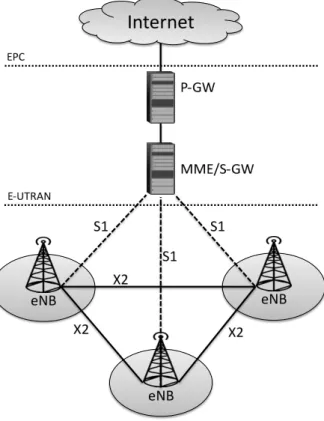
Figure 2.1 – Simplified LTE architecture illustrating the Evolved Packet Core (EPC) (com-posed of P-GW, Mobility Management Entity (MME) and Serving Gateway (S-GW)) and Evolved Universal Terrestrial Radio Access Network (E-UTRAN)
(comprised by eNBs), which together form the EPS. . . 26
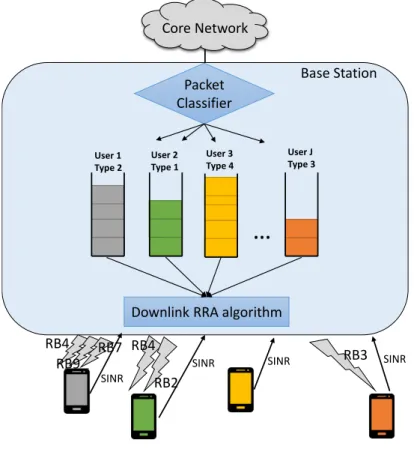
Figure 2.2 – System architecture showing the function split between EPC and E-UTRAN. 27 Figure 2.3 – Structure of radio resource allocation algorithm in the downlink of 3GPP LTE systems, which has been implemented in the simulation environment used in this thesis. . . 31
Figure 2.4 – Horizontal and vertical gains for antenna radiation pattern. . . 33
Figure 2.5 – Relationship between SNR, BLER and MCS in the LTE standard . . . 35
Figure 2.6 – Two-state (ON/OFF) Markov chain used for traffic modeling. . . 36
Figure 2.7 – Illustration of packet generation for video traffic model based on 30 FPS. . . 39
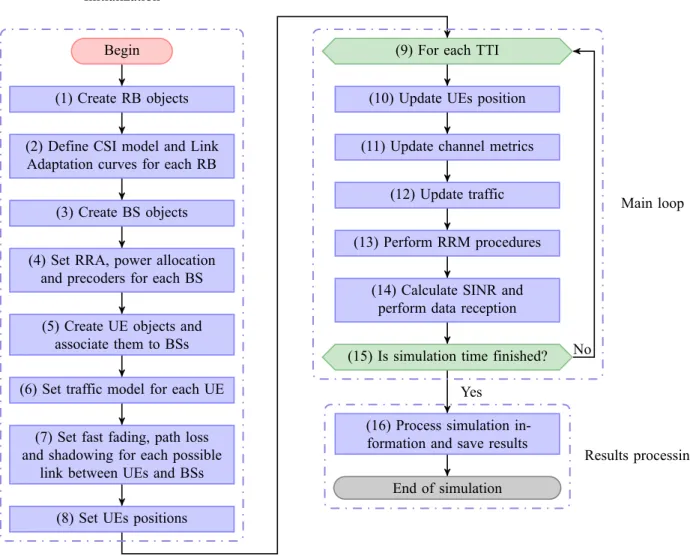
Figure 2.8 – General simulation flowchart. . . 41
Figure 3.1 – Utility functions employed by the MDU algorithm . . . 48
Figure 3.2 – Utility functions employed by the Lei algorithm for RT (such as the Voice over IP (VoIP) and video services) and Non-Real Time (NRT) (such as the Constant Bit Rate (CBR) considered in this thesis) services. . . 49
Figure 4.1 – Functions for user prioritization. . . 60
Figure 4.2 – Functions for Service Prioritization. . . 62
Figure 4.3 – Flow chart explaining all steps involved in the proposed framework. . . 64
Figure 5.1 – Satisfaction index for the single services scenarios. . . 70
Figure 5.2 – Spider chart of mix composed of 200 VoIP users and 14 CBR users. . . 71
Figure 5.3 – Satisfaction index for different traffic mixes composed of CBR and VoIP services. . . 72
Figure 5.4 – Joint capacity plane showing the system capacity regions for different traffic mixes for JSM and benchmark algorithms. . . 74
Figure 5.5 – Satisfaction index for the single services scenarios. . . 75
Figure 5.6 – Spider chart of mix 50%CBR and 50%video composed of 70 users in total. . 76
Figure 5.7 – Satisfaction index for different traffic mixes composed of CBR and video services. . . 77
Figure 5.8 – Joint capacity plane showing the system capacity regions for different traffic mixes for JSM and benchmark algorithms. . . 78
Figure 5.9 – Satisfaction index for the single services scenarios. . . 79
Figure 5.10–Spider chart of mix 25%CBR and 75%video composed of 40 users in total. . 80
Figure 5.12–Joint capacity plane showing the system capacity regions for different traffic mixes for JSM and benchmark algorithms. . . 82 Figure 5.13–Satisfaction index for the single services scenarios for different values of CSI
LIST OF TABLES
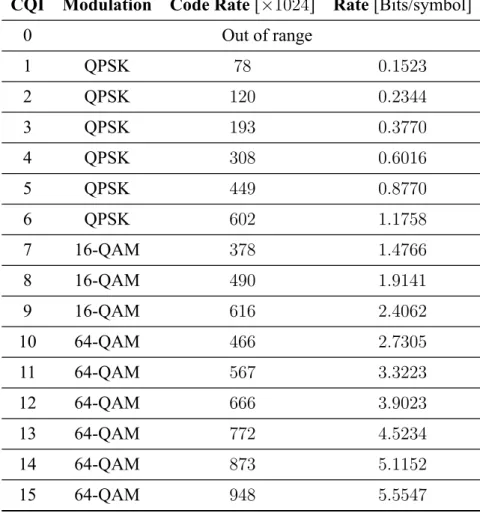
Table 2.1 – Mapping between CQI and MCS in the LTE standard. . . 34
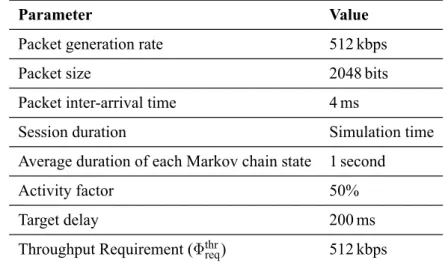
Table 2.2 – Parameters used for CBR traffic model. . . 37
Table 2.3 – Parameters used for VoIP traffic model. . . 38
Table 2.4 – Summary of parameters for packet generation of video traffic model. . . 38
Table 2.5 – Parameters used for video traffic model. . . 39
Table 5.1 – General simulation parameters. . . 66
LIST OF ABBREVIATIONS AND ACRONYMS
1G 1st Generation
3GPP 3rd Generation Partnership Project 3GPP2 3rd Generation Partnership Project 2 4G 4th Generation
5G 5th Generation
AMC Adaptive Modulation and Coding AWGN Additive White Gaussian Noise BLER BLock Error Rate
BS Base Station CBR Constant Bit Rate
CDMA Code-Division Multiple Access CQI Channel Quality Indicator
CRA Capacity-driven Resource Allocation CSI Channel State Information
DFT Discrete Fourier Transform DRA Dynamic Resource Assignment
DSM Delay-based Satisfaction Maximization eNB Evolved Node B
EPA Equal Power Allocation EPS Evolved Packet System
E-UTRAN Evolved Universal Terrestrial Radio Access Network EPC Evolved Packet Core
EXP Exponential
FDD Frequency Division Duplex FER Frame Erasure Rate
FTP File Transfer Protocol GBR Guaranteed Bit Rate
GSM Global System for Mobile Communications HARQ Hybrid Automatic Repeat Request
HOL Head Of Line IP Internet Protocol
ITU International Telecommunication Union JSM Joint Satisfaction Maximization
LTE Long Term Evolution
MCS Modulation and Coding Scheme MDU Max-Delay-Utility
MIMO Multiple Input Multiple Output MISO Multiple Input Single Output
MLWDF Modified Largest Weighted Delay First MME Mobility Management Entity
NRT Non-Real Time
OFDM Orthogonal Frequency Division Multiplexing OFDMA Orthogonal Frequency Division Multiple Access PDCP Packet Data Convergence Protocol
PDN Packet Data Network PF Proportional Fair
P-GW Packet Data Network Gateway
PHY Physical
PLR Packet Loss Ratio
QAM Quadrature Amplitude Modulation QCI QoS Class Identifier
QHMLWDF Queue-HOL-MLWDF QoE Quality of Experience QoS Quality of Service
QPSK Quadrature Phase Shift Keying
QSM Queue-based Satisfaction Maximization RAT Radio Access Technology
RB Resource Block RLC Radio Link Control RM Rate Maximization
RRA Radio Resource Allocation RRC Radio Resource Control RRM Radio Resource Management
RT Real Time
SC-FDMA Single Carrier - Frequency Division Multiple Access S-GW Serving Gateway
SINR Signal to Interference-plus-Noise Ratio SISO Single Input Single Output
SNR Signal to Noise Ratio
SORA-NRT Satisfaction-Oriented Resource Allocation for Non-Real Time Services SORA-RT Satisfaction-Oriented Resource Allocation for Real Time Services TDD Time Division Duplex
TDMA Time Division Multiple Access
TSM Throughput-based Satisfaction Maximization TTI Transmission Time Interval
TU Typical Urban TV Television UE User Equipment
UEPS Urgency and Efficiency-based Packet Scheduling UMTS Universal Mobile Telecommunications System VoIP Voice over IP
VTMLWDF Virtual Token MLWDF Wi-Fi Wireless Fidelity
LIST OF SYMBOLS
J Set of all UEs
J Total number of UEs
j Index representing an UE fromJ K Set of all RBs
K Total number of RBs
k Index representing a RB fromK Pt Total transmit power of a BS pk Power allocated for RBk
hj,k Channel coefficient of link between BS and UEj on RBk P L(d) Distance-dependent path loss
d Distance between BS and UE
σsh Log-normal shadowing standard deviation Gh(θ) Horizontal antenna gain component
θ Horizontal angle relative to the main beam positioning direction Gv(ϕ) Vertical antenna gain component
ϕ Negative angle elevation to the horizontal plane ϕtilt Downtilt angle
G(θ, ϕ) Total antenna gain
γj,k SNR of UEj on RBk σ2 Average AWGN power
rj,k Maximum achievable rate of UEj on RBk f(·) Link adaptation function
Rj Total rate allocated to UEj Kj Subset of RBs allocated to UEj
ˆ
hj,k Estimated channel coefficient of link between BS and UEj on RBk ψ Degradation of channel estimation
η Channel estimation error n Index of a given TTI
∆n CSI reporting delay Tj Throughput of UEj
Φthrreq Throughput requirement FERj FER of UEj
κdescj Number of discarded packets of UEj κsucesso
j Number of successfully transmitted packets of UEj FERreq FER requirement
Φdelayreq HOL packet delay requirement Υ Percentage of satisfied UEs
Jsat Number of satisfied UEs
x Vector of a generic QoS metric
xj Generic QoS metric
F(x) Jain’s fairness index of a generic QoS metric
ρj,k Assignment variable indicating UEj allocated on RBk U(·) General user utility function
V (·) Service utility function
S Total number of services s Index representing one service Js Set of UEs from services
Us(·) User utility function from services xs
j QoS metric of UEj from services
Uthr(·) Utility function of throughput-based services Tj[n] Throughput of UEj at TTIn
Rj[n] Total rate allocated to UEj at TTIn U′
thr(·) First derivative ofUthr(·) wj General user marginal utility wthr
j User marginal utility of throughput-based services fthru Filtering constant for throughput calculation Udelay(·) Utility function of delay-based services dhol
wdelayj User marginal utility of delay-based services
| · | Absolute value
fthru Filtering constant for throughput calculation ttti TTI duration
L Packet arrival rate Sp Packet size
Uqueue(·) Utility function of queue-based services Qj[n] Average queue size of UEj at TTIn U′
queue(·) First derivative ofUqueue(·)
wqueuej User marginal utility of queue-based services fqueue Filtering constant for queue size calculation Qj[n] Queue size of UEj at TTIn
α[n] Amount of arrival bits of UEj at TTIn ωj Source data rate of UEj
Jthr Set of UEs from throughput-based service Jdelay Set of UEs from delay-based service Jqueue Set of UEs from queue-based service ws
j Service marginal utility of UEj using services j⋆ UE selected on RBk at TTIn
arg max{·} Function that returns the maximum element from the input elements σ Value that determines shape of user utility functions
µ Value that defines if logistic utility function is decreasing or increasing xreqj General QoS requirement of UEs
ρ Proportion of general QoS metric
δ Value of user logistic function for a given value of QoS metric σthr Shape value for throughput-based user utility function
σdelay Shape value for delay-based user utility function
σqueue Shape value for queue-based user utility function
zj[n] General values of a given user marginal utility
λ Value that determines shape of service utility function
wj[n] Average waiting time of UEj at TTIn λj Satisfaction target for service 1
UV(w) Utility function for VoIP services
US(w) Utility function for streaming services UB(w) Utility function for best effort services
URT(·) Utility function for RT services
UNRT(·) Utility function for NRT services
β Value that determinesURT(·)slope
a Value that determinesUNRT(·)slope
b Value that determinesUNRT(·)amplitude
c Value that determinesUNRT(·)QoS requirement
CONTENTS
1 INTRODUCTION . . . 19
1.1 Motivation . . . 19
1.2 Thesis Scope . . . 20
1.3 Research Method . . . 21
1.4 Contributions . . . 22
1.5 Thesis Organization . . . 23
1.6 Scientific Production . . . 23
2 SYSTEM MODELING . . . 25
2.1 Introduction . . . 25
2.2 General Description of LTE Architecture . . . 25
2.2.1 Protocol Layer Design . . . 28
2.3 System Layout . . . 30
2.4 Traffic Models . . . 36
2.4.1 CBR . . . 36
2.4.2 VoIP . . . 37
2.4.3 Video. . . 38
2.5 Performance Metrics. . . 39
2.5.1 User Satisfaction . . . 40
2.5.2 Fairness . . . 40
2.5.3 Total Cell Throughput . . . 40
2.6 Simulator Flowchart . . . 40
3 RELATED WORK . . . 44
3.1 Introduction . . . 44
3.2 Related Work . . . 44
3.3 Benchmarking Algorithms . . . 46
4 SCHEDULING FRAMEWORK FOR JOINT SATISFACTION MAXI-MIZATION . . . 52
4.1 Introduction . . . 52
4.2 General Formulation. . . 52
4.3 General Multi-Service Formulation . . . 53
4.4 Scenario Particularization . . . 54
4.4.1 Throughput-Based Single Service Scenario . . . 54
4.4.2 Delay-Based Single Service Scenario . . . 55
4.4.3 Queue-Based Single Service Scenario . . . 56
4.4.4 Particularized Multiple Services Scenario . . . 57
4.6 Utility Functions for Maximization of User Satisfaction . . . 59
4.6.1 Utility Function for User Prioritization . . . 59
4.6.2 Utility Function for Service Prioritization . . . 61
4.6.3 Flow Chart of Proposed Algorithm. . . 64
4.6.4 Pseudocode and complexity of JSM Algorithm . . . 65
5 PERFORMANCE EVALUATION . . . 66
5.1 Introduction . . . 66
5.2 Simulation Assumptions . . . 66
5.2.1 Scenarios and Evaluation Method . . . 67
5.2.2 Settings for JSM and Benchmarking Algorithms . . . 68
5.3 Performance Evaluation . . . 69
5.3.1 Case Study I . . . 69
5.3.2 Case Study II . . . 73
5.3.3 Case Study III . . . 78
5.3.4 Case Study IV . . . 83
6 CONCLUSIONS AND FUTURE WORK . . . 86
BIBLIOGRAPHY . . . 89
APPENDIX A – OPTIMIZATION FORMULATION FOR THROUGHPUT-BASED SERVICES . . . 94
APPENDIX B – OPTIMIZATION FORMULATION FOR DELAY-BASED SERVICES . . . 96
APPENDIX C – OPTIMIZATION FORMULATION FOR QUEUE-BASED SERVICES . . . 98
APPENDIX D – OPTIMIZATION FORMULATION FOR MULTIPLE SERVICES . . . 101
19
1 INTRODUCTION
This is an introductory chapter where the motivation and scope of this thesis are pre-sented in sections 1.1 and 1.2, respectively. Then, the methods used for conducting the studies and performance evaluation of this thesis proposal are discussed in section 1.3. The main con-tributions os this Master’s thesis are summarized in section 1.4. Section 1.5 depicts the thesis organization, and, finally, the main scientific production during the Master program are listed in section 1.6.
1.1 Motivation
Driven by the proliferation of mobile devices, the demand for more high-quality content has experienced a steep increase, resulting in a mobile data traffic growth of 4,000-fold over the past 10 years [1]. This avalanche of the mobile traffic volume has severely stretched the available wireless spectrum, leading the academy and industry to trigger an investigation of a new generation of cellular networks [2]. The 5th Generation (5G) of mobile communication
systems is expected to be deployed beyond 2020, when it is foreseen that there will be a thousand times higher mobile traffic per unit area and 10-100 times higher user data rate [3].
The innovative mobile devices, such as smartphones and tablets, coupled with the im-provements of mobile communication networks have produced an eruption of new services and applications with a variety of QoS requirements that need to be supported by recent and future mobile networks. Among all these services, mobile multimedia applications, such as streamed video viewing and IPTV, represent a big slice of mobile traffic, accounting for 55% ot the total mobile data traffic in 2015 [1]. Besides, it is predicted that approximately 75% of the world’s mobile data traffic will be of video by 2021 [1, 4]. As an example of the mobile video traffic consumption growth, teens (aged 16-19) have increased smartphone TV/video viewing in 85% from 2011 to 2015 [4].
Pro-Chapter 1. Introduction 20
tocol (FTP) services, which sometimes require high throughput demands in case of transfers of large files. Besides the aforementioned services, a very wide range of services is available for mobile users, which poses some challenges for the network operators when it comes to fulfilling these conflicting QoS requirements in scenarios with a limited number of resources.
Therefore, the complex recent scenarios are composed of a variety of services requiring more and more bandwidth in order to have their QoS requirements satisfied. This competitive scenario complicates the network operators task of efficiently managing the scarce and limited wireless resources since they need to guarantee the highest user satisfaction possible, even in scenarios with services that demand conflicting QoS requirements.
In this context, optimized RRA algorithms are required to support the unprecedented high demand for high-quality services. The RRA algorithms are responsible for selecting which User Equipments (UEs) will have access to the system resources, where the central objective is to efficiently manage the limited radio resources to maximize revenues and user satisfaction by meeting their QoS requirements. Accommodating all users using the restricted resources available in the network would be the best scenario, however this is not always possible in overload situations. As a consequence, the network operators may want to prioritize a given user or service class according to a certain criterion. Therefore, a desired feature that might be available in RRA frameworks is the flexibility for network operators to adjust the operating point reflecting strategic decisions or customers’ trending [5].
Considering recent and complex scenarios, this thesis proposes an adaptive and low com-plexity RRA algorithm that targets the user satisfaction maximization for scenarios composed of multiple service classes with conflicting QoS requirements. Besides being normalized and unified across all service classes, the proposed algorithm employs an innovative service prioriti-zation that is adapted to meet the satisfaction target of the most prioritized service. This specific feature allows network operators to flexibly define their strategy.
1.2 Thesis Scope
The main tool used in this thesis for the development of the proposed RRA framework is the Utility Theory. This theory has been widely used in the literature for designing RRA algo-rithms for cellular networks. For instance, this theory has been used for single service scenarios in [6, 7, 8, 9], and for multi-service scenarios in [10, 11, 12]. The Utility Theory was initially conceived for applications in the economics area, where it was applied to explain the consumers’ behavior and help in the decision-taking process [13, 14]. However, this theory has also received some attention of the wireless communications research community over the last years [15].
Chapter 1. Introduction 21
allocation, where utility functions have been applied for quantifying the advantage of using particular resources [6]. A similar approach can be employed in the area of cellular networks, where an evaluation of how well the network is satisfying the users’ applications requirements could be conducted by using metrics such as throughput, FER or outage probability [16].
Therefore, the utility theory emerges as a powerful tool for the conception of RRA algo-rithms since it allows us to quantify the user satisfaction levels for a given resource allocation. Thus, it is possible to design RRA algorithm capable of achieving different levels of fairness and user satisfaction in the resource allocation process [15, 11].
The work proposed in [9] is the basis of this thesis proposal; herein, we propose to extend the single-service cases analyzed in [9] for multi-service scenarios. Together with [9], the works in [10, 11, 12] were also used for designing this thesis proposal. Based on these works, this thesis proposes a RRA algorithm for the downlink of 4thGeneration (4G) LTE cellular networks. In the
downlink, the 4G cellular networks that follow the LTE standard employ Orthogonal Frequency Division Multiple Access (OFDMA), which is the multiple access scheme studied in this thesis. More details about the LTE standard, 4G cellular networks and OFDMA are given in Chapter 2. The main objective of the proposed RRA algorithm is to maximize the user satisfaction in scenarios composed of multiples services. Satisfying a user is directly connected to meeting its QoS requirements; throughput, packet delay, jitter and FER are among the most common QoS requirements. The specific set of QoS requirements to be met depends on the service the user is accessing. In this thesis, we study scenarios composed of CBR, VoIP and video services, which have as their main QoS requirements to be met the throughput, FER and both throughput and FER, respectively. However, the amount of resource to be distributed among the users is limited. Thus, one can see that the studied scenarios are comprised of services demanding conflicting QoS requirements.
1.3 Research Method
The intrinsic characteristics of wireless communications systems, such as the fading in space and time domains as well as the time variability of the mobile radio channel, are very com-plex and difficult to be tackled mathematically. Thus, these characteristics make it intractable to conduct complete performance evaluations using an analytical/mathematical approach [17]. Additionally, the presence of a variety of different services modeled with random variables turns the evaluation by means analytical/mathematical approaches even more complex. An alternative to overcome this complexity is to use system-level simulations, which are effective and widely used in the literature.
Chapter 1. Introduction 22
object oriented programming paradigm and was developed in the context of research projects, with participation of the author of this thesis, at the Wireless Telecommunications Research Group (GTEL). More details about the modeling of this simulator are given in Chapter 2.
The proposed RRA algorithm and some benchmark algorithms were implemented in the system-level simulator and a performance evaluation was conducted based on the statistical analysis of the simulations results. The studied scenarios were simulated several times based on the Monte Carlo approach so that a reliable statistical confidence was achieved. The duration of the simulations was defined so that the main performance metrics were stable after 10% of the beginning of the simulations.
1.4 Contributions
As far as we know, none of the RRA algorithms found in the literature have proposed to maximize the user satisfaction in multi-service scenarios or to leave the choice for the network operator to decide which service has more priority during the resource allocation in the down-link of OFDMA-based cellular networks. Therefore, to the best of our knowledge, the present work is the first one to propose and evaluate the performance of a cross-layer utility-based RRA framework which has the specific objective of simultaneously maximizing the satisfaction of multiple services in the downlink of OFDMA-based systems. The proposed technique is suit-able for scenarios composed of video services, web browsing, VoIP, among others.
The main contribution of this thesis are summarized as follows:
• We formulate an utility-based optimization problem with the objective of simultaneously maximizing the satisfaction of users from distinct service classes.
• The problem is mathematically manipulated and a sub-optimal solution is derived, from which we design a low complexity RRA algorithm for maximizing the user satisfaction in recent multi-service scenario composed of video services, web browsing, VoIP, etc. The main features of the proposed algorithm are:
– Unified: the same formulation and policy is applied for all services, regardless of their main QoS metric. Furthermore, only one parametrized utility function is ap-plied for all services, thus providing a fair comparison between the services;
– Normalized: before calculating the utility-based weights for all services, we nor-malized their main QoS metric by their QoS requirement, so that our framework becomes independent of the QoS metrics;
satisfac-Chapter 1. Introduction 23
tion level of a most prioritized service. This type of adaptation is the main contribu-tion of this work;
– Flexible: The proposed framework allows the network operator to decide which service is more protected depending on their strategy, so that its satisfaction level is sustained approximately in a plateau for different traffic loads. As far as we know, this specific characteristic has never been proposed in the literature for the downlink of OFDMA-based cellular networks
• Extensive system-level simulations are conducted and a performance evaluation is carried out using the joint capacity plane, which is a complete form of evaluation since it simul-taneously illustrates the algorithms performance for single and multi-service scenarios.
In this thesis, we particularize this general framework and develop a specific algorithm for scenarios composed of mixes between video and throughput-based services, as well as for scenarios comprised by VoIP and throughput-based services.
1.5 Thesis Organization
Chapter 2 firstly provides an overview of the LTE/LTE-Advanced (LTE-A) architecture, detailing the main network entities and their functionalities. Then, we present the main assump-tions taken into account for the system model used in this thesis, which are based on the 3rd Generation Partnership Project (3GPP) LTE standard.
Chapter 3 describes a broad and general survey about works found in the literature related to the RRA research topic. Also, this chapter presents a detailed description of the benchmark algorithms used for performance comparison in this thesis.
Chapter 4 describes the mathematical formulation of the utility-based optimization prob-lem that targets the user satisfaction maximization in multi-service scenarios. A suboptimal so-lution is mathematically derived, from which a low complexity and adaptive RRA algorithm is derived, which is called Joint Satisfaction Maximization (JSM).
In Chapter 5, a performance evaluation and comparison of the proposed RRA algo-rithms and four benchmarking algoalgo-rithms is conducted. The scenarios analyzed include two multi-service scenarios composed of different mixes of distinct service classes. Furthermore, the impact of CSI imperfection at the transmitter is studied.
The main conclusions of this Master’s thesis are summarized in Chapter 6.
1.6 Scientific Production
Chapter 1. Introduction 24
• Roberto P. Antonioli, Emanuel B. Rodrigues, Tarcisio F. Maciel, Diego A. Sousa and Fco. Rodrigo P. Cavalcanti, “Adaptive Resource Allocation Framework for User Satisfaction Maximization in Multi-Service Wireless Networks”. Telecommunication Systems (first round review).
• Roberto P. Antonioli, Emanuel B. Rodrigues, Tarcisio F. Maciel, Diego A. Sousa and Fco. Rodrigo P. Cavalcanti, “Alocação de Recursos Adaptativa para Maximização da Sat-isfação dos Usuários em Redes Celulares”. XXXV Brazilian Telecommunications Sym-posium (SBrT), 2017.
In parallel to the work developed in the Master’s program that was initiated on the second semester of 2016, I have been working on other research projects related to analysis and control of trade-offs involving QoS provision. In the context of these projects, I have participated on the following papers and technical reports:
• Roberto P. Antonioli, Gabriela C. Parente, Carlos F. M. e Silva, Emanuel B. Rodrigues, Tarcisio F. Maciel and Fco. Rodrigo P. Cavalcanti, “Dual Connectivity for LTE-NR Cel-lular Networks”. XXXV Brazilian Telecommunications Symposium (SBrT), 2017.
• Roberto P. Antonioli, Emanuel B. Rodrigues, Tarcisio F. Maciel, Diego A. Sousa and Fco. Rodrigo P. Cavalcanti, “Joint Resource Allocation and Spatial Multiplexing Techniques for Satisfaction Maximization in Multi-Service Cellular Networks”, GTEL-UFC-Ericsson UFC.40, Tech. Rep., September 2016, Fourth Technical Report.
25
2 SYSTEM MODELING
2.1 Introduction
The simulations in this thesis were conducted using a system architecture that follows the 3GPP specifications for the LTE standard. In section 2.2, an overview of the LTE architecture is presented, including a description of the main entities that compose this architecture and the protocol layer functionalities performed by such entities. Then, in section 2.3, we present the main assumptions adopted during the simulations conducted in this master thesis.
2.2 General Description of LTE Architecture
The LTE standards have been standardized by 3GPP in the Release 8 with the objective of meeting the increasing performance requirements of mobile broadband services. The efforts in that standardization process resulted in the Evolved Packet System (EPS), which is com-posed of the core network part, the EPC, and the radio network evolution part, the E-UTRAN. A simplified LTE architecture is illustrated in figure 2.1 showing that the EPC consists of one control-plane node, named MME, and two user-plane nodes, called Packet Data Network Gate-way (P-GW) and S-GW. Additionally, it is also illustrated that the LTE radio access network consists of the Base Stations (BSs), also denoted as Evolved Node Bs (eNBs), that are intercon-nected via the X2 interface1and connected to the EPC through S1 interface2, which is split into
S1-MME (for the control channel to the MME) and S1-U (for the data channel to the S-GW). The LTE standard is often referred to as the 4G of mobile networks. However, many people claim that the LTE specified in the 3GPP Release 10, also known as LTE-A, is the true 4G evolution, and the LTE Release 8 is then labeled as ”3.9G”. This comes from the fact that some specifications of the LTE Release 8, such as data rates up 300 Mbits/s in the downlink and 75 Mbits/s in the uplink for user in favorable radio conditions, do not meet the 4G requirements defined by the International Telecommunication Union (ITU), which include data rates up to 1 Gbits/s. Nevertheless, it is worth noting that LTE and LTE-A is the same technology, and that LTE-A is not in any way the final evolution of the LTE standards.
LTE brought advantages for subscribers due to the new applications, such as interac-tive Television (TV) and user-generated videos, that can be offered by the LTE networks. Fur-thermore, considering the network operators’ perspective, backward compatibility with legacy networks and simpler architecture are other advantages allowed by the LTE standards. Other benefits provided by this standard are: lower communication latency, higher bandwidth that can 1 The X2 interface connects two neighboring eNBs in a peer to peer fashion to assist handover and provide a
means for rapid co-ordination of radio resources.
2 The S1 interface is a link between an eNB and an EPC, providing an interconnection point between the
Chapter 2. System Modeling 26
Figure 2.1 – Simplified LTE architecture illustrating the EPC (composed of P-GW, MME and S-GW) and E-UTRAN (comprised by eNBs), which together form the EPS.
Source: Created by the author.
be obtained by means of multi-carrier aggregation, spatial multiplexing on the downlink and uplink allowed by the Multiple Input Multiple Output (MIMO) technology and peak data rates up to 1 Gbps and 500 Mbps in the downlink and uplink, respectively [18].
LTE is a pure packet-based all-Internet Protocol (IP) architecture, which means that the core network is completely packet-switched and based on IP. The main advantage of the all-IP network technology is that it allows operators to offer efficient support to IP-based services with reduced deployment, operational costs and complexity. The LTE networks use the concept of bearer, which is an IP packet flow or logical channel with a defined QoS, to route IP traffic from the Packet Data Network (PDN) (i.e., external IP networks, such as the Internet) to the UE.
As can be seen in figure 2.1, the entry point for the LTE network is the EPC, more specifically the P-GW, which has a direct link to the S-GW/MME. In general, these entities are primarily responsible for the overall control of UEs and, along with the E-UTRAN, for the set up and release of bearers according to the requisitions sent by applications. Specific functions of these EPC entities are [19]:
Chapter 2. System Modeling 27
• MME: this is the control plane node and is responsible for authentication of UEs, ra-dio bearer and user mobility management, and interworking with other 3GPP access sys-tems, such as Global System for Mobile Communications (GSM) and Universal Mobile Telecommunications System (UMTS).
• S-GW: this is the other user plane node and is responsible for managing user data tunnels (i.e., IP packet transfer) between eNBs and the P-GW, as well as acting as local mobility anchor for inter-eNB handover and mobility to other 3GPP access technologies.
The LTE radio access network, known as E-UTRAN, consists of eNBs providing user and control plane protocol terminations towards the UE. In the LTE architecture, the eNBs are responsible for all radio interface related functions, such as: functions for Radio Resource Man-agement (RRM) related to radio admission and connection mobility control, dynamic allocation of radio resources to UEs in both uplink and downlink (scheduling), radio mobility control and radio bearers control, interference management, ciphering, handover management and power control. Also, the eNBs handles the signaling towards MME and S-GW.
In fact, the eNBs provides a user plane termination to the UEs by means of four protocol layers, namely, Packet Data Convergence Protocol (PDCP), Radio Link Control (RLC), Medium Access Control (MAC) and Physical (PHY). The control plane termination is provided by means of the Radio Resource Control (RRC) layer. Figure 2.2 illustrates a summary of all function performed by the entities located at the E-UTRAN and EPC. The protocol layers are also shown in the eNB. Let us now describe the main functionalities performed in each of these protocol layers.
Figure 2.2 – System architecture showing the function split between EPC and E-UTRAN.
Chapter 2. System Modeling 28
2.2.1 Protocol Layer Design
The RRC protocol layer is responsible for: handling the broadcasting of system informa-tion; controlling all procedures related to the establishment, modification and release of RRC connection, including the establishment of control and data radio bearers, handover within LTE and configuration of the lower protocol layers (PDCP, RLC and MAC); controlling the inter-Radio Access Technology (RAT) mobility; measurement configuration and reporting; among others functionalities [21].
The PDCP protocol layer performs ciphering and integrity check of RRC messages in the control plane. Considering the user plane, this layer is responsible for header and payload compression of IP packets. Additionally, this layer supports lossless mobility in case of inter-eNB handovers and provides integrity protection to higher layer-control protocols.
The RLC protocol layer performs the segmentation and reassembly of upper layer pack-ets in order to adapt them to the size that can actually be transmitted over the radio link interface. Another focus of the RLC is on providing lossless transmission of data for radio bearers that re-quire error-free transmission. Additionally, the RLC layer performs reordering to compensate for out-of-order reception due to Hybrid Automatic Repeat Request (HARQ) operation in the layer below [22].
The MAC layer is mainly responsible for handling uplink and downlink scheduling as well as HARQ signaling. This layer performs multiplexing of data from different radio bearers. The MAC layer aims at achieving the negotiated QoS for each radio bearer by deciding the amount of data that can be transmitted from each radio bearer and instruction the RLC to provide packets of a given size. Regarding the uplink, this process involves reporting to the eNB the amount of data at the transmiter buffer [21].
The properties presented by the PHY layer determine the characteristics of a cellular network with respect to peak data rates, latencies and coverage. The LTE PHY supports both Frequency Division Duplex (FDD) and Time Division Duplex (TDD) duplexing schemes. For the downlink, LTE uses the conventional Orthogonal Frequency Division Multiplexing (OFDM) due to robustness to time dispersion of the radio channel. For the uplink, LTE employs a Discrete Fourier Transform (DFT)-spread OFDM (also denoted as Single Carrier - Frequency Division Multiple Access (SC-FDMA)), which provides improved peak-to-average power ratio that en-ables more power efficient UEs. The PHY layer resources are utilized by physical channels and signals for transmission of data and/or control information from the MAC layer and for supporting physical-layer functionalities, respectively.
Chapter 2. System Modeling 29
as the multiple access technology. In the following, more details are given about the resource allocation architecture and the OFDMA technology.
OFDMA
The 4G cellular networks that follow the LTE standard employ OFDMA in the downlink. The time domain structure of the LTE physical layer is composed of radio frames of 10 ms, where each radio frame is subdivided into 10 subframes of length 1 ms. Looking at the frequency domain, the default subcarrier spacing is 15 kHz and all subcarriers are grouped in sets of 12 subcarriers. These definitions in the time and frequency domains lead us to definition of RB, which is the minimum scheduling unit of the considered simulator, in accordance with the LTE standard. One RB consists of 12 subcarries (e.g., 180 KHz) in the frequency domain and one sub-frame (e.g., 1 ms) in the time domain.
OFDMA is a transmission technology that extends the OFDM technology in order to provide a more flexible access to the RBs [23]. The main benefit brought by OFDMA over OFDM is that the former distributes subcarries to different users at a time, while the latter splits the frequency bandwidth into orthogonal subcarries to transmit data to a single user. Another benefit of OFDMA is the opportunity to take advantage of the frequency, multi-user, time and space diversities. There is a small probability that all frequency resources in a link have the same channel quality because of the frequency diversity. The multi-user diversity relies on the fact that users in different positions within the eNB coverage region experience channel almost independently [24]. The time diversity exists due to the time varying characteristics of the mo-bile communications channel, where the user speed might be used for estimating the speed the channel state changes. The space diversity, also known as spatial or antenna diversity, is related to the use of two or more antennas to enhance the reliability and quality of the wireless link [15].
A means for taking advantage of all these diversities is the employment of RRA algo-rithms, also referred as to scheduling algorithms. RRA algorithms are responsible for performing a selection to determine which UEs have access to the system resources and with which configu-ration. Therefore, RRA algorithms have a significant impact on system performance. Next, more details are given about RRA algorithms.
LTE-A MAC resource allocation
Chapter 2. System Modeling 30
When a UE wants to receive data from a given application, a connection (or bearer) is established between the UE and the LTE core network (i.e., the EPC). Upon establishing the bearer, a QoS Class Identifier (QCI) is assigned, which specifies whether the bearer is guaranteed bit-rate or not, target delay and loss requirements, for instance. Then, the eNB is able to translate the QCI attributes into requirements for the air interface [24]. The RRA algorithms should take into account these requirements when performing the resource assignment in order to guarantee high UE satisfaction levels.
The MAC scheduler located in the eNB is in charge of assigning both uplink and down-link radio resources. In this thesis, the interest is only on the downdown-link process. The scheduling decision covers not only the RB assignment but also which modulation and coding scheme are used [22]. Considering the LTE downlink, the available modulation schemes are Quadrature Phase Shift Keying (QPSK), 16-Quadrature Amplitude Modulation (QAM) and 64-QAM.
Let us now explain the scheduling process that happens every TTI in the downlink of LTE networks, which is illustrated in figure 2.3. A packet classifier is responsible for classifying the incoming packets of connected UEs according to their types or QoS attributes, which are used by RRA algorithms for deciding the priority of UEs in a given resource assignment decision. Before the RB assignment process, the eNB’s MAC layer first decides which Modulation and Coding Scheme (MCS) the UEs can use according to the Adaptive Modulation and Coding (AMC) strategy implemented by the network operator. The AMC algorithm chooses the MCS based on Channel Quality Indicator (CQI) values reported by the UEs, which is exemplified in figure 2.3 by the Signal to Interference-plus-Noise Ratio (SINR) values. From the chosen MCS, the amount of data (in bits) that can be transmitted on a RB to the UE is decided. Once this decision is finished, the RRA algorithm located at the eNB’s MAC layer allocates the appropriate numbers of RB to the UE, according to their QoS metrics.
2.3 System Layout
We consider the downlink transmission of a single-cell LTE cellular system based on OFDMA, so that we do not need to deal with interference management and only focus on the resource assignment. An eNB located at the center of a three sectored cell serves a set of UEs, represented byJ ={1,2, . . . , J}, which are distributed within its coverage area.
The downlink transmission multiple access scheme is based on OFDMA using a normal cyclic prefix length and considering 14 OFDM symbols per TTI. The minimum allocable radio resource considered herein is referred as a RB, which is a time-frequency chunk comprised of a time slot of 1 ms (TTI) and 12 subcarriers. The total subcarrier bandwidth is 15 kHz, which accounts for both data and pilot symbols. The system disposes of a set of RBs, represented by K={1,2, . . . , K}, to be allocated to the UEs.
Chapter 2. System Modeling 31
Figure 2.3 – Structure of radio resource allocation algorithm in the downlink of 3GPP LTE sys-tems, which has been implemented in the simulation environment used in this the-sis.
Base Station Core Network
Downlink RRA algorithm
…
Packet ClassifierUser 1 Type 2
User 2 Type 1
User 3 Type 4
User J Type 3
RB4 RB7
RB9
RB4
RB2
RB3
SINR SINR SINR
SINR
Source: Created by the author.
have demonstrated that such techniques do not impact the performance in the considered scenar-ios, which are comprised of high numbers of users and diversified QoS requirements [25, 26]. Therefore, it is assumed that the total available powerPtof each BS is equally distributed among all RBs during the transmission. Consequently, the powerpk allocated to RBkispk = Pt
K. A downlink Single Input Single Output (SISO) channel is considered, i.e., both eNB and UE are equipped with single antennas. The channel transfer function between the userjon RBkand the eNB is represented byhj,k, which is considered to be the transfer function of the mid sub-carrier that composes the resource block. The channel transfer function is calculated taking into account the main propagation characteristics of the wireless channel, namely path loss, shadowing (slow fading) and small-scale fading (fast fading).
The channel gains are constant over a TTI, but might vary from one TTI to another. The UEs are uniformly deployed within the eNB coverage area and have no mobility; therefore, in order to capture the system performance in different coverage situations, several independent snapshots considering different user distributions are taken into account during the simulations.
guar-Chapter 2. System Modeling 32
antees orthogonality among the resources.
Propagation Modeling
The radio channel model takes into account the effects that traditionally have a signifi-cant impact over the signal power received by the mobile station, such as path-loss, shadowing and fast fading. Furthermore, the eNB antenna radiation pattern plays an important role on the calculation of the total propagation gain.
Path Loss
In this thesis, we analyze two path loss models for a carrier frequency of 2 GHz. The first one is a less severe macro cell path loss model based on the propagation model presented in [27], and is given (in dB) by
P L(d) = 15.3 + 37.6·log10(d), (2.1)
wheredis the distance between UE and eNB, and is given in meters.
The second model is more severe (worse coverage) if compared to the first model. It is a modified COST231 Hata urban macro propagation model presented in [28] and is given (in dB) by
P L(d) = 34.5 + 35·log10(d), (2.2)
wheredis also expressed in meters.
Shadowing
The shadowing (slow fading) is modeled as a log-normal random variable, with mean equal to zero and standard deviationσsh = 8dB [29]. In this thesis, no spatial correlation for shadowing is considered.
Fast Fading
Chapter 2. System Modeling 33
Antenna Gain
The eNB antenna radiation pattern adopted in this thesis is an extension of the model proposed in [31], where only the horizontal angle was considered. Here, we take into account a model with vertical and horizontal antenna patterns, as proposed in [32]. In equation (2.3), the horizontal and vertical components of this radiation pattern are presented
G(θ, ϕ) =Gh(θ) +Gv(ϕ) =−min
[
12
( θ
65
)2
,30
]
+ 18 + max
−12
(
ϕ−ϕtilt
6.2
)2
,−18
, (2.3)
whereθis the horizontal angle relative to the main beam positioning direction,ϕis the negative elevation angle relative to the horizontal plane andϕtilt is the downtilt angle,Gh(θ)is the hor-izontal gain component,Gv(ϕ)is the vertical gain component andG(θ, ϕ)is the final antenna
gain. It is shown in figure 2.4 the horizontal and vertical gain forϕtilt = 10°.
Figure 2.4 – Horizontal and vertical gains for antenna radiation pattern.
(a) Horizontal Gain.
Horizontal Angle - Degrees
-180 -150 -120 -90 -60 -30 0 30 60 90 120 150 180
Horizontal Antenna Gain - dB
-15 -10 -5 0 5 10 15 20
(b) Vertical Gain.
Vertical Angle - Degrees
-20 -10 0 10 20 30 40
Vertical Antenna Gain - dB-20 -15 -10 -5 0
Source: Created by the author, adapted from [32].
Link Adaptation
Depending on the current channel conditions, an appropriate number of bits might be transmitted on each RB. This is accomplished by the AMC or link adaptation procedure, which adjust the transmission parameters according to the current users’ channel conditions.
Considering the downlink of LTE mobile networks, the UEs transmit a CQI to the eNB, which in response chooses the best MCS to be employed in the downlink transmission. The table 2.1 shows the mapping between CQI and MCS in the LTE standard. Notice that the higher the CQI (better channel conditions), the higher is the amount of bits per symbol that can be transmitted.
Chapter 2. System Modeling 34
Table 2.1 – Mapping between CQI and MCS in the LTE standard.
CQI Modulation Code Rate[×1024] Rate[Bits/symbol]
0 Out of range
1 QPSK 78 0.1523
2 QPSK 120 0.2344
3 QPSK 193 0.3770
4 QPSK 308 0.6016
5 QPSK 449 0.8770
6 QPSK 602 1.1758
7 16-QAM 378 1.4766
8 16-QAM 490 1.9141
9 16-QAM 616 2.4062
10 64-QAM 466 2.7305
11 64-QAM 567 3.3223
12 64-QAM 666 3.9023
13 64-QAM 772 4.5234
14 64-QAM 873 5.1152
15 64-QAM 948 5.5547
Source: Created by the author, adapted from [33].
higher MCS index results in a higher BLER, meaning that for operating with an acceptable low BLER, a given MCS requires a minimum SNR value [31].
The SNR value for a UEj in the RBkis given by
γj,k = pk|hj,k|
2
σ2 , (2.4)
whereσ2 denotes the average Additive White Gaussian Noise (AWGN) power in the frequency band of a RB.
We consider that the eNB employs a link adaptation mechanism that allows different transmission rates depending on the γj,k of the UEj on RB k. Given the γj,k value, the eNB selects from a set of 15 MCSs (shown in table 2.1), the one that provides the highest transmit data rate and has an estimated BLER lower than a given threshold. Therefore, the rate allocated by the eNB to the userj on RBk is
Chapter 2. System Modeling 35
Figure 2.5 – Relationship between SNR, BLER and MCS in the LTE standard.
−12 −10 −8 −6 −4 −2 0 2 4 6 8 10 12 14 16 18 20 22 24 10−7
10−6
10−5
10−4
10−3
10−2
10−1
100
SNR (dB)
BLER
MCS 15 MCS 14 MCS 13 MCS 12 MCS 11 MCS 10 MCS 09 MCS 08 MCS 07 MCS 06 MCS 05 MCS 04 MCS 03 MCS 02 MCS 01
Source: Created by the author, adapted from [34].
wheref(·)represents a link adaptation function. The total rate allocated to UEj is given by
Rj = ∑
k∈Kj
rj,k, (2.6)
whereKj ⊂ Kis the subset of RBs assigned to UEj.
CSI Imperfection
A noise term and a delay component in the CSI estimation are introduced to characterize imperfections in the estimation performed at the transmitter, i.e., at the BS. The channel is esti-mated by the UE by means of pilot symbols transmitted by the BS. Imperfect estiesti-mated channels can be modeled as described in [35] by
ˆ
hj,k[n] =√(1−ψ)hj,k[n] +√ψη[n], (2.7)
where:ψ ∈ (0,1) represents the degradation of the channel estimation; andη[n] ∈ C
repre-sents a channel estimation error, which is modeled as a Zero Mean Circularly Symmetric Com-plex Gaussian (ZMCSCG) random variable, withE{|η[n]|2}=E{|hj,k[n]|2}. Additionally, the
channel estimations reported by UEs to their BS in order to be used by the RRA algorithms are outdated by∆nTTIs, as expressed in the following:
ˆ
Chapter 2. System Modeling 36
2.4 Traffic Models
The multi-service scenarios examined in this thesis are comprised of mixes between two of the following services: CBR services, which are throughput-based; VoIP services, which are delay-based; and video services, which are queue-based. In this section, an explanation is presented describing how these services are modeled.
2.4.1 CBR
The CBR traffic model is used for emulating throughput-based services. Some examples of real applications that follow this model are audio and video transmission (Television, pay-per-view) that have a fixed rate of data transmission.
Since we assume that this service is throughput-based, it is delay tolerant. This means that, although this traffic has a target delay of 200 ms, delayed packets are not discarded, which increases the buffer size [23].
The CBR flows have been modeled using two-state (ON/OFF) Markov chains, where the ON and OFF periods are calculated by using an exponential distribution with mean of 1 second. A two-state Markov chain is illustrated in figure 2.6, where µ andλ are the state transitions probabilities. When the flow is active (ON state), fixed-size packets are generated at a fixed inter-arrival time.
Figure 2.6 – Two-state (ON/OFF) Markov chain used for traffic modeling.
μ
�
1 − �
State 0
State 1
1 − μ
State 0 State 0 State 1 State 1 State 1 State 1 State 0
...
State 0 State 1Time
Source: Created by the author.
Since the CBR service is a throughput-based service, CBR users are considered satisfied if their individual session throughput is equal or higher than a threshold(Tj ≥Φthrreq), where the
Chapter 2. System Modeling 37
Table 2.2 – Parameters used for CBR traffic model.
Parameter Value
Packet generation rate 512 kbps
Packet size 2048 bits
Packet inter-arrival time 4 ms
Session duration Simulation time
Average duration of each Markov chain state 1 second
Activity factor 50%
Target delay 200 ms
Throughput Requirement (Φthrreq) 512 kbps
Source: Created by the author.
2.4.2 VoIP
During the 1stGeneration (1G) of cellular networks, the circuit-switched voice services
were the dominant traffic source. In this thesis, we consider an evolution of this service, which is offered by the 4G cellular networks and is known as VoIP.
The VoIP service is characterized by the routing of packets over the Internet or any other IP-based computer network, which transforms the transmission of human voice in a service supported by data networks. The VoIP service is delay sensitive, that is why we consider it as a delay-based service.
The VoIP service has also been modeled using a two-state (ON/OFF) Markov chains (as illustrated in figure 2.6), where the ON and OFF periods are also calculated using an exponential distribution with mean of 1 second. For this traffic model, the active state emulates a talk spurt, when packets are generated at a constant rate and arrive at a fixed inter-arrival time.
Since the VoIP service is delay sensitive, a given packet that is not transmitted within a predetermined limit is discarded. More precisely, if the Head Of Line (HOL) packet at the eNB transmitter buffer is not transmitted within the HOL packet delay requirement, it is discarded. Besides that, packets might be discarded due to channel errors [9]. The amount of discarded packets is used for calculating the FER for a given userj as follows
FERj[n] =
κdisc j [n] κdisc
j [n] +κsuccessj [n]
, (2.9)
where κdisc
Chapter 2. System Modeling 38
Table 2.3 – Parameters used for VoIP traffic model.
Parameters Value
Packet generation rate 16 kbps
Packet size 320 bits
Packet inter-arrival time 20 ms
Call duration Simulation time
Average duration of each Markov chain state 1 second
Activity factor 50%
FER requirement (FERreq) 1%
HOL packet delay requirement (Φdelayreq ) 20 ms
Source: Created by the author.
2.4.3 Video
The video traffic model considered in this work is a queue-based video streaming service that generates packets of variable size. This variability in the packet size attempts to emulate different scenes in the video since fast scenes produces bigger frames and slow scenes generate smaller frames. We use a streaming video traffic model proposed by 3rd Generation Partnership Project 2 (3GPP2) in [36], which has been used for other works in the literature as in [37], and more recently in [38].
The source data rate proposed originally by 3GPP2, which was of 32 Kbps, is too low for present-day videos watched in recent cellular networks. Therefore, it has been adopted that the video flow is encoded at the rate of 242 Kbps, which is based on realistic video trace files that use the H.264 encoder [23]. The video traffic parameters to generate packets at 242 Kbps are detailed in table 2.4, where the distributions that control each information type are described. In figure 2.7, the packet generation of a video flow based on 30 FPS is illustrated.
The threshold for the HOL packet delay for the video service is set to be 50 ms [39]. The FER threshold for this service is 2%. The transmitter buffer at the BS is assumed to be
Table 2.4 – Summary of parameters for packet generation of video traffic model.
Information Types Distribution Distribution Parameters
Inter-arrival time between frames Deterministic 33.30 ms (based on 30 FPS) Number of packets per frame Deterministic 8
Packet Size (Mean = 126 bytes, Max = 200 bytes)Truncated Pareto K = 85 bytes,α=1.2
Inter-arrival time between packets (Mean = 2 ms, Max = 4 ms)Truncated Pareto K = 1.20 ms,α=1.2
Chapter 2. System Modeling 39
Figure 2.7 – Illustration of packet generation for video traffic model based on 30 FPS.
Source: Created by the author.
infinite, resulting in packets being discarded only when they exceed the delay threshold, not due to buffer overflow. For simulation purposes, it is assumed that the de-jitter buffer at the end user is initially full of window size of video streaming service of 2 seconds; this buffer makes the application resilient against latency and jitter [40]. The video play-out rate is equal to source data rate, i.e., packets are consumed from the user-end buffer at 242 Kbps.
Since the video service is a queue-based service, video users are considered satisfied if their individual session throughput is equal or higher than a threshold(Tj ≥Φthrreq)and their FER
is equal or lower the FER threshold (FERj ≤ FERreq). Table 2.5 summarizes the video traffic parameters.
Table 2.5 – Parameters used for video traffic model.
Parameters Value
Packet generation rate 242 kbps
Packet size Variable (see table 2.4)
Packet inter-arrival time Variable (see table 2.4)
Video duration Simulation time
FER requirement (FERreq) 2%
HOL packet delay requirement (Φdelayreq ) 50 ms
Throughput Requirement (Φthrreq) 242 kbps
Source: Created by the author.
2.5 Performance Metrics
Chapter 2. System Modeling 40
2.5.1 User Satisfaction
In terms of satisfaction, the algorithms are evaluated considering the percentage of sat-isfied users given by
Υ[n] = J
sat[n]
J , (2.10)
where Jsat[n] is the number of satisfied users in TTI n and J is the total number of users in the system. The definition of satisfaction depends on the user service class, which have been described in the previous section. Since we are analyzing multi-service scenarios, there is one satisfaction value for each service. Thus, the total set of users is split according to their service and one satisfaction index is calculated for each subset.
2.5.2 Fairness
In terms of fairness in the resource allocation process, the algorithms are evaluated by means of the well-known Jain’s index [41]. For a generic QoS metricx= [x1,· · ·, xj,· · · , xJ], the Jain’s fairness index can be calculated using the expression
F(x) = (
∑J
j=1xj
)2
J ·∑J
j=1x2j
. (2.11)
The Jain’s fairness index is independent of the QoS metric being considered and is bounded between 0 and 1 (0% and 100%). When allxj’s are equal, it means that a totally fair allocation was achieved and the fairness index is equal to 1. On the other hand, when all resources are
given to only one user, a totally unfair allocation happens and the fairness index is equal to1/J, which is 0 in the limit asJ → ∞. For throughput- and queue-based services,xj is given by the throughputTj[n]normalized by the throughput requirement, while for delay-based services,xj corresponds to the (1-FERj), which is a consequence of exceeding the HOL packet requirement. Also for the fairness index, one value is calculated for each service class in the systems.
2.5.3 Total Cell Throughput
The total cell throughput accounts for the summation of the total individual users’ through-put at the simulation end. This performance indicator along with the satisfaction index allows us to analyze the trade-off between the utilization of radio resources in terms of data rate and how well the users’ QoS requirements were satisfied.
2.6 Simulator Flowchart