* Study carried out in the Brazilian National Ministry of Health, Department of Health Oversight, Brasília (DF) Brazil.
1. General Coordinator of the Nontransmissible Diseases and Insults Sector of the Brazilian National Ministry of Health, Department of Health Oversight, Brasília (DF) Brazil.
2. Consultant for the Brazilian National Ministry of Health Department of Health Oversight, Brasília (DF) Brazil.
3. General Coordinator of Information and Epidemiological Analysis of the Brazilian National Ministry of Health Department of Health Oversight, Brasília (DF) Brazil. 4. Coordinator of the Goiânia Population-based Cancer Registry, Brasília (DF) Brazil.
Correspondence to: Deborah Carvalho Malta. Coordenação Geral de Doenças e Agravos Não Transmissíveis, Secretaria de Vigilância em Saúde do Ministério da Saúde, Esplanada dos Ministérios, Bloco G, Edifício sede, 1º andar, sala 142, CEP 70058-900, Brasília, DF, Brasil.
Tel 61 3315-3784. Fax 61 3315-2465. E-mail: [email protected] Submitted: 9 October 2006. Accepted, after review: 24 January 2007.
Deborah Carvalho Malta1, Lenildo de Moura2, Maria de Fátima Marinho de Souza3,
Maria Paula Curado4, Airlane Pereira Alencar2, Gizelton Pereira Alencar2
Abstract
Objective: To describe the mortality trends for lung cancer, cancer of the trachea, and bronchial cancer in relation to gender and age
brackets in Brazil. Methods: Data related to mortality between 1980 and 2003 were collected from the Brazilian Mortality Database. A trend analysis of mortality was carried out, nationwide and in selected states, using the LOWESS technique for rate smoothing and model adjustments. Results: In Brazil, the standardized mortality rate for lung cancer, cancer of the trachea, and bronchial cancer increased
from 7.21/100,000 inhabitants in 1980 to 9.36/100,000 inhabitants in 2003. Specific mortality rates decreased in males in the 30-49 and 50-59 age brackets. In the 60-69 age bracket, the rates for males increased from 1980 to 1995 and declined thereafter. There was a trend toward higher mortality rates in males over 70, as well as in females over 30, throughout the period evaluated. Conclusions: The decrease
in the mortality rates in younger males might have resulted from recent national interventions aimed at reducing the prevalence of smoking and reducing exposure in younger cohorts. High mortality rates in older populations remained constant due to prior tobacco use. Increased mortality rates in females are a worldwide trend and are attributable to the recent increase in smoking prevalence in females.
and by 30% to 50% in passive smokers. The inci-dence rates of lung cancer in a certain country reflect the consumption of cigarettes.(1,4) In the
male population, the habit of smoking continues to be responsible for most cases of diagnosed lung cancer, which remains a lethal disease.
The present article aims to describe the mortality trend for lung cancer, cancer of the trachea and bronchial cancer in relation to gender and age brackets in Brazil.
Methods
Data related to mortality were collected from the Sistema de Informações sobre Mortalidade (SIM, Mortality Database) of the Brazilian Department of Health Oversight.(5) For calculating the rates we used
the population counts obtained by the Brazilian Institute of Geography and Statistics in the Censuses of 1991 and 2000, population counts in 1996 and population estimates.(6) The SIM data were related
to the following causes of death: cancer of the trachea, bronchial cancer and lung cancer, based on the Ninth and Tenth Revisions of the International Classification of Diseases (ICD-9 162 and ICD-10 C33-C34).(7,8)
Trend analysis was conducted in two steps: descriptive analysis and model adjustment. In the descriptive analysis, figures with standardized mortality rates (direct method) are presented for Brazil in the 1980-2003 period. The population used for standardization was the Brazilian popula-tion in 2000. In order to facilitate the visualizapopula-tion of trends over time, we included rate smoothing, using the LOWESS technique.(9)
In order to analyze the mortality trend in each state of Brazil, negative binomial regression models were adjusted. These belong to the class of general-ized linear models.(10) For model adjustment, aiming
at the calculation of the annual percentage varia-tion of mortality rate, we used data from 1990 and 2003. This is due to a change in trend behavior over time, which occurred principally in the 1980s. This can be seen in the graphs of mortality trends. In the process of date modeling, we considered that mortality trends might be different between genders and in the various age brackets. Therefore, the response variable was the number of deaths and the explanatory variables of mortality were gender, age bracket, time (in years), the state and the
Introduction
Cancer is considered a public health problem in developed and in developing countries. Worldwide statistics show that, in the year 2000, new cases of cancer occurred in 5.3 million men and 4.7 million in women, with 6.2 million deaths (3.5 million men and 2.7 million women), corresponding to 12% of the total number of deaths from all causes. Lung cancer is the most prevalent, accounting for approx-imately 1.2 million new cases every year.(1)
The Brazilian National Cancer Institute esti-mated the number of new cases of lung cancer at 17,850 among men and 9230 among women in Brazil in 2006. These values correspond to an estimated risk of 19/100,000 men and 10/100,000 women.(1)
The total accumulated mean five-year survival rate ranges from 13 to 21% in developed countries and from 7 to 10% in developing countries.(1)
In the United States, between 1990 and 2000, there was a statistically significant reduction in deaths due to lung cancer and bronchial cancer in men. Mortality rates went from 90.6/100,000 in 1990 to 76.9/100,000 inhabitants in 2000. An increase in mortality rate among women occurred in the same period, from 36.8/100,000 inhabit-ants to 41.2/100,000 inhabitinhabit-ants.(2) It is argued that
the differences in the magnitude of rates between genders are due to the habit of smoking being more intense among men. The decline in rates among men in the last decade is attributed to the reduction in the smoking habit in the last decades. The still increasing rise in mortality rates among women is attributed to the increased prevalence of smoking, which declined only in the 1970s. It is argued that 90% of deaths from lung cancer in the United States are caused by the smoking habit.(2)
In the United Kingdom, there is a trend toward a decrease in lung cancer deaths among men in all age brackets. In the case of women, this decrease has occurred since the 1990s in some age brackets (55 to 64 years and 64 to 74 years) Among women in the 44-54 age bracket, this number is stable, whereas among those over 75 years of age, the trend is toward an increase in mortality rates. There are also higher rates of lung cancer among men.(3)
The World Health Organization considers smoking a great public health problem in the history of mankind.(4) Smoking can increase the risk
Results
The number of deaths caused by cancer of the trachea, bronchial cancer and lung cancer in Brazil, according to the Brazilian mortality database in 2003 was 11,057 deaths among men and 5398 deaths among women. These values correspond to a rate of 15.2/100,000 men and 8.7/100,000 women.
In Brazil, the standardized mortality rates for lung cancer, cancer of the trachea and bronchial cancer increased from 7.2/100,000 inhabitants in 1980 to 9.4/100.000 inhabitants in 2003. However, specific mortality rates decreased in males in the 30-49 and 50-59 age brackets throughout the period evaluated (Figures 1 and 2). Among men in the 60-69 age bracket, there was an increase in death rates in the first period (1980s to 1995), followed y a decline (Figure 3). Among men over 70 and among women over 30, there is a trend toward higher mortality rates throughout the period evaluated.
In all age brackets, the rates are higher among men, and there was an increase in possible interactions. For the inclusion of the state
in the model, we considered SIM coverage higher than 80%, the proportion of poorly defined causes of death lower than 20% and the existence of stable data over time that allowed the adjustment of the model. The states that satisfied this criteria were as follows: Minas Gerais, Espírito Santo, Rio de Janeiro, São Paulo, Paraná, Santa Catarina, Rio Grande do Sul, Distrito Federal, Mato Grosso do Sul and Mato Grosso. The state of Pernambuco was included in order to allow the comparison with a state of the northeast region, since it presents the greatest data in the region, although it does not entirely meet the criteria shown above. In 2003, there was 76% SIM coverage and 19.6% poorly defined death causes.
In order to facilitate the analysis, the tables contain three basic sources of information: the adjusted value for mortality rate in 1990 and in 2003, the annual percentage variation in this rate and the descriptive level (p value). We adopted a significance level of 5% to reject the null hypothesis that there is no difference in the annual percentage.
2005 2000 1995 1990 1985 1980
Year 5.00
4.00
3.00
2.00
Rate per 100,000
30-49 age bracket
Fit line for males Female
Male Gender
Fit line for females
Figure 1 - Specific mortality rate for cancer of the
trachea, bronchial cancer and lung cancer by gender in the 30-49 age bracket - Brazil, 1980-2003.
2005 2000 1995 1990 1985 1980
Year 40.00
30.00
20.00
10.00
Rate per 100,000
50-59 age bracket
Fit line for males Female
Male Gender
Fit line for females
Figure 2 - Specific mortality rate for cancer of the
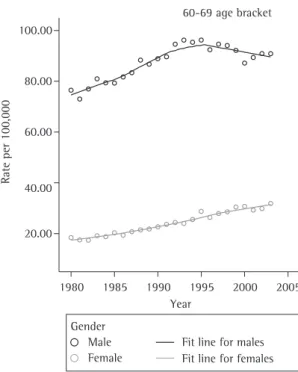
2003, the mortality rate was 90.9/100,000 men. Among the women, the increase was steady. By 2003, the rate had risen to 31.9/100.000 women, and the male/female ratio was 2.8:1 (Figure 3).
In the over-70 age bracket, the rates were ascendant during the two decades evalu-ated, increasing from 106.4/100,000 men in 1980 to 158.3/100,000 men in 2003 and from 31.8/100,000 women to 57.4/100,000 women. The male/female ratio changed from 3.4:1 to 2.8:1.
Tables 1 and 2 present annual percentage variations in the adjusted mortality rates for lung cancer, cancer of the trachea and bronchial cancer, according to gender and age bracket for the states of Pernambuco, Minas Gerais, Espírito Santo, Rio de Janeiro, São Paulo, Rio Grande do Sul, Paraná, Santa Catarina, Distrito Federal, Mato Grosso do Sul and Mato Grosso. Considering that in these states, in 2003, the percentage of deaths was higher than 80% and the proportion of poorly defined causes was lower than 20%, the comparison between rate evolution throughout that period was possible.
Through the analysis of variations in mortality rates between 1990 and 2003 in the 11 states selected, we observed that, among men, the mortality rate decreased in the 30-49 and 50-59 age brackets. The rate remained stable among men in the 60-69 age bracket and increased among men over 70. The mortality rate showed a significant increase among women in all age brackets (Table 1).
We observed a decline in mortality rates in the
states of Rio de Janeiro (−2.9%/year), Espírito Santo (−2.2%/year) and Rio Grande do Sul (−1.8%/year)
among men in the 30-49 age bracket. The state of Mato Grosso presented an increase in the mortality rate (8.1%). However, in the remaining states, there were no significant changes (Table 1).
In the states of São Paulo, Minas Gerais, Rio de Janeiro, Espírito Santo, Pernambuco, Santa Catarina and Rio Grande do Sul, there was a significant decrease in mortality among men in the 50-59 age bracket. The most significant decrease occurred in Rio Grande do Sul, where the mortality rate in 1980 was 106.2/100,000 men and decreased to 64.7/100,000 men in 2003, with a decrease of
−3.4%/year (Table 1).
There was a decrease in the lung cancer mortality rate among men in the 60-69 age bracket
in Rio de Janeiro (−1.7%/year), in Rio Grande do Sul (−1.1%/year) and in the Distrito Federal
parallel with the advance of age in both genders (Figures 1, 2 and 3).
Figure 1 shows that the 30-39 age bracket presented lower mortality rates for both genders. In 1980, the rates were 5.1/100,000 men and 1.9/100,000 women, and the male/female ratio was 2.6:1. In 2003, the rates were 4.0/100,000 men and 2.9/100,000 women, and the male/female ratio decreased to approximately 1.5:1.
Mortality rates progress in the subsequent age brackets, with a consequent increase in morbidity and mortality in the more advanced age brackets. In 1980, the rates were 35.7/100,000 men and 9.7/100,000 women in the 50-59 age bracket, and the male/female ratio was 3.7:1. These rates changed over the last two decades, resulting in a decrease among men to 32.7/100,000 and in an increase among women to 16.4/100,000 in 2003, the male/female ratio being 2:1 (Figure 2).
In 1980, in the 60-69 years age bracket, the rates were 76.5/100,000 men and 18.4/100,000 women, and the male/female ratio was 4.2:1. Between the 1980s and 1995, there was a trend toward an increase among men, followed by a decline thereafter. In
Fit line for males Female
Male Gender
Fit line for females 2005 2000 1995 1990 1985 1980
Year 100.00
80.00
60.00
40.00
20.00
Rate per 100,000
60-69 age bracket
(−2.0%/year). Mortality rates increased in the
states of Pernambuco (2.2%/year), Santa Catarina (1.3%/year), Paraná (1.1%/year) and Mato Grosso (2.9%/year) (Table 1).
In the states of Pernambuco, Minas Gerais, São Paulo, Rio Grande do Sul, Paraná and Santa Catarina there was a 1.3%/year increase in the mortality rate among men over 70. The greatest increase (8.4%/year) occurred in the state of Mato Grosso, whereas in Rio de Janeiro there was a decrease of
−1.1%/year (Table 1).
There was an increase in mortality rates among women in the 30-39 age bracket in the states of Pernambuco (3.8%/year), São Paulo (2.9%/year), Rio de Janeiro (2.5%/year), Santa Catarina (2.7%/year) and Rio Grande do Sul (2.1%/year) (Table 2).
The mortality rate among women in the 50-59 age bracket increased in Pernambuco (5.1%), Mato Grosso do Sul (4.8%/year), Paraná (3.0%/year) and São Paulo (2.1%). We observed a decrease in
Espírito Santo (−1.1%/year) and Rio Grande do Sul (−0.1%/year) (Table 2).
We observed the greatest variations in mortality rates among women in the 60-69 age bracket in the following states: Mato Grosso (6.7%/year), Espírito Santo (6.0%/year), Santa Catarina (5.0%/year), Rio Grande do Sul (2.4%/year), Paraná (2.2%/year), São Paulo (1.9%/year) and Rio de Janeiro (1.5%/year) (Table 2).
Among individuals over 70, the mortality rate increased in Pernambuco and Mato Grosso do Sul, with annual variations of 4.6% and 4.2%, respec-tively. Less significant annual variations were found in the states of Minas Gerais (1.0%), São Paulo (1.4%), Paraná (1.9%), Rio Grande do Sul (2.2%) and Distrito Federal (2.3%) (Table 2).
Discussion
The results of the present study demonstrate that, in the Brazilian states selected, the standard-ized mortality rate for cancer of the trachea, lung cancer and bronchial cancer deceased among men in the 30-69 age bracket. In men over 70, the mortality continues to rise. In women, rates are ascendant for all age brackets.
The state of Rio Grande do Sul presented the highest mortality rates in 1990 and 2003. In that state, there was a reduction in the mortality rate in men in the 30-69 age bracket and an increase in
Table 1 - Adjusted mortality rates for cancer of the trachea,
bronchial cancer and lung cancer by gender in 1990 and 2003, annual percentage variation and descritpive level (p value) - Males
Age bracket
UF Adjusted rates annual % variation
p 1990 2003
30-49 PE 2.9 3.1 0.5 0.727
MG 2.6 3.1 1.4 0.103
ES 6.2 4.6 −2.2 0.004
RJ 8.2 5.6 −2.9 <0.001
SP 4.7 4.7 0.0 0.916
PR 3.6 3.4 −0.5 0.047
SC 5.9 5.3 −0.9 0.417
RS 10.0 7.9 −1.8 0.003
DF 2.9 3.5 1.4 0.572
MS 3.8 3.7 −0.2 0.931
MT 1.7 4.6 8.1 <0.001
Brazil 4.3 4.0 −0.6 0.053
50-59 PE 14.0 18.9 2.3 <0.001
MG 25.3 20.9 −1.4 0.023
ES 26.6 24.8 −0.5 0.031
RJ 66.8 44.1 −3.2 <0.001 SP 44.6 36.9 −1.4 <0.001
PR 36.1 33.8 −0.5 0.472
SC 64.5 51.3 −1.8 0.015
RS 106.2 67.6 −3.4 <0.001
DF 39.8 28.9 −2.4 0.123
MS 31.2 32.1 0.2 0.881
MT 19.1 26.0 2.4 0.166
Brazil 38.9 31.4 −1.6 <0.001
60-69 PE 41.6 55.2 2.2 0.005
MG 61.5 58.1 −0.4 0.117
ES 75.3 82.0 0.7 0.500
RJ 160.6 128.6 −1.7 <0.001
SP 118.1 111.9 −0.4 0.115
PR 90.2 103.4 1.1 0.034
SC 136.9 162.3 1.3 0.018
RS 242.4 209.0 −1.1 <0.001
DF 102.8 78.7 −2.0 0.142
MS 78.1 80.8 0.3 0.825
MT 48.0 69.6 2.9 0.040
Brazil 93.6 91.0 −0.2 0.331
≥70 PE 48.5 89.7 4.9 <0.001
MG 109.3 120.3 0.7 0.079
ES 134.5 152.3 1.0 0.291
RJ 245.4 213.8 −1.1 0.002
SP 196.0 215.7 0.7 0.004
PR 141.7 207.7 3.0 <0.001 SC 195.2 254.3 2.1 <0.001
RS 316.8 341.2 0.6 0.003
DF 225.2 235.7 0.4 0.782
MS 147.0 136.8 −0.6 0.619
MT 57.9 164.3 8.4 <0.001 Brazil 134.8 159.9 1.3 <0.001
men over 70. Among women, there was an increase in all age brackets. In Santa Catarina and Rio de Janeiro, the higher mortality rates occurred, being surpassed only by Rio Grande do Sul. Women, prin-cipally those in the 60-69 age bracket, presented the highest mortality rates in the south and south-east regions.
The association between lung cancer, cancer of the trachea, bronchial cancer and smoking is well established in literature.(2) Smoking cessation
is the factor that has the greatest positive impact on the incidence of cancer.(4,11) The most significant
reduction would be in the incidence of lung cancer and other cancers, including those of the mouth, pharynx, larynx, esophagus, bladder, pancreas and kidney.(11,12) Other etiological factors, such as
expo-sure to mineral dust, silica, asbestos and pesticides, as well as to radioactive agents such as radon, have been linked to lung cancer.(13,14)
The risk attributed to smoking as an etiological agent of lung cancer is greater than 90%, which makes it potentially susceptible to preventive meas-ures of public health.(2,15,16)
The association between smoking and the development of lung cancer was suggested for the first time in England, in 1927.(13) The first studies
confirming the association between smoking and cancer were those conducted by Doll & Hill.(15)
We believe that, by the year 2030, smoking will be the major isolated cause of mortality and could be responsible for 10 million deaths annually.(12)
According to the Brazilian National Health and Nutrition Survey, among individuals over 15 years of age, approximately 40% of men and 26% of women were smokers in 1989. In 2003, the Household Survey on Risk Behavior and Morbidity Referred to Diseases and Non-transmissible Risks, conducted in 16 capitals in Brazil, showed that this tendency is maintained in most capitals.(16) By
comparing the prevalence of smoking observed in the 1989 Brazilian National Health and Nutrition Survey to the 2002/2003 Brazilian Prevalence of Risk factors in Nontransmissible Chronic Illnesses Survey, we observed a reduction in the prevalence of smoking during that period.(16,17) The decline
in the total prevalence of smoking was 20.8% in Manaus, 45.2% in Belém, 38.5% in Natal, 35.7% in Recife, 41.7% in Campo Grande, 34.6% in the Distrito Federal, 43.3% in Rio de Janeiro, 33.3% in São Paulo and 10.3% in Porto Alegre.(16)
Table 2 - Adjusted mortality rates for cancer of the trachea,
bronchial cancer and lung cancer by gender in 1990 and 2003, annual percentage variation and descriptive level (p value) - Females.
Age bracket
UF Adjusted rates annual % variation
p 1990 2003
30-49 PE 1.5 2.4 3.8 0.020
MG 1.8 2.1 1.2 0.251
ES 1.7 1.9 1.0 0.695
RJ 2.9 4.0 2.5 0.002
SP 2.1 3.0 2.9 <0.001
PR 2.4 2.6 0.6 0.645
SC 2.1 2.9 2.7 0.100
RS 3.8 5.0 2.1 0.015
DF 2.3 1.7 −2.0 0.483
MS 2.7 2.7 0.0 0.996
MT 2.0 2.3 1.1 0.693
Brazil 2.0 2.7 2.5 <0.001
50-59 PE 6.3 12.0 5.1 <0.001
MG 8.7 10.1 1.2 0.176
ES 18.9 16.3 −1.1 0.002
RJ 18.0 17.5 −0.2 0.749
SP 12.9 16.9 2.1 <0.001 PR 14.0 20.7 3.0 <0.001
SC 16.5 19.1 1.1 0.348
RS 24.5 24.2 −0.1 0.049
DF 9.6 14.7 3.4 0.202
MS 10.7 19.7 4.8 0.036
MT 8.7 14.9 4.2 0.111
Brazil 11.6 15.0 2.0 <0.001
60-69 PE 14.2 19.1 2.3 0.052
MG 20.1 22.2 0.8 0.263
ES 15.6 33.5 6.0 <0.001
RJ 32.0 38.8 1.5 0.005
SP 26.0 33.1 1.9 <0.001
PR 35.8 47.8 2.2 0.002
SC 17.5 33.0 5.0 <0.001
RS 40.2 54.3 2.4 0.002
DF 40.6 33.5 −1.5 0.462
MS 26.9 37.3 2.5 0.193
MT 11.1 25.9 6.7 0.015
Brazil 23.2 32.0 2.5 <0.001
≥70 PE 16.1 28.8 4.6 <0.001
MG 41.7 47.7 1.0 0.076
ES 49.7 62.5 1.8 0.177
RJ 58.4 62.8 0.6 0.257
SP 57.7 69.3 1.4 <0.001
PR 64.7 82.9 1.9 0.005
SC 55.4 62.9 1.0 0.313
RS 64.5 86.0 2.2 0.004
DF 61.5 82.9 2.3 0.030
MS 47.7 81.9 4.2 0.013
MT 41.1 62.4 3.3 0.133
Brazil 42.0 56.1 2.2 <0.001
The results of this analysis demonstrate that lung cancer in Brazil presents a distribution pattern with a reduction in mortality for males and an increase in mortality for females. Therefore, these data might be used in the planning of public policies, aiming at smoking prevention and control in Brazil, since they show the need to develop new strategies and meas-ures for the prevention and control of smoking, especially among the women.
References
1. Brasil. Ministério da Saúde. Secretaria de Atenção à Saúde. Instituto Nacional de Câncer. Coordenação de Prevenção e Vigilância. Estimativa 2006: Incidência de câncer no Brasil. Rio de Janeiro: INCA; 2005. p. 98.
2. Stewart SL, King JB, Thompson TD, Friedman C, Wingo PA. Cancer mortality surveillance--United States, 1990-2000. MMWR Surveillance Summ. 2004;53(3):1-108.
3. Swerdlow A. Trends and Risk Factors. In: Swerdlow A, Dos Santos-Silva I, Doll R, editors. Cancer incidence and mortality in England and Wales. Oxford: Oxford University Press; 2001. p.200-88.
4. World Health Organization [Homepage on the Internet]. Geneva: World Health Organization, 2007. World no tobacco day 2004 materials [cited 2004 Sep 01]. Available from: http://www.who.int/tobacco/resources/publications/ wntd/2004/en
5. Ministério da Saúde [Homepage on the Internet]. Brasil: Sistema de Informação sobre Mortalidade Brasil do ano 2000: [cited 2003 Jun 16]. Available from: http://www. saude.gov.br/
6. Instituto Brasileiro de Geografia e Estatística [Homepage on the Internet]. Brasília: Instituto Brasileiro de Geografia e Estatística, 2007. População residente censo 2000: Brasil, unidades da federação e municípios, 2000 [cited 2003 Jun 16]. Available from: http://www.ibge.gov.br/
7. Organização Mundial da Saúde. Manual da Classificação Internacional de Doenças, Lesões e Causas de Óbitos. 9ª Revisão. Ed. Edusp: São Paulo;1978.
8. Organização Mundial da Saúde. Classificação estatística internacional de doenças e problemas relacionados à saúde: Classificação Internacional de Doenças-10ª revisão. Ed. Edusp São Paulo;1995.
9. Härdle W. Smoothing techniques with implementation in S. New York: Springer-Verlag; 1991.
10. McCullagh P, Nelder JA. An outline of generalized linear models. In McCullagh P, Nelder JA. Generalized linear models. 2nd ed. London: Chapman & Hall; 1989. p.21-44. 11. Doll R, Peto R. Avoidable causes. In: Doll R, Peto R. The
causes of cancer: quantitative estimates of avoidable risks of cancer in the United States today. Oxford: Oxford University Press; 1981.
12. Menezes AMB, Horta BL, Oliveira ALB, Kaufmann RAC, Duquia R, Diniz A, et al. Risco de câncer de pulmão, laringe e esôfago atribuível ao fumo. Rev Saúde Pública. 2002;36(2):129-34.
13. Zamboni M. Epidemiologia do câncer do pulmão. J. Pneumol. 2002; 28(1):41-7.
According to the data of this same survey in 2003, in the cities of the south and southeast regions, the prevalence of smoking among women is already approximate to that observed among men. This fact demonstrates the increase in the exposure to tobacco among women, probably as a result of publicity campaigns aimed at this population group, leading to the incidence of this type of cancer.(16)
Significant differences in the mortality rates between genders were found. A reduction of the proportion between rates for men and women occurred during the period evaluated. This might reflect the tendency toward a reduction of the prev-alence of smoking among men in that period and an increase in the prevalence among women during the same period. This tendency has been discussed by other authors in Brazil, the United States and the United Kingdom.(2,3,11,16,17)
Aiming at the prevention and control of smoking, the National Program for the control of Smoking was implemented in Brazil. This program has been coordinating educational and preventive interven-tions, as well as articulating regulatory measures. Measures related to an increase in prices and taxes, as well as the congressional approval of law 9294/96, which prohibits smoking in public places, were implemented. In 1999, the Brazilian National Health Products Oversight Agency began to regu-late, control and monitor products derived from tobacco, using the definitions of maximum tar levels allowed for cigarettes; product packaging and labe-ling regulation; restricting marketing; prohibiting smoking in planes and other public forms of trans-portation, as well as prohibiting tobacco advertising on the Internet. These measures are important and should be amplified in order to reduce exposure to smoking in Brazil, considering the implementation of the Framework Convention on Tobacco Control in Brazil and worldwide.(16)
Lung cancer presents a long period of latency. Therefore, the trend toward a decrease in mortality rate among younger men in Brazil might be the result of national interventions to reduce the preva-lence of smoking in Brazil in recent years, reducing the exposure to younger cohorts. High mortality rates in older populations remained constant due to prior tobacco use.(16) Increased mortality rates
domiciliar sobre comportamentos de risco e morbidade referida de doenças e agravos não transmissíveis: Brasil, 15 capitais e Distrito Federal, 2002-2003. Rio de Janeiro: INCA; 2004.
17. Brasil. Ministério da Saúde. Instituto Nacional de Alimentação e Nutrição. Perfil de crescimento da população brasileira de 0 a 25 anos: Pesquisa Nacional sobre Saúde e Nutrição. Brasília: INAN; 1990.
14. Castro MSM, Vieira VA, Assunção RM. Padrões espaço-temporais da mortalidade por câncer de pulmão no Sul do Brasil. Rev Bras Epidemiol. 2004;7(2):131-43.
15. Doll R, Hill AB. Mortality in relation to smoking: ten years observations of British doctors. Br Med J. 1964;1(5395):1399-410.